1
Universidade de Pernambuco, Escola Superior de Educação Física, Programa Associado de Pós-Graduação em Educação Física. R. Arnóbio Marques, 310, Santo Amaro, 50100-130, Recife, PE, Brasil. Correspondência para/Correspondence to: MAM SANTOS. E-mail: <[email protected]>.
2
Universidade Federal de Pernambuco, Centro Acadêmico de Vitória de Santo Antão, Departamento de Educação Física e Ciências do Esporte. Vitória de Santo Antão, PE, Brasil.
3
Universidade do Porto, Faculdade de Desporto, Centro de Investigação, Formação e Inovação em Desporto. Porto, Portugal.
Support: Conselho Nacional de Desenvolvimento Científi co e Tecnológico (nº 448482/2014-2).
Como citar este artigo/How to cite this article
Santos MAM, Verçosa MF, Gomes TNQF, Maia JAR, Leandro CG. Birth weight, physical growth and body composition in children: A longitudinal study. Rev Nutr. 2018;31(3):287-97. http://dx.doi.org/10.1590/1678-98652018000300003
Birth weight, physical growth and
body composition in children: A
longitudinal study
Peso ao nascer, crescimento físico e
composição corporal de crianças
:
um estudo longitudinal
Marcos André Moura dos SANTOS1 0000-0002-2734-8416
Marcela de França VERÇOSA2 0000-0002-9628-6781
Thayse Natacha Queiroz Ferreira GOMES3 0000-0003-4991-1238
José António Ribeiro MAIA3 0000-0002-3273-0046
Carol Gois LEANDRO2 0000-0001-6176-1688
A B S T R A C T
Objective
To describe children’s physical growth (body mass and height) velocity and body composition (fat percentage and Fat Free Mass); to investigate the magnitude of interindividual differences according to age, gender and birth weight categories, as well as to examine the differences in the average trajectories of children with Low Birth Weight and Normal Weight according to international references.
Methods
composition measurements included: height, body mass, fat percentage (%Fat) and Fat Free Mass. Multilevel Modelling was used.
Results
Birth weight was not associated with physical growth and body composition markers at 7 years old or with the velocity of their changes (p>0.05). There were significant interindividual differences in the trajectories of physical growth (height and body mass; p<0.001) and body composition (%Fat and Fat Free Mass; p<0.001). In plotting on international percentile charts, the trajectories of growth and body composition were within expected values for age and gender, regardless of birth weight.
Conclusion
There are significant differences in the dynamics of stature growth, body mass and Fat Free Mass, and Low Birth Weight has no influence on this trajectory. In addition, values are within the expected range for age and sex. Keywords: Fat body. Fat Free Mass. Fat percentage. Growth Curve. Multilevel analyses.
R E S U M O
Objetivo
Este artigo teve por objetivo descrever a velocidade do crescimento físico (massa corporal e estatura) e a composição corporal (percentual de gordura e massa isenta de gordura) de crianças; investigar a magnitude das diferenças interindividuais em função da idade, gênero e categoria do peso ao nascer; e examinar a diferenciação das trajetórias médias das crianças com Baixo Peso ao Nascer e com Peso Adequado ao Nascer, relativamente às referências internacionais.
Métodos
A amostra foi composta por 534 crianças (279 meninos e 255 meninas, na faixa etária entre 7 e 10 anos de idade), avaliadas no primeiro ano de estudo e seguidas por três anos, com sobreposição de idade entre 7 e 9 anos. Foram medidas a estatura e a massa corporal, e estimados o percentual de gordura (%Gord) e a Massa Isenta de Gordura. As análises foram realizadas com a Modelagem Multinível.
Resultados
O peso ao nascer não apresentou associação com as variáveis de crescimento físico e composição corporal aos 7 anos de idade, bem como com seus incrementos dos 7 aos 10 anos (p>0,05). Há diferenças interindividuais significativas nas trajetórias de crescimento físico (estatura, massa corporal; p<0,001) e composição corporal (%Gord e Massa Isenta de Gordura; p<0,001). Na plotagem realizada em cartas percentílicas internacionais, independentemente do peso ao nascer, as trajetórias do crescimento e composição corporal encontram-se dentro dos valores esperados para idade e gênero.
Conclusão
O estudo concluiu que existem diferenças significativas no dinamismo do crescimento estatural, massa corporal e Massa Isenta de Gordura, e o Baixo Peso ao Nascer não exerce nenhuma influência nessa trajetória. Ademais, os seus valores estão dentro do expectável para idade e gênero.
Palavras-chave: Corpo adiposo. Massa Isenta de Gordura. Percentual de Gordura. Curva de crescimento. Análise Multinível.
I N T R O D U C T I O N
Human growth is a complex process [1] that can be demonstrated by the results from the mathematical modelling of the distance and velocity curves [2]. The complexity of this “anatomy in movement” is controlled by genetic factors [3], but it is also influenced by
environmental stimuli during the first years after birth [4,5]. In addition, the perinatal environment is considered a predictor of some changes observed in different stages of human growth and development [6,7].
account the important role of Birth Weight (BW) [8]. For example, a longitudinal study with Brazilian children reported that BW was negatively correlated with height and Fat Free Mass (FFM), but the same was not observed for fat mass; further, the weight gains at 6 months, 1 and 4 years old, were positively associated with height and body composition at 9 years old [9]. On the other hand, but with a longitudinal design, Rogers et al. [10] investigated the association between weight and length at birth with the body composition and the fat distribution in 9 to 10 years old children. It was found that BW was positively correlated with FFM and total body fat in both sexes [10]. It was also observed that for each standard deviation increment in BW, the FFM increased by 320-390g. Moreover, it has been reported that for this age range, a change in the response to an adverse situation for optimal growth (caused by either hormonal or factors) can lead to catch-up growth, making it possible to achieve the expected genetic potential [11].
The number of longitudinal studies for the association between Low Birth Weight (LBW) and the dynamic of physical growth and body composition during the children’s first school years (7-10 years old) is scarce. This can be due to the difficulties related to longitudinal research, such as changes in sample sizes across data collection and changes in covariates throughout children’s growth [7,9,12]. These aspects, in association with other factors related to logistical and financial conditions, can limit the number of longitudinal studies with school age children, specially in the Brazilian Northeast region.
In the present study, birth weight is considered an independent variable that can influence the velocity of changes in indicators of body composition. Thus, the purposes of the present study are: (1) to describe the dynamics of children’s physical growth and body composition (fat percentage and FFM) in children from
Vitória do Santo Antão, Brazilian Northeast; (2)
to investigate the magnitude of interindividual differences according to age, gender and BW categories across the years of the study; (3) to examine the differences in the trajectories of children with LBW and Normal Weight (NW) and to compare them with international references.
M E T H O D S
The data from the present study comes from the research project “Crescer com Saúde” (Growing with Health) conducted in Vitória de
Santo Antão, a municipality located in the State
of Pernambuco, in the Brazilian Northeast. During
the data collection period, the demographic density in the city was 341,7inh·km-2, and the infant mortality rate was about 67,18 per 1,000 live births [13]. There were 69 municipal school (44 in the rural area, and 25 in the urban area) with a total of 6,244 students (1,149 in the rural area and 5,095 in the urban area) aged 7 to 10 years [14].
Sample
For convenience, eight elementary public schools were selected, with physical/structural conditions to support the development of the study. The students were invited to take part in the study, with an authorization given by their parents or legal guardians. The decimal age of each child was determined at the data collection date, and the age groups were formed considering the age below 0.50 and above 0.49, that is, the intermediary age was considered as a whole year.
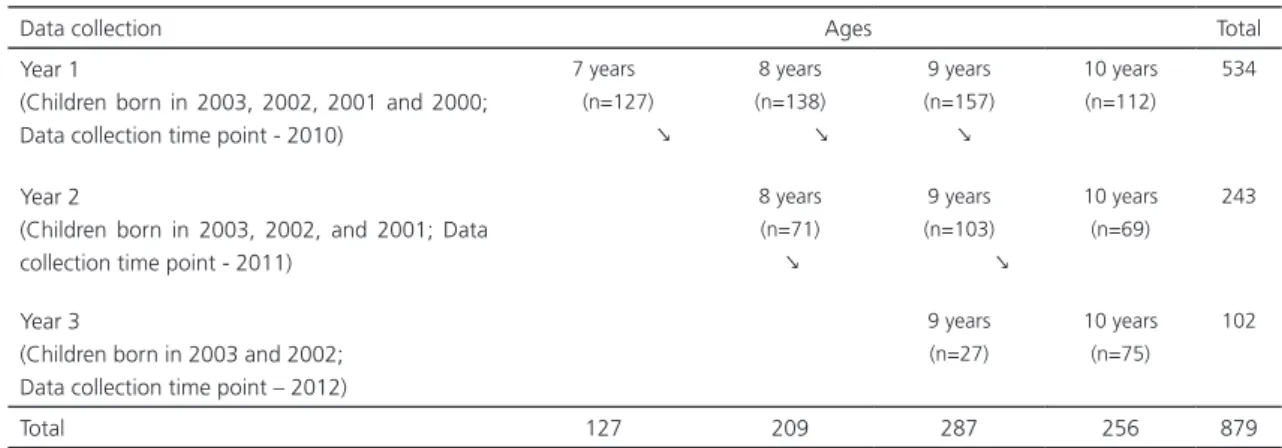
There was no inclusion of new subjects. Children aged 10.49 years at the first year of the study were not followed-up anymore, because some pubertal events could be already observed at this age. Furthermore, families moves to other cities and some subjects refusal to participated in the follow-up were expected in the study. Table 1 shows the longitudinal study design structure with ages’ overlapping 7 and 9 years. The consent form was signed by children’s parents or legal guardian. The study was approved by the Ethics Committee of the
Universidade Federal de Pernambuco (protocol
number: 0175.0.172.000-09).
Birth Weight
Information regarding birth weight was provided by children’s parents/legal guardian, and confirmed by Vitória de Santo Antão live
Table 1. Basic structure of research design sequentially, of children from Vitória de Santo Antão (PE), Brazil. 2010/2011/2012.
Data collection Ages Total
Year 1
(Children born in 2003, 2002, 2001 and 2000; Data collection time point - 2010)
7 years
(n=127) ↘
8 years
(n=138) ↘
9 years
(n=157) ↘
10 years
(n=112)
534
Year 2
(Children born in 2003, 2002, and 2001; Data collection time point - 2011)
8 years (n=71) ↘
9 years (n=103)
↘
10 years (n=69)
243
Year 3
(Children born in 2003 and 2002; Data collection time point – 2012)
9 years
(n=27)
10 years
(n=75)
102
Total 127 209 287 256 879
births database. Since it was not possible to obtain information related to the mother’s gestational age and health condition during pregnancy, it is possible that the sample included children born preterm. In the present study, the following birth weight cut points were used: LBW <2.500g and NBW >2.501g.
Anthropometry and Body Composition
Anthropometry variables were measured according to standardized procedures [15]. Body mass was measured using a scale with precision of 100g (Filizola, São Paulo, Brazil), while height was measured with a portable stadiometer with precision of 0.1cm (Sanny, São Paulo, Brazil). The body mass was divided in two components: fat mass (%FM) and FFM, previously described by Lohman & Going [16]. For this, the skinfolds (triceps and subscapular) were measured with a 0.5mm precision calliper (Lange, Santa Cruz, California). All anthropometric measurements were taken by previously trained researchers.
Data Quality Control
The data quality control was performed at the Physiology Lab from the Universidade
Federal de Pernambuco – Academic Center
of Vitória de Santo Antão, according to the
sample of children (about 10% of the subjects), during all data collection procedures; (2) computing the Technical Error of Measurement (TEM): TEM=0.41kg for body mass, 0.43cm for height, 0.52mm and 0.58mm for triceps and subscapular skinfolds, respectively.
Statistical Analysis
The dynamics of growth in height, body mass, %Fat, and FFM was analysed using multilevel modelling procedures [17]; the temporal metric was centered at age 7, given that it is the initial age of the subjects in the study, a procedure suggested by Hox [18], in studies with a longitudinal design. The multilevel analysis followed sequential steps. Firstly, we modelled the changes, i.e., the velocity (cm·year-1, kg·year-1 or %·year-1) in each of the four variables taking into account the available information from centile growth charts with the purpose of verifying if the trajectory of each variable, at the age range (i.e., from 7 to 10 years old), showed a linear or curvilinear trajectory, i.e., up to a second-degree polynomial (age2). The inclusion of age2 (interpreted as acceleration) did not statistically improve the quality of the model, and this variable was removed in the following models. Secondly, two predictors were added: gender (reference=girls) and BW (reference=LBW). Thirdly, two interactions were tested: age and gender (different mean trajectories for boys and girls), and age and BW (different effect of BW in growth trajectories). As it has been previously advocated [18], the sequential models were compared based on Deviance differences. Maximum likelihood estimation procedures, implemented in SuperMix v1 software, were used to estimate all models parameters simultaneously [17]. Hedeker et al. [17] have shown that multilevel model analysis can provide reliable results, even when data collection points equidistance and absence of subjects’ missing information alongside the study
assumptions have failed. Moreover, differences between ages within gender, between LBW and NBW, for each variable plotted in centile charts were analysed using the Student t-test for independent samples. The software SPSS 24.0 (Statistical Package for the Social Sciences, Chicago, Illinois, United States) was used and the significance level was set at 5%.
R E S U L T S
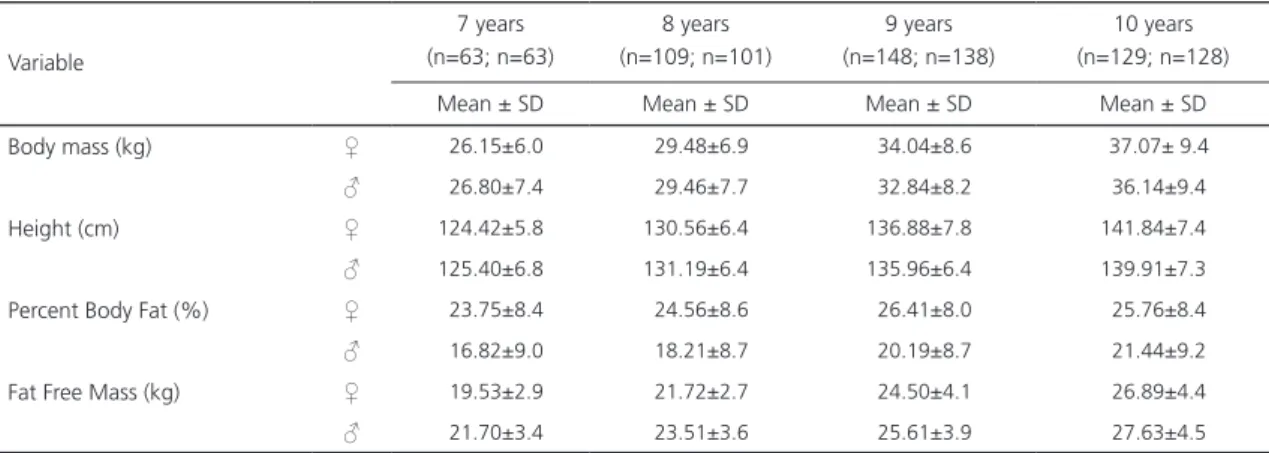
The LBW mean in boys was 2.070±0.39kg (21.5% of the cases) and the NBW mean=3,358±0.52kg (78.5%). In girls, the LBW mean was 2,123±0.31kg (15.3%) and the NBW mean=3,191±0.39kg (84.7%). Mean values, in all variables, increased with age, in both genders. Regarding body mass, between 8 and 9 years old, girls were heavier than boys. Regarding height, boys were taller than girls, but at the age of 10 years, girls become taller than boys. In relation to %BF, girls, at all ages, showed higher values than boys, while for FFM these values were high for boys when compared to girls (Table 2).
Table 2. Descriptive statistics for boys and girls, by age, of children from Vitória de Santo Antão (PE), Brazil. 2010/2011/2012.
Variable
7 years (n=63; n=63)
8 years (n=109; n=101)
9 years (n=148; n=138)
10 years (n=129; n=128) Mean ± SD Mean ± SD Mean ± SD Mean ± SD
Body mass (kg) ♀ 26.15±6.0 29.48±6.9 34.04±8.6 37.07± 9.4
♂ 26.80±7.4 29.46±7.7 32.84±8.2 36.14±9.4
Height (cm) ♀ 124.42±5.8 130.56±6.4 136.88±7.8 141.84±7.4
♂ 125.40±6.8 131.19±6.4 135.96±6.4 139.91±7.3
Percent Body Fat (%) ♀ 23.75±8.4 24.56±8.6 26.41±8.0 25.76±8.4
♂ 16.82±9.0 18.21±8.7 20.19±8.7 21.44±9.2
Fat Free Mass (kg) ♀ 19.53±2.9 21.72±2.7 24.50±4.1 26.89±4.4
♂ 21.70±3.4 23.51±3.6 25.61±3.9 27.63±4.5
Note: SD: Standard Deviation; ♀: Female; ♂: Male.
Table 3. Multilevel models for Height, Body Mass, Fat Mass, and Fat Free Mass, of children from Vitória de Santo Antão (PE), Brazil. 2010/2011/2012.
Variable Height (cm) Body Mass (kg) Percent Body Fat (%) Fat Free Mass (kg)
β±SE p-value β±SE p-value β±SE p-value β±SE p-value Fixed factors
7 years of age 124.89±0.91 <0.001 23.81±0.85 <0.001 21.67±1.19 <0.001 18.69±0.46 <0.001
Gender (Boys) 1.31±0.71 0.065 0.90±0.66 0.172 -5.79±0.92 <0.001 2.13±0.36 <0.001
Velocity 5.12±0.34 <0.001 4.39±0.37 <0.001 1.29±0.43 <0.002 2.65±0.21 <0.001
Interaction (Velocity*Gender) -1.02±0.27 <0.001 -0.74±0.28 <0.009 0.16±0.34 0.630 -0.42±0.16 <0.012
Birth Weight Category -0.09±0.91 <0.921 1.00±0.86 0.245 0.61±1.20 0.607 0.48±0.46 0.299
Interaction
(Velocity*Birth Weight Category)
0.51±0.36 0.153 -0.14±0.38 0.712 0.27±0.45 0.543 -0.10±0.22 0.636
Variance Components (s2)
7 years of age 37.47±3.85 <0.001 36.24±3.4 <0.001 71.50±6.66 <0.001 7.96±0.94 <0.001
Velocity 1.33±0.45 <0.003 3.32±0.53 <0.001 3.09±0.72 <0.002 0.90±0.19 <0.001
Covariance -0.01±1.03 0.988 3.04±0.97 <0.001 -3.82±1.76 <0.030 0.34±0.32 <0.291
Note: β: Unstandardized Coefficients; SE: Standard Error; kg: kilograms; cm: centimetres.
Birth weight were not significantly associated with mean height, body mass, %fat, or FFM at 7 years old. However, significant interindividual differences were observed (variance component, s2) at 7 years old and in the velocity of the gains of height (s2=37.47±3.85; p<0.001; s2=1.33±0.45; p<0.003), body mass (s2=36.24±3.41; p<0.001; s22=3.32±0.53; p<0.001), %fat (s2=71.50±6.66; p<0.001; s2=3.09±0.72; p<0.002) and FFM (s2=7.96±0.94; p<0.001; s2=0.90±0.19; p<0.001), respectively. However, there was a significant relationship
(covariance) between body mass (3.04±0.97; p<0.001) at 7 years old with the gains across the ages, and a significant negative correlation with %BF and the velocity changes (-3.82±1.76; p=0.030).
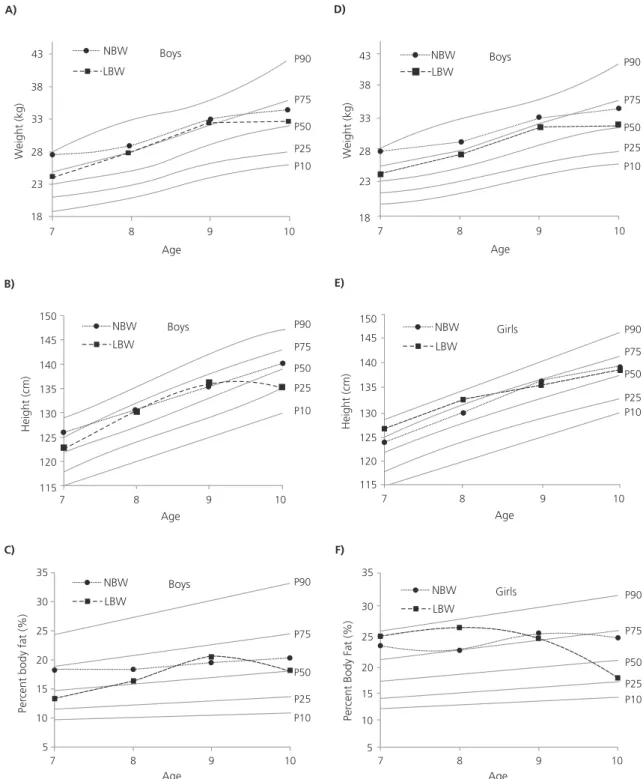
Figure 1. Plotting of Body Mass, Height, and Percent Body Fat against international reference charts, for boys (A, B e C) and girls (D, E e F) Low Birth Weight (LBW) and Normal Birth Weight (NBW) of children from Vitória de Santo Antão (PE), Brazil. 2010/2011/2012. 43 38 33 28 23 18 W eight (kg) NBW LBW Boys P90 P75 P50 P25 P10
7 8 9 10
Age A) 150 145 140 135 130 125 120 115 Height (cm) NBW LBW Boys
7 8 9 10
Age B) P90 P75 P50 P25 P10 NBW LBW Boys 35 30 25 15 10 5 20 Per
cent body fat (%)
P90 P75 P50 P25 P10 C)
7 8 9 10
Age NBW LBW Boys 43 38 18 D)
7 8 9 10
Age 33 28 23 P90 P75 P50 P25 P10 W eight (kg) NBW LBW Girls P90 P75 P50 P25 P10 9 10 150 145 140 135 130 125 120 115 Height (cm) E) 7 8 Age NBW LBW Girls P90 P75 P50 P25 P10 35 30 25 20 15 10 5
7 8 9 10
Age
F)
Per
cent Body Fat (%)
and the increment on these variables followed a linear trajectory, with few fluctuations across ages. The %fat shows a different trajectory, between boys and girls. In girls, LBW and NBW,
observed. However, from 9 to 10 years old, these values were slightly decreased in LBW boys. In girls, the statistically significant differences between LBW and NBW were observed only at 7 years old for body mass (p=0.036) and %fat (p=0.014).
D I S C U S S I O N
Notwithstanding the well-known fact that BW is related with changes during physical growth and body composition gains [8], our data did not show significant association between these variables in children aged 7 years, nor even with their velocity gains. On the other hand, other previous longitudinal studies, involving children, have demonstrated that there is a positive relationship between BW and weight gains during childhood, especially in FFM, %fat, and body fat distribution. In addition, these studies also suggest a positive relationship between BW and obesity in childhood and adolescence, but this relationship seems to ignore height gains [9,10,21,22]. Results reported for these studies seem to be discordant, maybe because of the time period used in the study design, the methodology, or the inclusion of different confounding variables. Wells et al. [9] showed that the association with BW was analysed at 6 months of age, 1, 4, and 9 years of age. Rogers et al. [10], considered the ages 9 and 10 years age as the interval of analysis. Further, the inclusion of different confounding variables (e.g. time of breastfeeding, maternal education, Body Mass Index, weight gain during pregnancy, familial income, maternal smoking during pregnancy, maternal age, and number of gestation) can contribute to differences observed in previous studies [23]. In the present study, children from public schools were followed-up throughout three years. It can be expected the implementation of strategies with the purpose to promote changes in diet and physical activity levels in these students. Moreover, the cumulative effect of these factors
can reduce the role of BW in growth trajectory during childhood, but it does not mean that growth cannot be affected by environmental factors in later ages.
The results from the multilevel analysis for body weight and height in boys and girls, show that their gains have occurred at different rates from 7 to 10 years of age. However, for height, there is no relationship between these values at 7 years of age and the growth velocity. On the other hand, for body weight, the relationship was significant, meaning that the greater weight at 7 years, the greater will be the weight gains with increasing age. These data suggest that human growth is not only sensitive to environmental stimuli during the first “critical window of development” (i.e. gestation, lactation and early infancy), but also during the later infancy, regardless of the physiological factors, as hormonal and neural influences [6].
The dynamic of changes observed in %fat means that there was no significant difference between boys and girls. However, boys showed slightly lower gains in FFM than girls. So, there is a high heterogeneity, especially regarding to body composition in children, that can possibly be explained by differences in infant growth rates. However, it can be considered an uncertain scenario, given that previous studies described the existence of positive, negative, or even absence of association with BW. This inconsistence in the results can be explained by the differences in methods and/or in statistical analysis procedures used, as well as the interval of time that sample was followed-up throughout the study [8]. Wells [6] showed that some LBW children have experienced the catch-up growth, that can lead to different responses in these issues by using different pathways. Ayyavoo et al. [24] reported differences related to gender in the effect of body composition, with high body fat and total adiposity, and low FFM in girls.
children when compared with the international references. It was observed that body mass and height values were according to international growth references [20]. When values were plotted in %fat centile charts, independently of BW category, both groups showed values according to international references, by age and gender [25]. When taking into account the age range and the methods used, LBW was not a predictor sufficiently relevant to change the velocity and trajectories of growth in children aged 7 to 10 years old. In this context, it is possible that LBW newborns present different adaptive mechanisms to extra uterine environment stimuli, which can lead to a fast growth recovery. The acceleration in growth trajectory is a physiological process related to recovery of size from the organism under restriction, that allows to achieve the ideal size for age, gender, and maturational status [11,26].
In the present study, the %fat was higher in girls than boys regardless of BW category. This can be explained by recent studies suggesting that the fast body weight during childhood have a significantly high risk for gains in %fat [6,8]. Nevertheless, it is not clear if the catch-up weight during childhood is due to a biological programming, since these gains are linear and any changes in body fat are theoretically reversible [6,27].
Regardless LBW not be associated with %fat and FFM, it was observed that girls (both LBW and NBW) were closed to P90, with a high increase at 9 years old, followed by a decline to P75; in boys, this growth pattern was according to expected values. At first analysis, it seemed that the existence of a catch-up in %fat occurred differently in boys and girls. However, it has been reported that after the nutritional recovery, there is an increase in the growth rate that can overlap the adequate weight gain leading to high fat deposition [11,6]. Although LBW children tend to adopt adaptive growth strategies, with the integration of various components related to the phenotypic sensitivity to environmental stimuli,
the actual environment seems to influence components of the body composition instead of BW per se [28]. Monteiro et al. [29] observed a reduction in the prevalence of malnutrition: from 13.5% (CI95%: 12.1%;14.8%) in 1996 to 6.8% (5.4%;8.3%) in 2006/7. Four factors were related to this reduction: 25.7% of improvement in maternal education; 21.7% of improvement in family income; 11.6% of improvement in health care and 4.3% of improvement in sanitation conditions. These factors corroborate the results found by Batista Filho & Batista [30] and Batista Filho & Rissin [31] on the nutritional transition experienced in Brazilian northeast, where it has been observed a reduction in the prevalence of malnutrition in children in association with an increase in the prevalence of overweight/obesity in adults. The deficits in height were reduced by 72.0% in urban children, and 54.4% in the rural area, while the prevalence of obesity was two or three times high in men and women [30,31].
This study has limitations. Firstly, the reduction of sample size across the follow up years, especially regarding the methodological design. However, the sample dropout is always an usual issue in longitudinal studies. Secondly, the lack of information regarding gestational period, breast feeding, and gains in height and weight during the first years of life (i.e., 1 and 2 years of age). Finally, the lack of data related to food consumption of the children, once these variables are suggested to be possible confounders and/or mediators variables in the relationship between BW and body weight gains during childhood.
C O N T R I B U T O R S
Each author contributed individually and significantly for the manuscript. CG LEANDRO and MAM SANTOS conceptualized the study design. MF VERÇOSA and MAM SANTOS performed the literature research. MAM SANTOS, MF VERÇOSA, and CG LEANDRO led the manuscript writing. TNQF GOMES and JAR MAIA performed the data statistical analysis and interpretation. MAM SANTOS, CV LEANDRO, and JAR MAIA conducted the manuscript critical review. All authors revised and approved the final version of the manuscript.
R E F E R E N C E S
1. Roche AF, Sun SS. Human growth: Assessment and interpretation. Cambridge: Cambridge University Press; 2005.
2. Molinari L, Gasser T. The human growth curve: Distance, velocity and acceleration. In: Methods in Human Growth Research (Cambridge Studies in Biological and Evolutionary Anthropology). London: Cambridge University Press; 2004. p.27-54. http://dx.doi.org/10.1017/ CBO9780511542411.003
3. Visscher PM. Sizing up human height variation. Nat Genet. 2008;40(5):489-90. http://dx.doi.org/10. 1038/ng0508-489
4. Wells JC, Stock JT. Re-examining heritability: Genetics, life history and plasticity. Trends Endocrinol Metab. 2011;22(10):421-8. http://dx.doi. org/10.1016/j.tem.2011.05.006
5. Grimm KJ, Ram N, Hamagami F. Nonlinear growth curves in developmental research. Child Dev. 2011;82(5):1357-71. http://dx.doi.org/10.1111/j. 1467-8624.2011.01630.x
6. Wells JC. Worldwide variability in growth and its association with health: Incorporating body composition, developmental plasticity, and intergenerational effects. Am J Hum Biol. 2017;29(2):e22954. http://dx.doi.org/10.1002/ajhb. 22954
7. Wells JC, Dumith SC, Ekelund U, Reichert FF, Menezes AM, Victora CG, et al. Associations of intrauterine and postnatal weight and length gains with adolescent body composition: Prospective birth cohort study from Brazil. J Adolesc Health. 2012;51(6):S58-64. http://dx.doi.org/10.1016/j.jado health.2012.08.013
8. Wells JC, Chomtho S, Fewtrell MS. Programming of body composition by early growth and nutrition.
Proc Nutr Soc. 2007;66(3):423-34. http//dx.doi. org/10.1017/S0029665107005691
9. Wells J, Hallal P, Wright A, Singhal A, Victora C. Fetal, infant and childhood growth: Relationships with body composition in Brazilian boys aged 9 years. Int J Obes. 2005;29(10):1192-8. http://dx.doi. org/10.1038/sj.ijo.0803054
10. Rogers IS, Ness AR, Steer CD, Wells JC, Emmett PM, Reilly JR, et al. Associations of size at birth and dual-energy X-ray absorptiometry measures of lean and fat mass at 9 to 10 y of age. Am J Clin Nutr. 2006;84(4):739-47.
11. Murray PG, Clayton PE. Endocrine control of growth. Am J Med Genet C Semin Med Genet. 2013;163(2):76-85. http://dx.doi.org/10.1002/ajmg. c.31357
12. Hoffman DJ. Growth retardation and metabolic programming: Implications and consequences for adult health and disease risk. J Pediatr. 2014;90(4):325-8.
13. Sistema Único de Saúde. Departamento de Infor-mática. Datasus publica edição revisada do PDTI 2016. Brasília: Ministério da Saúde; 2016 [acesso 2017 fev 20]. Disponível em: http://datasus.saude. gov.br/informacoes-de-saude/publicacoes/pdti/ 2016-pdti
14. Prefeitura de Vitória de Santo Antão. Secretaria da Educação. Educação. [acesso 2017 fev 20]. Disponível em: http://www.prefeituradavitoria.pe. gov.br/www3/secretaria-de-educacao/
15. Lohman TG. Applicability of body composition techniques and constants for children and youths. Exerc Sport Sci Rev. 1986;14:325-57.
16. Lohman TG, Going SB. Body composition assessment for development of an international growth standard for preadolescent and adolescent children. Food Nutr Bull. 2006;27(4Suppl5):S314-25. http://dx.doi. org/10.1177/15648265060274S512
17. Hedeker D, Gibbons R, Toit M, Cheng Y. Supermix: Mixed effects models. Philadelphia: Scientific Software International; 2008.
18. Hox JJ. Multilevel analysis: Techniques and applications. Oxford: Routledge; 2010.
19. Laurson KR, Eisenmann JC, Welk GJ. Body fat percentile curves for US children and adolescents. Am J Prev Med. 2011;41(4):S87-92. http://dx.doi. org/10.1016/j. amepre.2011.06.044
20. Kuczmarski RJ, Ogden CL, Grummer-Strawn LM, Flegal KM, Guo SS, Wei R, et al. CDC growth charts: United States. Adv Data. 2000;(314):1-27. 21. Walker SP, Gaskin PS, Powell CA, Bennett FI.
and fat distribution in mid and late childhood. Public Health Nutr. 2002;5(03):391-6. http://dx. doi.org/10.1079/PHN2001275
22. Okosun I, Liao Y, Rotimi C, Dever G, Cooper R. Impact of birth weight on ethnic variations in subcutaneous and central adiposity in American children aged 5-11 years: A study from the Third National Health and Nutrition Examination Survey. Int J Obes. 2000;24(4):479-84.
23. Rolfe EDL, Loos RJ, Druet C, Stolk RP, Ekelund U, Griffin SJ, et al. Association between birth weight and visceral fat in adults. Am J Clin Nutr. 2010;92(2):347-52.
24. Ayyavoo A, Derraik JG, Hofman PL, Biggs J, Cutfield WS. Metabolic, cardiovascular and anthropometric differences between prepubertal girls and boys. Clin Endocrinol. 2014;81(2):238-43. http://dx.doi.org/10.1111/cen.12436
25. McCarthy H, Cole T, Fry T, Jebb S, Prentice A. Body fat reference curves for children. Int J Obes. 2006;30(4):598-602. http://dx.doi.org/10.1038/sj. ijo.0803232
26. Ribeiro AM, Carvalho Lima M, Lira PIC, Silva GAP. Baixo peso ao nascer e obesidade: associação causal ou casual? Rev Paul Pediatr. 2015;33(3):340-8. http://dx.doi.org/10.1016/j.rpped.2014.09.007
27. Suchomlinov A, Tutkuviene J. The relationship between birth weight, adiposity rebound and overweight at the age of 17 years (results of the Lithuanian longitudinal growth study, 1990-2008). Anthropol Anz. 2014;71(4):329-46. http://dx.doi. org/10.1127/0003-5548/2014/0406
28. Wells JC. Maternal capital and the metabolic ghetto: An evolutionary perspective on the transgenerational basis of health inequalities. Am J Hum Biol. 2010;22(1):1-17. http://dx.doi.org/10. 1002/ajhb.20994
29. Monteiro CA, Benício MHDA, Konno SC, Silva ACF, Lima ALL, Conde WL. Causas do declínio da desnutrição infantil no Brasil, 1996-2007. Rev Saúde Pública. 2009;43(1):35-43.
30. Batista Filho M, Batista LV. Transição alimentar/ nutricional ou mutação antropológica? Ciênc Cult. 2010;62(4):26-30.
31. Batista Filho M, Rissin A. A transição nutricional no Brasil: tendências regionais e temporais. Cad Saúde Pública. 2003;19(Supl1):S181-91.