Sodium Chloride Crystallization by Electric Discharge in Brine
Jairo Breno Francisco de Oliveira Baraunaa*, Camila Senna Pereirab, Ingrid Azevedo Gonçalvesb,
Jussier de Oliveira Vitorianoc, Clodomiro Alves Juniord
Received: January 17, 2017; Revised: April 04, 2017; Accepted: June 03, 2017
Electrical discharges in liquids are currently used to synthesize nanoparticles. The plasma-liquid
interaction is complex, where parameters such as electric field, ion charges and other species present
are important. In order to understand the mechanism of crystallization, mother liquor (saturated solution of NaCl, MgCl2 and KCl) was used to study the effectiveness and selectivity of the crystallization caused by the application of plasma. Discharge was applied with the solution at room temperature or
during cooling. X-Ray Diffraction (XRD), Scanning Electron Microscopy (SEM) and chemical analysis was used to evaluate the structure and composition effects on crystal structure and composition. It
was observed that the discharge induces selectively crystallization, and when compared to crystals
obtained conventionally by cooling, were smaller and more uniform. We therefore confirm that plasma
in liquid can also be used to selectively crystallize materials in atmospheric pressure, where the sizes of the crystals must be dependent on the parameters used.
Keywords: Electric Discharge, plasma-liquid interaction, crystallization, sodium chloride, brine
* e-mail: jairobarauna@gmail.com
1. Introduction
Plasma-liquid interactions is a field that gained highlights in the last years. That is justified by the low cost, ease of
implementation and versatility1. Using this interactions, it
is possible, for example, the synthesis of nanoparticles2,
polymers3, surface disinfection4, and effluent treatment5.
This processes are driven by many mechanisms generated in the plasma-liquid interface: solvated electrons, gaseous ions impacting the surface of the liquid, reactive species,
UV radiation and strong electric fields6,7.
Crystallization from saturated solutions is driven by changes in the free energy8, and that is the reason why it is
sensible to processes involving electric discharges in liquids. In fact, some of the physical and chemical processes avaible in the plasma-liquid interface were already studied to induce or assist crystallization, as UV9, solvated electrons10 and
electric fields11,12.
The production of table salt from the solar evaporation of seawater discharges, generally at the ocean, a concentrated
saline effluent13. It happens mostly because there are not
viable alternatives to separate the sodium chloride from the other compounds in this brine, as magnesium chloride, potassium chloride, and sodium bromide14.
The residual volume of that evaporation, corresponds to nearly 20% of the original input and is rich in many ions
as Sodium, Potassium, Magnesium, Bromide, Chloride and Sulfate15. That complex composition means that when
a phase change is favorable, the crystallization will occur to the compound which is more sensible to the variations in the energy16.
To modify or control the compounds obtained by crystallization, it is needed to modify the conditions on which they are crystallized, and two of the main features of well controlled crystals are the size distribution and phases formed. To obtain better control on that variables, new alternatives are being proposed17.
Plasma-liquid interactions have potential to be useful in that area, since the electric discharge transfers charge as a solid electrode, but without any surface to adsorption7. It
means that is possible to produce compounds in the liquid surface just above the discharge, and they will not be adhered
to any solid surface as a film.
The most common use of this features in the scientific field is to produce nanoparticles, but it was also recently
discovered that a plasma irradiated culture medium could crystallize calcium oxalate18.
aCentro de Ciências Exatas e Naturais (CCEN), Universidade Federal Rural do Semi-Árido (UFERSA),
Mossoró, RN, Brasil
bCentro de Engenharias (CE), Universidade Federal Rural do Semi-Árido (UFERSA),
Mossoró, RN, Brasil
cPrograma de Pós-graduação em Engenharia Mecânica (PPGEM), Universidade Federal do
Rio Grande do Norte (UFRN), Natal, RN, Brasil
dCentro de Ciências Exatas e Naturais (CCEN), Universidade Federal Rural do Semi-Árido (UFERSA),
in the solar salt industry Salinor - Salinas do Nordeste Ltda, Areia Branca - RN. They were collected in the crystallization
tank, and stored in plastic bottles, under room temperature
(25º C). Two experiments were made to evaluate the effect of
the electric discharge in the crystallization. In the Experiment 1 (Fig. 1), a discharge was started between a 20 ml brine sample in a petri dish, and a simple stainless-steel electrode (any stainless-steel is suitable for that application, because there is not high temperatures, or corrosion problems, as it is used as cathode), with a thin tip of 2 mm and 5 mm away from the solution, for 5 minutes. It was evaluated if the discharge itself would be enough to induce a crystallization. The solution was weighted before and after the discharge
and the solids obtained were filtered using an 8 µm paper filter, and then dried in the drying oven (60º C).
To power the discharge, a pulsed current power supply (10 kV and 990 Hz) was used. The upper electrode was the cathode, and was in a glass tube, with its tip exposed, 5 mm away from the solution. The earth electrode was a copper plate, under the petri dish. No additional gas was used, so the discharge was conducted in the atmospheric gas. During both experiments, the temperature was monitored using an Infrared Thermometer Minipa MT-350. During the Experiment 1, an
Optical Spectrophotometer Ocean Optics USB4000 in the
beginning of the discharge and after 5 minutes. The solids
filtered were analyzed using a XRD Shimadzu model 6000, CuKα radiation. Sodium and potassium were determined using a Flame Spectrometer DM-62. Magnesium, chloride
and sulfate were determined by titrations. Images of the
crystals were taken using a Scanning Electron Microscopy (SEM). The size distribution of the crystals obtained in the
Experiment 2 were also analyzed using the software ImageJ.
3. Results and Discussion
3.1. Experiment 1
Immediately after the beginning of the discharge, it was observed that crystals start to form under the plasma, spreading across the liquid on the electrode’s surroundings, as
the time passes (Fig. 3). There was no significant temperature
increment, however, it was registered a mass loss of 1% after the 5-minute treatment.
That can be explained because the generated discharge can be assumed as a cold atmospheric discharge, where the electrons have high temperature but do not transfer that temperature to the heavier species19. On the other
hand, there is a mass reduction, that is not caused by the
conventional evaporation, since there is not a significant temperature rising. So, to explain that, it is proposed that a
nonequilibrium evaporation is happening, which was already visualized in the interaction between electric discharges and aqueous solutions20. It is caused mainly by the impact of ions
coming from the plasma, hitting the liquid surface driven Figure 1. Apparatus to start the discharge on the surface of the brine.
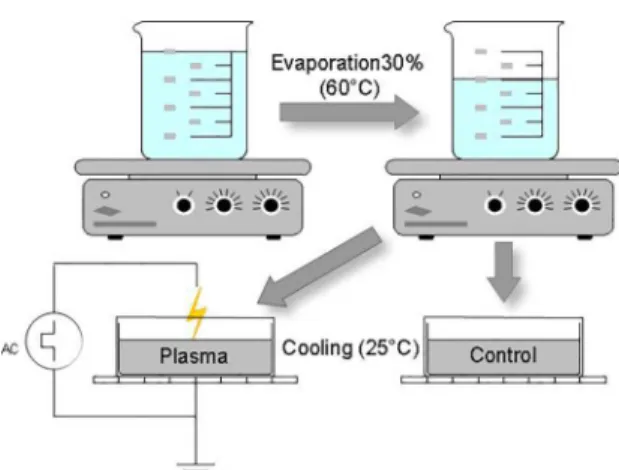
The experiment 2 (Fig. 2) was made using two beckers containing 200 ml of brine, that were heated to 60º C and evaporated 30% of its initial volume, to raise the concentration.
From each Becker, a sample of 20 ml was obtained, and both
were put to cool in identical petri dishes until they reached room temperature. In one of the samples a discharge was initiated in the same way as in the Experiment 1, during the
first 5 minutes of cooling, and the other one was used as control. Both samples were weighed every minute, and the
temperature was measured every 5 minutes until the end of the cooling, when they reached the room temperature
(25º C). So, it was possible to plot a graph with the mass loss
and temperature over time. The experiment 2 was used to compare the crystals obtained from a conventional cooling
method with the ones under the discharge effect.
by the electric field. That sputtering effect can eject atoms
and molecules from the liquid into the gaseous phase and can also be helped by the transport of water attached to ions
attracted by the electric field21. If those atoms and molecules
are being ejected from the solution, then some of them may be seem in the plasma-phase, as ionized or excited species.
So, an evidence-based approach was made by Optical Emission Spectroscopy, to verify what species were present
in the discharge zone. And indeed, it was possible to identify
Sodium (NaI at 589,59240 nm) and Chloride (ClI at 767,24 and 771,76 nm) emissions, clearly coming from the solution. In addition, it was possible to see reactive OH radicals (coming from water molecules, at 315 nm), nitrogen and oxygen species from the atmospheric gas (NII at 315.93 nm, NO I at 338,64 nm, NII at 359,36 nm, N I at 379,65; and O II at 376,24; 397,32 and 407,88 nm)22.
After 5 minutes of discharge, the second OES analysis
shows only sodium and chloride, which suppressed the other peaks. That means that the transport of elements from the solution to the gas phase is time-dependent, agreeing with earlier observations23,24 (Fig. 4).
To explain that difference on the scope of this work, it
can be assumed that while the discharge time passes and crystals are formed under the discharge, a compositional gradient with more sodium and chloride is established, by the migration of those ions to the discharge zone, by the action
of the electric field. Once they are ejected to the gaseous
phase, because they are bigger ions than the nitrogen and oxygen from the atmosphere25, they are more prone to impact
ionization, that causes the sodium and chloride intensities to be higher.
The chemical analyses (displayed on the pizza graphs), corresponds to the percentage of the element in the solids obtained, showing that there was a minor potassium impurity. However, the XRD analysis showed only peaks of NaCl (Fig. 5), that is acceptable because the percentage of potassium is very low. Also, the composition is correlated with the brine density, that indicates a saturation where the
sodium chloride is precipitating15. So the discharge instantly
formed the compound that was already saturated.
However, at the brine concentration, it would be expected the coprecipitation of magnesium sulfate with the sodium chloride14,26,27. That was not observed on experiment 1, which
is probably related to the low mobility of the magnesium and sulfate ions in comparison with the sodium, potassium and chloride ions28. The last ones, then, get faster to the
discharge site and are involved in the crystallization. Also,
the SEM images (Fig. 6) showed that cubic crystals were
obtained, which is in agreement with the pattern of sodium chloride crystals14.
3.2. Experiment 2
In the experiment 2, the sample that interacted with the discharge behaves like in the experiment 1, and crystals are readily formed at the point where the discharge is in contact with the liquid. The control sample crystallizes in a more dispersed layout (Fig. 7).
That difference is caused by the orientation promoted by the electric field, that makes possible to crystallize in a
Figure 3. Crystals forming under the electric discharge effect. Figure 4. Optic Emission Spectroscopy from the discharge zone, in the beginning of the discharge ad after 5 minutes.
specific point on the liquid surface. So, the electric discharge
crystallization allows the formation of crystals that are not
in contact with solid surfaces, and in a place with different
composition and energy.
Also, it has been noticed that the discharge did not
changed the cooling profile of the sample when compared
to the control, but again, there is a mass reduction related to the discharge (Fig. 8), and as proved in the experiment 1, it can be assumed as a nonequilibrium evaporation.
The XRD patterns were normalized for better comparison, and showed only sodium chloride peaks in both samples, but
with different intensities. It is possible to notice that, with
the discharge, the patterns were more coincident with the standard pattern of sodium chloride29. The control, on the
other hand, had two peaks which were much higher than the others (Fig. 9).
Those differences are due to the movement of the particles driven by the electric field, which also reduced the size of the
crystals, and facilitated the visualization of more crystalline
planes in the XRD. Actually, the SEM images proved that
assumption (Fig. 10).
Figure 6. Scanning electron microscopy of the crystals obtained in experiment 1.
Figure 7. Samples (Left: with discharge, Right: control) after 15 minutes of cooling.
Figure 8. Mass loss (bars) and temperature variation (lines) during experiment 2.
Figure 9. XRD Patterns and chemical composition, experiment 2.
Figure 10. SEM sample with the discharge interaction (left) and control (right).
The image analysis showed that the medium size of the biggest side of the crystals with the discharge is almost half of the ones in the control sample and with a size distribution
localized mostly between 10 and 30 µm (Fig. 11 and Table 1).
Figure 11. ImageJ analysis with crystal size distribution and quantity of crystals, (size in µm).
Table 1. Data from the image analysis (values in µm).
Sample Mean Standard Deviation Variance Min. Med. Max.
Plasma 26,1688 15,06065 226,82303 5,904 23,484 78,313
Control 47,25413 26,31713 692,59148 13,771 44,693 139,756
ionic mobility is higher than sodium and magnesium28. It is
not a significant part of the solids because there is relatively
less potassium at the solution than sodium. One more clue to indicate the dependence of the ionic mobility is that no
sulfate (a slow ion) was confirmed in the sample with the
discharge, while it appeared in the control sample.
4. Conclusion
Applying an electric discharge on the surface of a saturated brine can induce crystal formation. The solids obtained by this
technique are different from the ones obtained conventionally
by a cooling crystallization, in size and composition. Here we propose that those changes are driven by the orientation
and movement of ions and molecules under the electric field
and that there is the tendency to produce compounds that have faster ions in solution.
5. Acknowledgments
We thank CAPES and CNPq development agencies for financial support.
6. References
1. Chen Q, Li J, Li Y. A review of plasma-liquid interactions for nanomaterial synthesis. Journal of Physics D: Applied Physics. 2015;48(42):424005.
2. Lee SW, Liang D, Gao XPA, Sankaran RM. Direct Writing of Metal Nanoparticles by Localized Plasma Electrochemical Reduction of Metal Cations in Polymer Films. Advanced Functional Materials. 2011;21(11):2155-2161.
3. Senthilnathan J, Weng CC, Liao JD, Yoshimura M. Submerged Liquid Plasma for the Synthesis of Unconventional Nitrogen Polymers. Scientific Reports. 2013;3:2414.
4. Traylor MJ, Pavlovich MJ, Karim S, Hait P, Sakiyama Y, Clark DS, et al. Long-term antibacterial efficacy of air plasma-activated water. Journal of Physics D: Applied Physics. 2011;44(47):472001.
5. Magureanu M, Piroi D, Mandache NB, David V, Medvedovici A, Parvulescu VI. Degradation of pharmaceutical compound pentoxifylline in water by non-thermal plasma treatment. Water Research. 2010;44(11):3445-3453.
6. Mussard MDVS, Foucher E, Rousseau A. Charge and energy transferred from a plasma jet to liquid and dielectric surfaces.
Journal of Physics D: Applied Physics. 2015;48(42):424003.
3 Nanostructures from Solution. Nanoscale Research Letters. 2016;11:120.
12. Uda S, Koizumi H, Nozawa J, Fujiwara K. Crystal growth under external electric fields. In: International Conference of Computational Methods in Sciences and Engineering 2014 (ICCMSE 2014); 2014 Apr 4-7; Athens, Greece. AIP Conference
Proceedings. 2014;1618;1:261-264.
13. Ahmed M, Arakel A, Hoey D, Thumarukudy MR, Goosen MF a, Al-Haddabi M, et al. Feasibility of salt production from inland RO desalination plant reject brine: A case study. Desalination. 2003;158(1-3):109-117.
14. Jönsson JÅ, Barri T. Supported-Liquid Membrane Extraction. In: Wilson ID, ed. Encyclopedia of Separation Science. Cambridge: Academic Press; 2000.
15. McCaffrey MA, Lazar B, Holland HD. The evaporation path of seawater and the coprecipitation of Br- and K+ with halite.
Journal of Sedimentary Petrology. 1987;57(5):928-938.
16. Mortimer RG. Physical Chemistry. Cambridge: Academic Press; 2000.
17. Revalor E, Hammadi Z, Astier JP, Grossier R, Garcia E, Hoff C, et al. Usual and unusual crystallization from solution. Journal of Crystal Growth. 2010;312(7):939-946.
18. Kurake N, Tanaka H, Ishikawa K, Nakamura K, Kajiyama H, Kikkawa F, et al. Synthesis of calcium oxalate crystals in culture
to plasma diagnostics. Czechoslovak Journal of Physics. 2006;56(Suppl 2):B944-B951.
23. Maksimov AI, Khlyustova AV. Influence of the composition of electrolyte on the kinetics of its nonequilibrium evaporation at the initial steps. High Energy Chemistry. 2009;43(1):51.
24. Sirotkin NA, Khlyustova AV, Maksimov AI. Numerical simulation of the gas phase composition in a glow discharge with an electrolyte cathode. Surface Engineering and Applied Electrochemistry. 2014;50(4):323-329.
25. Silberberg M. Principles of General Chemistry. New York:
McGraw-Hill. 2009.
26. Warren JK. Evaporites: Sediments, Resources and Hydrocarbons. Berlin Heidelberg: Springer-Verlag; 2006.
27. Carpenter AB. Origin and Chemical Evolution of Brines in Sedimentary Basins. In: Society of Petroleum Engineers Annual Fall Technical Conference and Exhibition; 1978 Oct 1-3; Houston, TX, USA.
28. Barry PH, Lynch JW. Liquid junction potentials and small cell effects in patch-clamp analysis. The Journal of Membrane Biology. 1991;121(2):101-117.