Enhanced dietary formulation to mitigate winter thermal
1stress in gilthead seabream (Sparus aurata): a 2D-DIGE
2plasma proteome study
3Denise Schrama1, Nadège Richard1, Tomé S. Silva2, Filipe A. Figueiredo1,
4
Luís E.C. Conceição2, Richard Burchmore3, David Eckersall4, Pedro M.L.
5
Rodrigues1*.
6
1 CCMAR, Center of Marine Science, University of Algarve, Campus de Gambelas, 8005-139
7
Faro, Portugal. * Corresponding author: [email protected] 8
2 SPAROS, Lda, Área Empresarial de Marim, Lote C, 8700-221 Olhão, Portugal.
9
3 Institute of Infection, Immunity and Inflammation and Glasgow Polyomics, College of
10
Medical, Veterinary and Life Sciences, University of Glasgow, Glasgow, G12 8TA, UK. 11
4 Institute of Biodiversity Animal Health and Comparative Medicine, School of veterinary 12
medicine, University of Glasgow, Glasgow, G12 8TA, UK. 13 14 15 16
Abstract
17Low water temperatures during winter are common in farming of
18
gilthead seabream in the Mediterranean. This causes metabolic disorders that
19
in extreme cases can lead to a syndrome called “winter disease”. An
20
improved immunostimulatory nutritional status might mitigate the effects of
21
this thermal metabolic stress. A trial was set-up to assess the effects of two
22
different diets on gilthead seabream physiology and nutritional state, through
23
plasma proteome and metabolites. Four groups of 25 adult gilthead seabream
24
were reared during winter months, being fed either with a control diet (CTRL)
25
or with a diet called “winter feed” (WF). Proteome results show a slightly
26
higher number of proteins up-regulated in plasma of fish fed the WF. These
27
proteins are mostly involved in the immune system and cell protection
28
mechanisms. Lipid metabolism was also affected, as shown both by plasma
29
proteome and by the cholesterol plasma levels. Overall, the winter feed diet
30
Manuscript Click here to download Manuscript ManuscriptFishPhysiology
-2nd accepted.docx
Click here to view linked References
1 2 3 4 5 6 7 8 9 10 11 12 13 14 15 16 17 18 19 20 21 22 23 24 25 26 27 28 29 30 31 32 33 34 35 36 37 38 39 40 41 42 43 44 45 46 47 48 49 50 51 52 53 54 55 56 57 58 59 60
tested seems to have positive effects in terms of fish condition and nutritional
31
status, reducing the metabolic effects of thermal stress.
32
33
Keywords: Aquaculture, Gilthead seabream, Plasma, Winter disease, Winter
34
syndrome, Thermal stress, Proteomics.
35
1. Introduction
36Gilthead seabream (Sparus aurata) is one of the main species
37
produced in Southern Europe, with its production having doubled in the last
38
ten years up to 139.000 tons in 2010(FAO 2012). This species is a sparid
39
teleost that lives in the Mediterranean Sea and the east coast of the Atlantic
40
ocean, from the British isles to Cape Verde and rarely in the Black Sea(Sola
41
2005). Aquaculture of gilthead seabream has been improved by better
42
knowledge of the requirements for optimal growth, although it is vulnerable to
43
water temperature variations in the Mediterranean Sea(Ibarz et al. 2007).
44
Sparus aurata is sensitive to low water temperatures, which may lead to a
so-45
called “winter disease” or “winter syndrome”(Tort et al. 1998), that may lead in
46
some cases to high mortalities(Ibarz et al. 2007; Tort et al. 2004). The disease
47
has an average mortality of 7 to 10%(Sala-Rabanal et al. 2003) but some
48
cases have been reported where mortality may be as high as 80%(Tort et al.
49
1998). A critical temperature of 12 ºC is suggested, below which fish stop
50
feeding(Sala-Rabanal et al. 2003). Winter disease typically affects cultured
51
seabream in the Mediterranean, since European sea bass and meagre do not
52
seem to be affected in the same conditions(Ibarz et al. 2010b). In the wild,
53
when surface water temperatures decrease in winter, gilthead seabream
54 1 2 3 4 5 6 7 8 9 10 11 12 13 14 15 16 17 18 19 20 21 22 23 24 25 26 27 28 29 30 31 32 33 34 35 36 37 38 39 40 41 42 43 44 45 46 47 48 49 50 51 52 53 54 55 56 57 58 59 60 61
seems to migrate to deeper warmer waters(Davis 1988). In winter farming
55
conditions several physiologic, metabolic and immune disorders that affect
56
gilthead seabream have been described(Ibarz et al. 2010b). These include
57
an ionic imbalance caused by malfunctions of the gills and digestive system,
58
altered blood composition and liver metabolism, often leading to fatty liver and
59
steatosis, and an immune suppression that render fish more susceptible to
60
infection. These seem to arise mainly from reduced feed intake and even
61
periods of fasting, but also from reductions in the capacity to digest and
62
absorb nutrients induced by cold stress(Ibarz et al. 2010b).
63
In gilthead seabream, Bavčević et al.(Bavcevic et al. 2006) studied
64
different diets during winter-spring period, demonstrating that more lipids in
65
the diet enhance growth during periods of cold temperature. Tort et al.(Tort et
66
al. 2004) observed an improved seabream immune status when cold exposed
67
fish were fed a diet with a high palatability, a high nutrient density, high in
68
digestible proteins and lipids, rich in highly unsaturated fatty acids and
69
phospholipids, and supplemented in vitamin C, vitamin E, choline, inositol,
70
and minerals. These studies support the idea that the administration of
71
specific diets at different temperature periods might help mitigate the effect of
72
a thermal challenge on fish health and nutritional status, helping to prevent
73
the winter disease outbreaks.
74
In order to improve, during winter months, the nutritional and metabolic
75
status of Sparus aurata we formulated a fortified diet (called “winter feed” or
76
WF), as reference for a high-quality feed. This diet contains a higher amount
77
of marine-derived ingredients, marine phospholipids, taurine, soy lecithin,
78
antioxidant vitamins and is supplemented with phagostimulants. It was
79 1 2 3 4 5 6 7 8 9 10 11 12 13 14 15 16 17 18 19 20 21 22 23 24 25 26 27 28 29 30 31 32 33 34 35 36 37 38 39 40 41 42 43 44 45 46 47 48 49 50 51 52 53 54 55 56 57 58 59 60
compared to a standard commercial formulation (called control diet or CTRL)
80
containing low levels of fishmeal and whose fish oil was partially replaced by
81
rapeseed oil. At the end of winter, we assessed the effects of these diets on
82
the plasma proteome of the fish as well as on the concentration in metabolites
83
involved in various metabolic pathways (individual amino acids, cholesterol,
84
triacylglycerides) and metabolites involved in primary (cortisol) and secondary
85
(lactate and glucose) stress response. In a companion study, Silva et al.(Silva
86
et al. 2014) showed a positive effect of the WF diet in terms of nutritional and
87
metabolic status, showing higher liver weights and hepatosomatic index
88
associated with a hepatic accumulation of carbohydrates.
89
The present study aimed to verify to what extent the effects of winter thermal
90
stress can be mitigated by improved nutrition, using plasma proteome and
91
metabolome as proxies. Proteomics has been successfully applied in
92
aquaculture and reported in several recent studies (Alves et al. 2010;
93
Rodrigues et al. 2012; Silva et al. 2011; Silva et al. 2012a; Silva et al. 2012b).
94
We choose to analyze plasma proteome which has previously been done
95
(Piras et al. 2014) in order to improve knowledge of very early pathologic
96
mechanisms and to support the scarce and complex diagnostic procedures
97
currently available.
98
99
100
2. Material and methods
101102
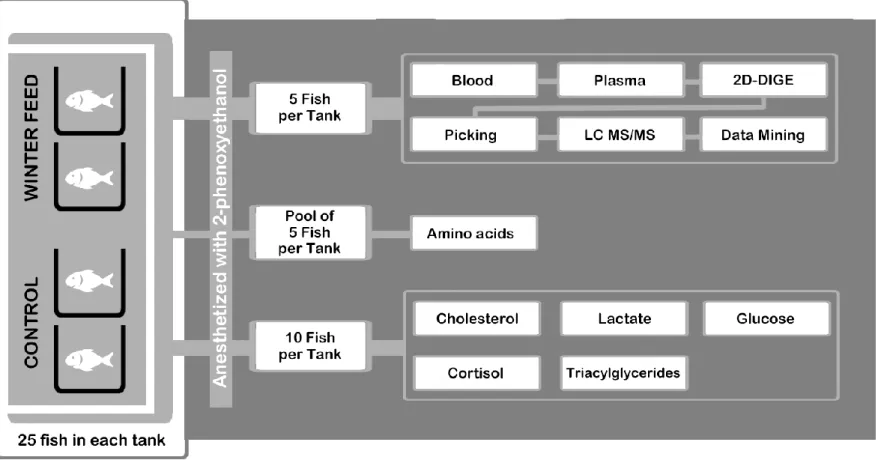
In Figure 1 a schematics representing the experimental design and
103 assays is presented. 104 1 2 3 4 5 6 7 8 9 10 11 12 13 14 15 16 17 18 19 20 21 22 23 24 25 26 27 28 29 30 31 32 33 34 35 36 37 38 39 40 41 42 43 44 45 46 47 48 49 50 51 52 53 54 55 56 57 58 59 60 61
105
2.1 Experimental diets 106
Formulations of the diets used in this trial are represented in Table 1. A
107
control diet (CTRL) was formulated with low fishmeal levels (15%), a
108
significant amount of plant-protein sources and a blend of fish and rapeseed
109
oils. An inorganic phosphorus source (di-calcium phosphate) and L-lysine (a
110
crystalline essential amino acid) were supplemented to cover the nutritional
111
requirements of the species. This control diet contained 48.3% crude protein,
112
19.6% crude fat and 22.8 MJ/kg gross energy. Comparatively, the
113
experimental winter feed (WF) had a much higher proportion of
marine-114
derived protein sources (45.8%), lower level of plant-proteins and the totality
115
of the oil fraction associated to fish oil and krill phospholipids. As a
116
phagostimulant and to facilitate fat emulsification during digestion, betaine
117
and soy lecithin were supplemented respectively. To this diet, antioxidants like
118
vitamin C, E and the non-essential amino acid taurine were added, knowing
119
that taurine is also involved in bile acid conjugation. The WF diet contained
120
50.6% crude protein, 19.7% crude fat and 22.4 kJ/g gross energy.
121
Based on previous studies(Dias et al. 2009; Tibaldi et al. 2006) on
122
digestibility of the ingredients used in the present study, it is easy to predict
123
that the winter feed would have a higher digestibility for protein and fat (not
124
measured in the present study). Moreover, the winter feed had a high quality
125
fish meal, the generally accepted golden standard for fish feeds for
126
carnivorous fish such as gilthead seabream, as a main ingredient, and within
127
normal values for high quality fish feeds. Therefore, the WF is clearly a
128
superior diet compared to the control formulation.
129 1 2 3 4 5 6 7 8 9 10 11 12 13 14 15 16 17 18 19 20 21 22 23 24 25 26 27 28 29 30 31 32 33 34 35 36 37 38 39 40 41 42 43 44 45 46 47 48 49 50 51 52 53 54 55 56 57 58 59 60
Main ingredients were ground (below 250 micron) in a micropulverizer
130
hammer mill (Hosokawa Micron, SH1, The Netherlands). Powder ingredients
131
and oil sources were then mixed accordingly to the target formulation in a
132
paddle mixer (Mainca RM90, Spain). Diets were manufactured by
133
temperature controlled-extrusion (pellet size: 5.0 mm) by means of a low
134
shear extruder (Italplast P55, Italy). Upon extrusion, all feed batches were
135
dried in a convection oven (OP 750-UF, LTE Scientifics, United Kingdom) for
136
2 hours at 60ºC. Throughout the duration of the trial, experimental feeds were
137
stored at room temperature, but in a cool and aerated environment. Samples
138
of each diet were taken for analysis of proximate composition (Table 1).
139
2.2 Fish and rearing conditions 140
For this trial, four groups of 25 gilthead seabream were reared for 4
141
months (between November 2011 and March of the following year) in 1000 L
142
circular plastic tanks, with natural flow-through seawater, at the Ramalhete
143
experimental station of the University of Algarve, Faro, Portugal. Duplicates
144
were used for each diet. Fish, with a mean initial body weight of 87 ± 5 g,
145
were fed once a day by hand, ad libitum and kept with natural temperature
146
(14.8 ± 2.1 ºC, with minimum and maximum values of 7.6 and 19.5 ºC,
147
respectively) and artificial aeration (dissolved oxygen above 5 mg.L-1), salinity
148
(33 ± 2 ‰) and a rearing density of about 2.18 kg m-3. Tanks were exposed to
149
natural environmental and natural photoperiod conditions.
150
2.3 Sampling 151
When temperatures reached more than 15 ºC for over a week, winter
152
period was considered over, and sampling occurred (116 days of trial). Five
153
fish randomly selected from each tank were anesthetized with 200 ppm of
2-154 1 2 3 4 5 6 7 8 9 10 11 12 13 14 15 16 17 18 19 20 21 22 23 24 25 26 27 28 29 30 31 32 33 34 35 36 37 38 39 40 41 42 43 44 45 46 47 48 49 50 51 52 53 54 55 56 57 58 59 60 61
phenoxyethanol (Sigma Aldrich, St. Louis, Missouri, USA), weighted and
155
approximately 1 ml of blood was withdrawn using syringes rinsed with 1%
156
EDTA solution. Blood was centrifuged at 2000 ×g for 20 minutes and plasma
157
was collected and kept at -80 ºC for subsequent analysis. Fish were killed
158
with a subsequent dose (1000 ppm) of 2-phenoxyethanol, measured and liver
159
weight was taken for calculation of the hepatosomatic index (HSI). Prior to
160
sampling, fish were starved for 48 hours, in order to guarantee that changes
161
in proteome and metabolome are not just the result of postprandial
162
metabolism; i.e., the objective was to measure effects in a post-absorptive
163
metabolism (steady-state). The experiment described was conducted in
164
accordance with the Guidelines of the European Union Council (Directive
165
2010/63/EU) and the Portuguese legislation for the use of laboratory animals,
166
and under a “Group-1” license (permit number
0420/000/000-n.99-167
09/11/2009) from the Veterinary Medicine Directorate, the competent
168
Portuguese authority for the protection of animals, Ministry of Agriculture,
169
Rural Development and Fisheries, Portugal.
170
2.4 Protein labeling for DIGE (Difference gel electrophoresis) 171
Prior to protein separation, a quantification of the protein in plasma
172
from each of five fish per tank (i.e. 10 fish per dietary treatment) was
173
performed using the Bradford assay (Bio-Rad) and bovine serum albumin as
174
standard. Samples were adjusted to pH 8.5 with 0.1 M NaOH and 50 µg of
175
proteins were minimally labeled with 400 pmol of fluorescent amine reactive
176
cyanine dyes freshly dissolved in anhydrous dimethylformamide (Alfa aesar,
177
Ward Hill, Massachusetts, USA) following manufacturer’s instructions (5 nmol
178
labeling kit, GE Healthcare, Uppsala, Sweden). Labeling was performed on
179 1 2 3 4 5 6 7 8 9 10 11 12 13 14 15 16 17 18 19 20 21 22 23 24 25 26 27 28 29 30 31 32 33 34 35 36 37 38 39 40 41 42 43 44 45 46 47 48 49 50 51 52 53 54 55 56 57 58 59 60
ice for 30 minutes in the dark and quenched with 1 mM of lysine for 10 min.
180
Five samples per dietary treatment were labeled with Cy3 and five with Cy5 to
181
reduce impact of label differences, while an internal standard consisting of
182
equal amounts of protein from all samples was labeled with Cy2.
183
2.5 Protein separation by 2D gel electrophoresis 184
Labeled proteins from each dietary treatment, plus 50 µg of internal
185
standard were mixed together and rehydration buffer (6 M urea, 2 M thiourea,
186
4% CHAPS, 0.2 % (w/v) DTT, 0.002% bromophenol blue, 0.5% (v/v) IPG
187
buffer pH 4-7, GE Healthcare, Uppsala, Sweden) was added to complete 450
188
µl. Rehydration was performed actively for 12 hours at 30 V using Ettan
189
IPGphor at 20 ºC (GE Healthcare, Uppsala, Sweden) on 24 cm Immobiline™
190
DryStrips (GE Healthcare, Uppsala, Sweden) with linear pH 4-7, followed by
191
isoelectric focusing (IEF) in 4 steps: 600 V gradient 2 hrs, 1000 V gradient 2
192
hrs, 8000 V gradient 2 hrs, and 8000 V step-n-hold for a total of 80.000 Vhr.
193
Before second dimension, strips were reduced and alkylated using 10 ml of
194
an equilibration buffer (1.5 M Tris-HCl pH 8.8, 6 M urea, 30% (v/v) glycerol,
195
0.007 M SDS, a few grains of bromophenol blue) with 1% (w/v) DTT or 2.5%
196
(w/v) iodoacetamide respectively for 15 min each. Strips were loaded onto
197
12.5% Tris-HCl SDS-PAGE gels and run overnight in an Ettan DALTtwelve
198
Large Vertical System (GE Healthcare, Uppsala, Sweden) at 1 W/gel using a
199
standard Tris-Glycine-SDS running buffer, until the bromophenol blue line
200
reaches the end of the gel.
201
2.6 Gel image acquisition, analysis and statistics 202 1 2 3 4 5 6 7 8 9 10 11 12 13 14 15 16 17 18 19 20 21 22 23 24 25 26 27 28 29 30 31 32 33 34 35 36 37 38 39 40 41 42 43 44 45 46 47 48 49 50 51 52 53 54 55 56 57 58 59 60 61
Gels were scanned on a Typhoon scanner 9400 (GE Healthcare,
203
Uppsala, Sweden) using three laser emission filters (526SP for Cy2, 580BP30
204
for Cy3 and 670BP30 for Cy5) at 100 µm resolution. Images were analyzed
205
using the DeCyder 2D software version 7.0 (GE Healthcare, Uppsala,
206
Sweden), which performs detection, quantitation, matching and analysis.
207
Statistical significance was assessed using Student’s t-test (p<0.05) and
208
average fold-ratio (ratio>1.0). Spots displaying a statistically significant
209
difference between groups were manually excised from preparative gels
210
stained with colloidal Coomassie blue. For PCA (principal component
211
analysis) representation, the software R v3.0.1 was used with mean-centered
212
and autoscaled data and, for a heat map, PermutMatrix was used as
213
described by Caraux and Pinloche in 2005 (Caraux and Pinloche 2005).
214
2.7 Protein identification by MS analysis of peptides and Database 215
search 216
Protein spots were digested overnight with trypsin and the resulting
217
peptides extracted with 2% acetonitrile and 0.1% trifluoroacetic acid. Tryptic
218
peptides were separated on a Pepmap C18 reverse phase column (0.075 x
219
150 mm, LC Packings), using an Ultimate+ LC system (Famos / Swithcos /
220
Ultimate, LC Packings, Thermo Scientific, Whaltham, Massachusetts, USA)
221
with online analysis by electrospray ionization (ESI, Thermo Scientific,
222
Whaltham, Massachusetts, USA) mass spectrometry on a LTQ Velos Orbitrap
223
(Thermo Scientific, Whaltham, Massachusetts, USA). Peptide mixtures were
224
eluted by a 5 – 85% v/v acetonitrile gradient (in 0.5% v/v formic acid) run over
225
45 min at a flow rate of 0.2 µl / min. The resulting MS/MS data were used as
226
input to MASCOT MS/MS Ion search (Matrix Science,
227 1 2 3 4 5 6 7 8 9 10 11 12 13 14 15 16 17 18 19 20 21 22 23 24 25 26 27 28 29 30 31 32 33 34 35 36 37 38 39 40 41 42 43 44 45 46 47 48 49 50 51 52 53 54 55 56 57 58 59 60
http://www.matrixscience.com), on the Actinopterygii (ray-finned fish) subset
228
of the NCBInr database (August, 2016). Due to limitations of this specific
229
subset we were not able to identify all spots, as the genome of gilthead
230
seabream isn’t fully sequenced yet. These searches were performed
231
assuming the formation of single-charged peptides, carbamidomethylation of
232
cysteine residues, possible oxidation of methionine residues and up to 1
233
missed cleavage. Mass tolerance was 10 ppm for MS data and 0.5 Da for
234
MS/MS data.
235
2.8 Plasma metabolites and cortisol 236
Plasma free amino acids concentrations were determined on two pools
237
of plasma (one per tank) from five fish per dietary treatment (analyses
238
performed in duplicates). Plasma samples were pre-column derivatised with
239
Waters AccQ Fluor Reagent (6-aminoquinolyl-N-hydroxysuccinimidyl
240
carbamate) using the AccQ Tag method (Waters Corporation, Milford,
241
Massachusetts, USA). Analyses were done by ultra-high-performance liquid
242
chromatography (UPLC) in a Waters reversed-Phase Amino Acid Analysis
243
System, using norvaline as internal standard. The resultant peaks were
244
analyzed with EMPOWER software (Waters Corporation, Milford,
245
Massachusetts, USA). Concentrations of cholesterol, glucose, lactate,
246
triacylglycerides and cortisol were individually determined in plasma of ten
247
gilthead seabream per tank (measurements performed in duplicates and read
248
in a microplate reader (synergy HT Model SIAFRTD, Biotek Instruments,
249
Vermont, USA), using commercial kits (Cholesterol CHO-POD, Glucose-HK,
250
Lactate LO-POD, triglycerides GPO-POD from Spinreact, Girona, Spain and
251
Cortisol saliva ELISA from IBL International, Hamburg, Germany,
252 1 2 3 4 5 6 7 8 9 10 11 12 13 14 15 16 17 18 19 20 21 22 23 24 25 26 27 28 29 30 31 32 33 34 35 36 37 38 39 40 41 42 43 44 45 46 47 48 49 50 51 52 53 54 55 56 57 58 59 60 61
respectively). Cortisol saliva ELISA kit from IBL was previously validated for
253
Sparus aurata(Lopez-Olmeda et al. 2009).
254
2.9 Statistical analysis 255
Results are given as mean ± standard deviation. All data were checked for
256
normality and homoscedasticity of variance. Significant differences of
257
zootechnical parameters and plasma metabolite concentrations were
258
assessed by Student’s t-test, using the p-value threshold of 0.05. Statistical
259
analysis was performed using the R v3.0.1 software environment.
260
3. Results
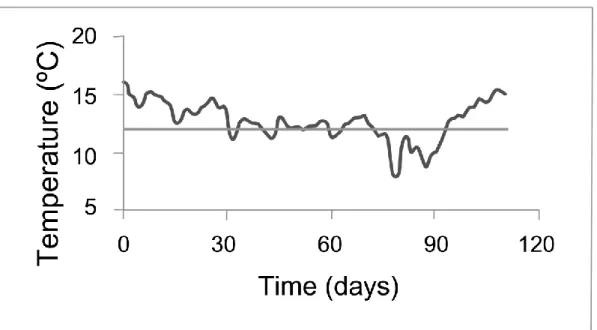
261Water temperature was monitored during the winter period (between
262
18-11-2011 until 7-3-1012) reaching values as low as 7.7 ºC in February, as
263
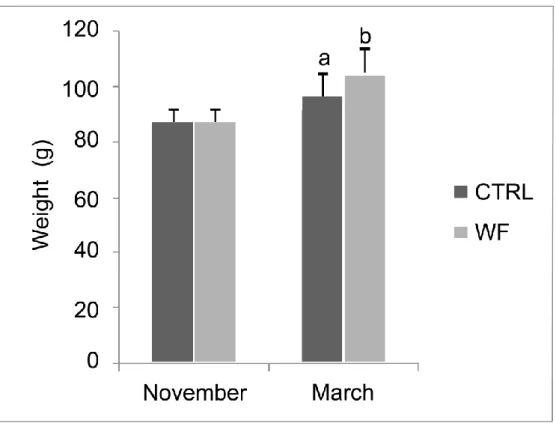
shown in Figure 2. At the end of the winter period, seabream weight differed
264
significantly between diets (Figure 3). No mortality was observed during this
265
trial period.
266
Zootechnical results (see more details in Silva et al(Silva et al. 2014))
267
show a non-significant tendency for better relative growth and feed conversion
268
rates, for fish fed the fortified diet. Significant (Student’s t-test, P=8.4 x 10⁻¹⁰)
269
higher hepatosomatic index was observed in fish fed the winter feed.
270
In terms of protein expression, DIGE analysis revealed an impact of the
271
winter feed diet on plasma proteome with 92 protein spots significantly
272
different (p<0.05) in abundance, out of a total of 2282 protein spots analyzed
273
(due to technical reasons 1 gel was not considered in the analysis). We were
274
able to identify 50 of these proteins by mass spectrometry, but only 18 are
275 1 2 3 4 5 6 7 8 9 10 11 12 13 14 15 16 17 18 19 20 21 22 23 24 25 26 27 28 29 30 31 32 33 34 35 36 37 38 39 40 41 42 43 44 45 46 47 48 49 50 51 52 53 54 55 56 57 58 59 60
shown as a consequence of repeated identifications of the same protein due
276
to degradation, agglomerates, isoforms, etc. (Figure 4). Eight proteins were
277
found to be down regulated and 10 up regulated in fish fed with the winter
278
feed. Protein identifications are shown in table 2. Abundance estimations of
279
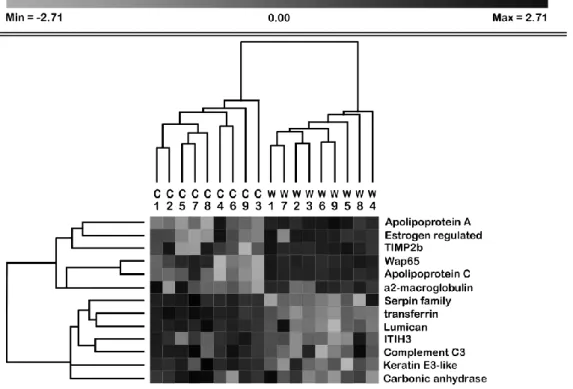
proteins can be seen in the expression pattern showed as a heat map in
280
Figure 5.
281
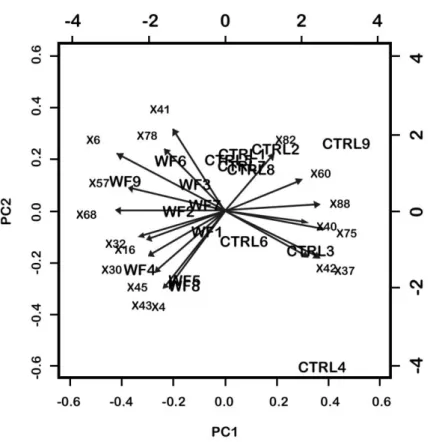
A principal component analysis (PCA) of protein spots expression data
282
(only sequenced spots are shown) revealed a clear separation of samples into
283
two clusters according to the type of diet administered (Figure 6). This clearly
284
shows two different plasma protein profiles of gilthead seabream fed with a
285
control and a winter feed diet. This is also evidenced in Figure 5 by the heat
286
map generated from the relative abundance of the previously identified protein
287
spots, in which there is a clear grouping in two clusters, over or under
288
expressed in WF compared to CTRL. A simplified metabolism of three
289
identified proteins, transferrin, apolipoprotein A-I and alpha-2-macroglobulin is
290
shown in Figure 7.
291 292
Plasma free amino acid concentrations assessed at the end of winter in
293
fish fed the two diets are presented in Table 3. Arginine, histidine, lysine,
294
tryptophan, tyrosine, glycine, asparagine, serine and gamma-aminobutyric
295
acid concentrations decreased significantly with WF diet.
296 297
The plasma lactate, triacylglycerides (TAG), glucose, cholesterol and
298
cortisol concentration in gilthead seabream fed different experimental diets
299
are shown in Figure 8. Fish fed the winter feed show a tendency for a higher
300
concentration of plasma glucose, cortisol and lactate although not significantly
301 1 2 3 4 5 6 7 8 9 10 11 12 13 14 15 16 17 18 19 20 21 22 23 24 25 26 27 28 29 30 31 32 33 34 35 36 37 38 39 40 41 42 43 44 45 46 47 48 49 50 51 52 53 54 55 56 57 58 59 60 61
different (Student’s t-test, values in graphics). There is a significantly higher
302
concentration of plasma cholesterol (Student’s t-test, P=0.044) in fish fed the
303
winter feed, while triacylglycerides concentration is significantly (Student’s
t-304
test, P=0.024) lower in the same group.
305
After 116 days of trial, some altered livers showing possible first signs of
306
winter disease were noticed, and this appeared to occur more frequently in
307
control than in winter feed fish.
308 309
4. Discussion
310 311 312 4.1 Comparative proteomics 313 314 4.1.1 Lipid metabolism 315Lipids have important roles in growth and fish health. An effect of WF
316
on lipid metabolism has been identified by the way of up-regulation of
317
apolipoproteins. High density lipoproteins (HDL) are the most abundant
318
plasma lipoproteins in teleosts, and its principal constituent, apolipoprotein A-I
319
(ApoA-I, spots 4 and 45), was shown to have antimicrobial activity in carp at
320
submicromolar concentrations against P. citreus and at micromolar
321
concentrations against Pseudomonas sp. and Yersinia ruckeri(Concha et al.
322
2003; Concha et al. 2004). Concha et al. (2003) demonstrated the presence
323
of ApoA-I in fish skin, which stands for the first barrier against
324
infections(Concha et al. 2003). Apolipoprotein C-I (spot 68), a constituent of
325
HDL, controls plasma lipid metabolism and promotes cell growth(Nynca et al.
326
2010). Given the higher levels of ApoA-I observed in WF-fed fish, it seems the
327
winter diet contributes towards an improved fish health status, compared to
328 the CTRL diet. 329 1 2 3 4 5 6 7 8 9 10 11 12 13 14 15 16 17 18 19 20 21 22 23 24 25 26 27 28 29 30 31 32 33 34 35 36 37 38 39 40 41 42 43 44 45 46 47 48 49 50 51 52 53 54 55 56 57 58 59 60
330
4.1.2 Stress & immune response 331
The physiology and behavior of fish is affected by water temperature. A
332
warm temperature acclimation-related 65 kDa protein (wap65, spot 6) was
333
identified. An increase in the expression of this protein was observed as a
334
response to stress, being up-regulated in fish fed the winter feed. Wap65
335
might be involved in the immune system as Kikuchi and colleagues
336
demonstrated when exposing goldfish to lipopolysaccharide, showing a
two-337
fold induction of wap65(Kikuchi et al. 1997).
338
An estrogen-regulated protein, also known as heat shock protein 27
339
(hsp27) (spot 43), was induced by the winter feed diet. Diverse functional
340
roles have been proposed to hsp27. This protein plays a role against disease,
341
injuries and homeostasis(Mao et al. 2005). Heat shock proteins (hsps) are
up-342
regulated when a sudden temperature change occurs as protein stability is
343
affected. In this trial the low temperatures may have destabilized hydrophobic
344
interactions, and hsps act as chaperones to repair eventual damage caused
345
by this destabilization(Feidantsis et al. 2013; Mao et al. 2005; Marvin et al.
346
2008). An up-regulation of hsps in gilthead seabream from February until
347
May, has been previously reported(Feidantsis et al. 2013). This protein also
348
regulates actin filament dynamics with its exact role depending on the
349
phosphorylation state(Liang and MacRae 1997; Mounier and Arrigo 2002). As
350
reported in our previous paper(Silva et al. 2014) fish fed the WF diet displayed
351
higher relative growth rates. In order to cope with this, a proper regulation of
352
actin dynamics in muscle is critical for assembly and maintenance of
353
functional myofibrils, which might result in a higher expression level of hsp27
354 in this group. 355 1 2 3 4 5 6 7 8 9 10 11 12 13 14 15 16 17 18 19 20 21 22 23 24 25 26 27 28 29 30 31 32 33 34 35 36 37 38 39 40 41 42 43 44 45 46 47 48 49 50 51 52 53 54 55 56 57 58 59 60 61
An up-regulated protein in fish fed the WF diet (spot 30) was identified
356
as a tissue inhibitor of metalloproteinase 2b (timp2b), which inhibits the matrix
357
metalloproteinases (MMPs) in tissues. Similarly TIMP has been identified in
358
common carp, and was suggested to be involved in immune response, as its
359
expression raises with a bacterial infection in several tissues such as spleen,
360
blood and head kidney(Xu et al. 2011). TIMPs regulate the activity of MMPs to
361
maintain the balance in proteolysis. The ratio and the expression level
362
between these proteins are quite important in the activation of the immune
363
system and might be used as disease biomarkers(Castillo-Briceno et al.
364
2010). In gilthead seabream, TIMPs are induced when an inflammatory
365
response occurs against pathogenic patterns(Castillo-Briceno et al. 2010).
366
One protein was identified as serpin (spot 41) with functional roles in
367
growth, development, pathophysiology and injury(Umasuthan et al. 2011).
368
This family might show down- and up-regulation as many isoforms are
369
present in teleosts (e.g. different clades and members) resulting in slightly
370
different functions(Gettins 2002; Kaiserman and Bird 2005). A BLAST
371
alignment was performed against the NCBInr database (31-08-2016) and the
372
alpha-1-antitrypsin was identified (SerpinA1 gene) for Epinephelus coioides
373
with an E-value of 3e-122. This isoform shows up-regulation in fish fed the
374
WF. The up-regulation of proteases at cold water temperatures is
375
demonstrated in gilthead seabream that were exposed to 8 ºC, showing that
376
proteolysis is reestablishing cells (Ibarz et al. 2010a).
377
A complement component C3 (thioester-containing family) was
378
identified in spot 37. In gilthead seabream, five different forms of C3 were
379
identified, each with specific binding(Watts et al. 2001). A BLAST alignment
380 1 2 3 4 5 6 7 8 9 10 11 12 13 14 15 16 17 18 19 20 21 22 23 24 25 26 27 28 29 30 31 32 33 34 35 36 37 38 39 40 41 42 43 44 45 46 47 48 49 50 51 52 53 54 55 56 57 58 59 60
was performed against the NCBInr database (31-08-2016) in order to identify
381
the isoform of this C3, but no information about the morphism of this protein
382
was obtained, although some polymorphisms have been identified on genes
383
altering the functions of the protein (Watts et al. 2001). This protein, despite
384
being down-regulated in fish fed the WF, participates in the classical and
385
alternative pathway of the complement system which plays a key role in the
386
innate immunity of fish (Boshra et al. 2006). The importance of this protein is
387
also shown in human autoimmune diseases being involved in pathogenesis
388
(Chen et al. 2010; Holers 2014). It has been described that at lower
389
temperatures the innate parameters in fish are activated, with mucus
390
production declining in Channel catfish when fish were exposed to a
391
temperature shift from 22 to 10 ºC, decreasing skin protection against
392
opportunistic pathogens(Magnadottir 2006).
393
Transferrin is down-regulated in fish fed the WF diet (spot 42).
394
Belonging to the superfamily of iron-binding proteins, transferrins are involved
395
in the control of iron levels in blood, as oxidative damage might occur with an
396
excess of iron (Garcia-Fernandez et al. 2011). This protein has also been
397
identified in a gilthead seabream study fed with different diets in, where a
398
different expression of this protein was observed when fish where fed diets
399
with hemoglobin supplementation (Ghisaura et al. 2014). Transferrins are also
400
involved in the non-specific humoral defense mechanism (Dietrich et al.
401
2010), which uses factors to inhibit bacterial growth(Garcia-Fernandez et al.
402
2011). In rainbow trout, transferrin acts as a positive acute phase
403
protein(Bayne and Gerwick 2001), 24-48 hours after induction of the immune
404
system with lipopolysaccharide, free iron levels in plasma were lower (Bayne
405 1 2 3 4 5 6 7 8 9 10 11 12 13 14 15 16 17 18 19 20 21 22 23 24 25 26 27 28 29 30 31 32 33 34 35 36 37 38 39 40 41 42 43 44 45 46 47 48 49 50 51 52 53 54 55 56 57 58 59 60 61
et al. 2001). No iron has been specifically added to the diets but some heme
406
and non-heme (complexed with transferrin and/or ferritin) iron is present in
407
fishmeal. In the winter feed diet a vitamin and mineral premix, Lutavit C35
408
(vitamin C) and Lutavit E50 (vitamin E) have been added in a higher amount
409
due to their antioxidant functions. Ascorbic acid, a form of vitamin C, has been
410
used in a study with Atlantic salmon, and was proven to have a critical role in
411
releasing iron from transferrin, while also preventing oxidative
412
damage(Andersen et al. 1998; Ortuno et al. 1999).
413
Taken together, the observed changes in the expression of these
414
proteins involved in the stress and immune responses suggest that fish fed
415
the WF, seem to have a general improvement on their immune condition.
416
However, further studies focusing on a set of specific and non-specific
417
immune parameters would be needed to confirm this hypothesis.
418 419
4.2 Metabolites 420
421
Cortisol levels are, in general, 10-fold higher in this experiment than
422
reported basal values(Laiz-Carrion et al. 2003). This may mean that the cold
423
exposure conditions verified in the present study were inducing a chronic
424
stress situation. Cortisol is commonly used as a parameter to assess stress
425
response in fish species (Arends et al. 1999), and elevated cortisol levels
426
were reported in chronic stressed seabream(Alves et al. 2010). WF fed fish
427
show a tendency for a slightly higher value of cortisol but it is not significantly
428
different compared to CTRL fish.
429
Glucose levels are 1.5-fold higher than reported basal
values(Lopez-430
Olmeda et al. 2009), although acute stress due to crowding results in values
431 1 2 3 4 5 6 7 8 9 10 11 12 13 14 15 16 17 18 19 20 21 22 23 24 25 26 27 28 29 30 31 32 33 34 35 36 37 38 39 40 41 42 43 44 45 46 47 48 49 50 51 52 53 54 55 56 57 58 59 60
higher than those seen in the control fish in our experiment(Lopez-Olmeda et
432
al. 2009; Ortuno et al. 2001). An increase in cortisol and glucose levels has
433
also been shown when water temperatures dropped from 18 to 9 ºC in 24h in
434
seabream while lactate showed no significant differences (Rotllant et al.
435
2000). In our trial basal lactate levels are lower and no significant differences
436
were seen. Nevertheless, a tendency for a slightly higher concentration was
437
detected in WF fed fish.
438
Taken together, cortisol and glucose levels suggest that both control
439
and WF fish groups may have been under chronic stress induced by low
440
temperatures.
441
Cholesterol is a precursor of cortisol and levels might be influenced by
442
different ingredients in fish diets. Studies show that cholesterol levels are
443
higher in individuals fed fish meal diets instead of plant protein
diets(Sitja-444
Bobadilla et al. 2005). WF has a higher percentage of fish meal compared to
445
the control diet (Table 1), which might explain the higher cholesterol levels
446
measured in plasma. Higher plasma cholesterol levels observed in fish fed
447
WF diet are consistent with the higher plasma levels of HDL suggested by the
448
increase in apo A-I abundance measured in those fish.
449
Analysis of the amino acid (AA) composition in plasma shows a
450
significant higher concentration in fish fed the control diet for 9 of them,
451
namely Arg, His, Lys, Trp, Tyr, Gly, Asn, Ser and GABA. Studies performed
452
with different diets and under different stressors in Senegalese sole show that
453
levels of some plasma free AA are significantly affected by both diet AA
454
composition and stress conditions(Conceicao et al. 2012; Costas et al. 2012).
455
Moreover, it has been described for Senegalese sole that chronic stress tends
456 1 2 3 4 5 6 7 8 9 10 11 12 13 14 15 16 17 18 19 20 21 22 23 24 25 26 27 28 29 30 31 32 33 34 35 36 37 38 39 40 41 42 43 44 45 46 47 48 49 50 51 52 53 54 55 56 57 58 59 60 61
to decrease plasma free AA concentrations, but the individual AA affected and
457
magnitude of these changes seem to depend on the type of chronic
458
stress(Costas et al. 2012), and have been related to differences in amino acid
459
requirements(Conceicao et al. 2012). Therefore, one possibility is that fish fed
460
the WF had higher requirements for the nine amino acids whose
461
concentration has decreased. These eventual additional requirements may be
462
related to the improved immune condition already proposed for the WF fed
463
fish. In any case, and once both groups in the present study seem to have
464
been chronically stressed by low temperature, it seems that fish fed the two
465
diets found different metabolic adaptions to cope with thermal stress.
466 467
5. Conclusions
468469
Comparative plasma proteome analysis revealed that the winter feed
470
induced an up-regulation of some proteins involved in the immune system and
471
cell protection compared to control diet, suggesting that the addition of
472
vitamins and higher-quality lipids and proteins to the diet benefits fish health
473
condition. Diet WF also affected lipid metabolism as shown by the reduction in
474
plasma triglycerides levels, associated with an increase in cholesterol which
475
seemed consistent with the higher abundance of HDL-Apo A-I observed with
476
the comparative plasma proteome analysis. High cortisol and glucose levels
477
compared to literature data suggest that fish from both treatments were under
478
chronic thermal stress. However, no significant effects on stress related
479
plasma metabolites were observed in fish fed the two diets. Overall, this study
480
suggests that winter feed diet had a positive effect on fish condition during
481 1 2 3 4 5 6 7 8 9 10 11 12 13 14 15 16 17 18 19 20 21 22 23 24 25 26 27 28 29 30 31 32 33 34 35 36 37 38 39 40 41 42 43 44 45 46 47 48 49 50 51 52 53 54 55 56 57 58 59 60
winter and might help preventing metabolic dysfunctions associated with cold
482
thermal stress. Proteomics has also proven once again to have a positive
483
impact in animal science particularly in fish biology, presenting itself as an
484
important tool to be included in future investigation of fish health, welfare and
485
production (Almeida et al. 2015).
486 487
6. Acknowledgments
488This work is part of project 21595-INUTR, co-financed by FEDER
489
through PO Algarve 21 in the framework of QREN 2007-2013. NR was
490
supported by a post-doctoral grant (SFRH/BDP/65578/2009) from the
491
Portuguese Foundation for Science and Technology (FCT).
492 493
7. References
494 495Almeida AM et al. (2015) Animal board invited review: advances in proteomics for 496
animal and food sciences Animal 9:1-17 doi:10.1017/S1751731114002602 497
Alves RN et al. (2010) Metabolic molecular indicators of chronic stress in gilthead 498
seabream (Sparus aurata) using comparative proteomics Aquaculture 299:57-66 499
doi:10.1016/j.aquaculture.2009.11.014 500
Andersen F, Lygren B, Maage A, Waagbo R (1998) Interaction between two dietary 501
levels of iron and two forms of ascorbic acid and the effect on growth, 502
antioxidant status and some non-specific immune parameters in Atlantic salmon 503
(Salmo salar) smolts Aquaculture 161:437-451 doi:10.1016/S0044-504
8486(97)00291-3 505
Arends RJ, Mancera JM, Munoz JL, Wendelaar Bonga SE, Flik G (1999) The stress 506
response of the gilthead sea bream (Sparus aurata L.) to air exposure and 507
confinement J Endocrinol 163:149-157 508
Bavcevic L, Petrovic S, Crnica M, Corazzin E (2006) Effects of feeding strategy on growth 509
of sea bream (Sparus aurata L.) during winter-spring and possible implications 510
for »winter disease« syndrome Croat J Fish 64:1-17 511
Bayne CJ, Gerwick L (2001) The acute phase response and innate immunity of fish Dev 512
Comp Immunol 25:725-743 doi:10.1016/S0145-305x(01)00033-7 513
Bayne CJ, Gerwick L, Fujiki K, Nakao M, Yano T (2001) Immune-relevant (including acute 514
phase) genes identified in the livers of rainbow trout, Oncorhynchus mykiss, by 515
means of suppression subtractive hybridization Dev Comp Immunol 25:205-217 516
doi:10.1016/S0145-305x(00)00057-4 517
Boshra H, Li J, Sunyer JO (2006) Recent advances on the complement system of teleost 518
fish Fish Shellfish Immunol 20:239-262 doi:10.1016/j.fsi.2005.04.004 519 1 2 3 4 5 6 7 8 9 10 11 12 13 14 15 16 17 18 19 20 21 22 23 24 25 26 27 28 29 30 31 32 33 34 35 36 37 38 39 40 41 42 43 44 45 46 47 48 49 50 51 52 53 54 55 56 57 58 59 60 61
Caraux G, Pinloche S (2005) PermutMatrix: a graphical environment to arrange gene 520
expression profiles in optimal linear order Bioinformatics 21:1280-1281 521
doi:10.1093/bioinformatics/bti141 522
Castillo-Briceno P, Arizcun-Arizcun M, Meseguer J, Mulero V, Garcia-Ayala A (2010) 523
Correlated expression profile of extracellular matrix-related molecules during 524
the inflammatory response of the teleost fish gilthead seabream Dev Comp 525
Immunol 34:1051-1058 doi:10.1016/j.dci.2010.05.007 526
Chen M, Daha MR, Kallenberg CGM (2010) The complement system in systemic 527
autoimmune disease J Autoimmun 34:J276-J286 doi:10.1016/j.jaut.2009.11.014 528
Conceicao LEC, Aragao C, Dias J, Costas B, Terova G, Martins C, Tort L (2012) Dietary 529
nitrogen and fish welfare Fish Physiol Biochem 38:119-141 530
doi:10.1007/s10695-011-9592-y 531
Concha MI, Molina S, Oyarzun C, Villanueva J, Amthauer R (2003) Local expression of 532
apolipoprotein A-I gene and a possible role for HDL in primary defence in the 533
carp skin Fish Shellfish Immunol 14:259-273 doi:10.1006/fsim.2002.0435 534
Concha MI, Smith VJ, Castro K, Bastias A, Romero A, Amthauer RJ (2004) 535
Apolipoproteins A-I and A-II are potentially important effectors of innate 536
immunity in the teleost fish Cyprinus carpio Eur J Biochem 271:2984-2990 537
doi:10.1111/j.1432-1033.2004.04228.x 538
Costas B et al. (2012) Effects of dietary amino acids and repeated handling on stress 539
response and brain monoaminergic neurotransmitters in Senegalese sole (Solea 540
senegalensis) juveniles Comp Biochem Physiol A Mol Integr Physiol 161:18-26 541
doi:10.1016/j.cbpa.2011.08.014 542
Davis P (1988) Two occurrences of the gilthead, Sparus aurata Linnaeus 1758, on the 543
coast of Northumberland, England J Fish Biol 33:951-952 doi:10.1111/j.1095-544
8649.1988.tb05545.x 545
Dias J, Conceicao LEC, Ribeiro AR, Borges P, Valente LMP, Dinis MT (2009) Practical diet 546
with low fish-derived protein is able to sustain growth performance in gilthead 547
seabream (Sparus aurata) during the grow-out phase Aquaculture 293:255-262 548
doi:10.1016/j.aquaculture.2009.04.042 549
Dietrich MA et al. (2010) Isolation and characterization of transferrin from common 550
carp (Cyprinus carpio L.) seminal plasma Fish Shellfish Immunol 29:66-74 551
doi:DOI 10.1016/j.fsi.2010.02.015 552
FAO (2012) The state of world fisheries and aquaculture Food and agriculture 553
organization of the United Nations. 554
Feidantsis K, Antonopoulou E, Lazou A, Portner HO, Michaelidis B (2013) Seasonal 555
variations of cellular stress response of the gilthead sea bream (Sparus aurata) J 556
Comp Physiol B 183:625-639 doi:10.1007/s00360-012-0735-y 557
Garcia-Fernandez C, Sanchez JA, Blanco G (2011) Characterization of the gilthead 558
seabream (Sparus aurata L.) transferrin gene: Genomic structure, constitutive 559
expression and SNP variation Fish Shellfish Immunol 31:548-556 doi:DOI 560
10.1016/j.fsi.2011.07.003 561
Gettins PGW (2002) Serpin structure, mechanism, and function Chem Rev 102:4751-562
4803 doi:10.1021/Cr010170+ 563
Ghisaura S et al. (2014) Impact of three commercial feed formulations on farmed 564
gilthead sea bream (Sparus aurata, L.) metabolism as inferred from liver and 565
blood serum proteomics Proteome Sci 12 doi:10.1186/s12953-014-0044-3 566
Holers VM (2014) Complement and Its Receptors: New Insights into Human Disease 567
Annu Rev Immunol 32:433-459 doi:10.1146/annurev-immunol-032713-120154 568
Ibarz A, Beltran M, Fernandez-Borras J, Gallardo MA, Sanchez J, Blasco J (2007) 569
Alterations in lipid metabolism and use of energy depots of gilthead sea bream 570
(Sparus aurata) at low temperatures Aquaculture 262:470-480 571 doi:10.1016/j.aquaculture.2006.11.008 572 1 2 3 4 5 6 7 8 9 10 11 12 13 14 15 16 17 18 19 20 21 22 23 24 25 26 27 28 29 30 31 32 33 34 35 36 37 38 39 40 41 42 43 44 45 46 47 48 49 50 51 52 53 54 55 56 57 58 59 60
Ibarz A, Martin-Perez M, Blasco J, Bellido D, de Oliveira E, Fernandez-Borras J (2010a) 573
Gilthead sea bream liver proteome altered at low temperatures by oxidative 574
stress Proteomics 10:963-975 doi:10.1002/pmic.200900528 575
Ibarz A, Padros F, Gallardo MA, Fernandez-Borras J, Blasco J, Tort L (2010b) Low-576
temperature challenges to gilthead sea bream culture: review of cold-induced 577
alterations and 'Winter Syndrome' Rev Fish Biol Fisher 20:539-556 578
doi:10.1007/s11160-010-9159-5 579
Kaiserman D, Bird PI (2005) Analysis of vertebrate genomes suggests a new model for 580
clade B serpin evolution Bmc Genomics 6:167-177 doi:10.1186/1471-2164-6-581
167 582
Kikuchi K, Watabe S, Aida K (1997) The Wap65 gene expression of goldfish (Carassius 583
auratus) in association with warm water temperature as well as bacterial 584
lipopolysaccharide (LPS) Fish Physiol Biochem 17:423-432 585
doi:10.1023/A:1007768531655 586
Laiz-Carrion R, Del Rio MPM, Miguez JM, Mancera JM, Soengas JL (2003) Influence of 587
cortisol on osmoregulation and energy metabolism in gilthead seabream Sparus 588
aurata J Exp Zool Part A 298A:105-118 doi:10.1002/Jez.A.10256 589
Liang P, MacRae TH (1997) Molecular chaperones and the cytoskeleton J Cell Sci 590
110:1431-1440 591
Lopez-Olmeda JF, Montoya A, Oliveira C, Sanchez-Vazquez FJ (2009) Synchronization to 592
Light and Restricted-Feeding Schedules of Behavioral and Humoral Daily 593
Rhythms in Gilthead Sea Bream (Sparus Aurata) Chronobiol Int 26:1389-1408 594
doi:10.3109/07420520903421922 595
Magnadottir B (2006) Innate immunity of fish (overview) Fish Shellfish Immunol 596
20:137-151 doi:10.1016/j.fsi.2004.09.006 597
Mao L, Bryantsev AL, Chechenova MB, Shelden EA (2005) Cloning, characterization, and 598
heat stress-induced redistribution of a protein homologous to human hsp27 in 599
the zebrafish Danio rerio Exp Cell Res 306:230-241 600
doi:10.1016/j.yexer.2005.02.007 601
Marvin M, O'Rourke D, Kurihara T, Juliano CE, Harrison KL, Hutson LD (2008) 602
Developmental expression patterns of the zebrafish small heat shock proteins 603
Dev Dynam 237:454-463 doi:10.1002/Dvdy.21414 604
Mounier N, Arrigo AP (2002) Actin cytoskeleton and small heat shock proteins: how do 605
they interact? Cell Stress Chaperon 7:167-176 doi:10.1379/1466-606
1268(2002)007<0167:Acashs>2.0.Co;2 607
Nynca J, Dietrich MA, Karol H, Ciereszko A (2010) Identification of apolipoprotein C-I in 608
rainbow trout seminal plasma Reprod Fert Develop 22:1183-1187 609
doi:10.1071/Rd10066 610
Ortuno J, Esteban MA, Meseguer J (1999) Effect of high dietary intake of vitamin C on 611
non-specific immune response of gilthead seabream (Sparus aurata L.) Fish 612
Shellfish Immunol 9:429-443 doi:10.1006/fsim.1998.0201 613
Ortuno J, Esteban MA, Meseguer J (2001) Effects of short-term crowding stress on the 614
gilthead seabream (Sparus aurata L) innate immune response Fish Shellfish 615
Immunol 11:187-197 doi:10.1006/fsim.2000.0304 616
Piras C et al. (2014) Serum protein profiling of early and advancedstage Crohn’s disease 617
EuPA Open Proteomics 3:48-59 doi:10.1016/j.euprot.2014.02.010 618
Rodrigues PM, Silva TS, Dias J, Jessen F (2012) PROTEOMICS in aquaculture: 619
Applications and trends J Proteomics 75:4325-4345 620
doi:10.1016/j.jprot.2012.03.042 621
Rotllant J, Balm PHM, Wendelaar-Bonga SE, Perez-Sanchez J, Tort L (2000) A drop in 622
ambient temperature results in a transient reduction of interrenal ACTH 623
responsiveness in the gilthead sea bream (Sparus aurata, L.) Fish Physiol 624 Biochem 23:265-273 625 1 2 3 4 5 6 7 8 9 10 11 12 13 14 15 16 17 18 19 20 21 22 23 24 25 26 27 28 29 30 31 32 33 34 35 36 37 38 39 40 41 42 43 44 45 46 47 48 49 50 51 52 53 54 55 56 57 58 59 60 61
Sala-Rabanal M, Sanchez J, Ibarz A, Fernandez-Borras J, Blasco J, Gallardo MA (2003) 626
Effects of low temperatures and fasting on hematology and plasma composition 627
of gilthead sea bream (Sparus aurata) Fish Physiol Biochem 29:105-115 628
Silva TS, Cordeiro O, Richard N, Conceicao LE, Rodrigues PM (2011) Changes in the 629
soluble bone proteome of reared white seabream (Diplodus sargus) with 630
skeletal deformities Comp Biochem Physiol Part D Genomics Proteomics 6:82-91 631
doi:10.1016/j.cbd.2010.03.008 632
Silva TS, Cordeiro OD, Matos ED, Wulff T, Dias JP, Jessen F, Rodrigues PM (2012a) Effects 633
of Preslaughter Stress Levels on the Post-mortem Sarcoplasmic Proteomic 634
Profile of Gilthead Seabream Muscle J Agr Food Chem 60:9443-9453 635
doi:10.1021/Jf301766e 636
Silva TS, da Costa AM, Conceicao LE, Dias JP, Rodrigues PM, Richard N (2014) Metabolic 637
fingerprinting of gilthead seabream (Sparus aurata) liver to track interactions 638
between dietary factors and seasonal temperature variations PeerJ 2:e527 639
doi:10.7717/peerj.527 640
Silva TS et al. (2012b) Dietary tools to modulate glycogen storage in gilthead seabream 641
muscle: glycerol supplementation J Agric Food Chem 60:10613-10624 642
doi:10.1021/jf3023244 643
Sitja-Bobadilla A, Pena-Llopis S, Gomez-Requeni P, Medale F, Kaushik S, Perez-Sanehez J 644
(2005) Effect of fish meal replacement by plant protein sources on non-specific 645
defence mechanisms and oxidative stress in gilthead sea bream (Sparus aurata) 646
Aquaculture 249:387-400 doi:10.1016/j.aquaculture.2005.03.031 647
Sola L, Moretti, A., Crosetti, D., Karaiskou, N., Magoulas, A., Rossi, A.R., Rye, M., 648
Triantafyllidis, A, Tsigenopoulos, C.S. (2005) Gilthead seabream - Sparus aurata 649
Genimpact final scientific report 650
Tibaldi E, Hakim Y, Uni Z, Tulli F, de Francesco M, Luzzana U, Harpaz S (2006) Effects of 651
the partial substitution of dietary fish meal by differently processed soybean 652
meals on growth performance, nutrient digestibility and activity of intestinal 653
brush border enzymes in the European sea bass (Dicentrarchus labrax) 654
Aquaculture 261:182-193 doi:10.1016/j.aquaculture.2006.06.026 655
Tort L et al. (2004) Effects of temperature decrease on feeding rates, immune indicators 656
and histopathological changes of gilthead sea bream Sparus aurata fed with an 657
experimental diet Aquaculture 229:55-65 doi:10.1016/S0044-8486(03)00403-4 658
Tort L, Rotllant J, Rovira L (1998) Immunological suppression in gilthead sea bream 659
Sparus aurata of the North-West Mediterranean at low temperatures Comp 660
Biochem Phys A 120:175-179 661
Umasuthan N et al. (2011) Rock bream (Oplegnathus fasciatus) serpin, protease nexin-1: 662
Transcriptional analysis and characterization of its antiprotease and 663
anticoagulant activities Dev Comp Immunol 35:785-798 664
doi:10.1016/j.dci.2011.03.013 665
Watts M, Munday BL, Burke CM (2001) Immune responses of teleost fish Aust Vet J 666
79:570-574 667
Xu XY, Shen YB, Yang XM, Li JL (2011) Cloning and characterization of TIMP-2b gene in 668
grass carp Comp Biochem Phys B 159:115-121 doi:10.1016/j.cbpb.2011.02.008 669
670
8. Figure legends
671Figure 1 – Schematic representation of the experimental design. 672
Figure 2 – Temperature shift during the winter period (from 18-11-2011 673
until 7-3-2012). The light grey line denotes the critical 12 ºC
674 temperature threshold. 675 1 2 3 4 5 6 7 8 9 10 11 12 13 14 15 16 17 18 19 20 21 22 23 24 25 26 27 28 29 30 31 32 33 34 35 36 37 38 39 40 41 42 43 44 45 46 47 48 49 50 51 52 53 54 55 56 57 58 59 60
Figure 3 – Wet body weight (g) of the fish fed with diet CTRL and diet 676
WF, at the start of the trial (November) and at the sampling of the end
677
of winter period (March). Values are means (n=20), error bars
678
represent standard deviation. Mean values are significantly different
679
between groups at the end of winter (Student’s t-test, p=0.0165).
680
Figure 4 – Representative 2D-DIGE gel of plasma of Sparus aurata on 681
a 12.5% polyacrylamide gel, in which spots marked with a circle are up
682
regulated and spots marked with a square are down regulated in fish
683
fed with winter feed.
684
Figure 5 – Heat map representation of identified proteins (white/grey 685
means “below average expression”, while dark grey/black means
686
“above average expression”). Dendograms attached to the columns
687
and rows display hierarchical agglomerative clustering of samples and
688
variables based on their Euclidian distance. Cx – fish fed the control
689
diet, Wx – fish fed the winter feed.
690 691
Figure 6 – PCA biplot representation of the control fish and the study 692
group along with sequenced spots. CTRL represents control samples
693
and WF represents winter feed samples. Numbers with an x represent
694
spot numbers.
695 696
Figure 7 – Simplified metabolism version of three identified proteins in 697
plasma of gilthead seabream, namely transferrin (TF), apolipoprotein
698
A-I (ApoA-I) and alpha-2-macroglobulin (a2M). Legend: TFR –
699
transferrin receptor, HDL – high density lipoprotein, SR-B1 – scavenger
700
receptor class B member 1 (HDL receptor).
701 702
Figure 8 – Plasma lactate (mM), TAG (mM), glucose (mM), cholesterol 703
(mM) and cortisol (nM) concentration of gilthead seabream after 116
704
days of trial (end of winter period). Values are means and error bars
705
represent standard deviation. Different letters (a and b) represent
706
significant differences (Student’s t-test, values in graphics).
707 708 1 2 3 4 5 6 7 8 9 10 11 12 13 14 15 16 17 18 19 20 21 22 23 24 25 26 27 28 29 30 31 32 33 34 35 36 37 38 39 40 41 42 43 44 45 46 47 48 49 50 51 52 53 54 55 56 57 58 59 60 61
9. Table legends
709Table 1 - Ingredient formulation and proximate composition of the
710
experimental diets. 711
a Peruvian fishmeal LT: 670 g kg-1 crude protein (CP), 90 g kg-1 crude fat (CF), EXALMAR,
712
Peru. 713
b Fish by-products meal: 540 g kg-1 CP, 80 g kg-1 CF, COFACO, Portugal.
714
c Krill protein hydrolysate: >700 g kg-1 CP, <30 g kg-1 CF, OLYMPIC SEAFOOD AS, Norway.
715
d Soycomil PC: 630 g kg-1 CP, <10 g kg-1 CF, ADM, The Netherlands.
716
e Lysamine GP: 780 g kg-1 CP, 80 g kg-1 CF, ROQUETTE, France.
717
f GLUTALYS: 610 g kg-1 CP, 80 g kg-1 CF, ROQUETTE, France.
718
g VITEN: 857 g kg-1 CP, 13 g kg-1 CF, ROQUETTE, France.
719
h Solvent extracted dehulled soybean meal: 470 g kg-1 CP, 26 g kg-1 CF, SORGAL SA,
720
Portugal. 721
i Dehulled grinded pea grits: 240 g kg-1, <10 g kg-1 CF, SOTEXPRO, France.
722
j Henry Lamotte Oils GmbH, Germany.
723
k Krill PPC (25-30% phospholipids): 450 g kg-1 CP, 500 g kg-1 CF, OLYMPIC SEAFOOD AS,
724
Norway. 725
l Yelkinol AC (65% phospholipids): 750 g kg-1 CF, ADM, The Netherlands.
726
m Premix for marine fish, PREMIX Lda, Portugal. Vitamins (IU or mg/kg diet): sodium
727
menadione bisulphate, 10 mg; retinyl acetate, 8000 IU; DL-cholecalciferol, 1700 IU; thiamin, 8 728
mg; riboflavin, 20 mg; pyridoxine, 10 mg; cyanocobalamin, 0.02 mg; nicotinic acid, 30 mg; folic 729
acid, 6 mg; inositol, 300 mg; biotin, 0.7 mg; calcium panthotenate, 70 mg; betaine, 400 mg. 730
Minerals (mg/kg diet): cobalt carbonate, 0.1 mg; copper sulphate, 5 mg; ferric sulphate, 60 mg; 731
potassium iodide, 1.5 mg; manganese oxide, 20 mg; sodium selenite, 0.25 mg; zinc oxide, 30 732
mg; sodium chloride, 80 mg; excipient: wheat middlings. 733
n Premix for marine fish, PREMIX Lda, Portugal. Vitamins (IU or mg/kg diet): sodium
734
menadione bisulphate, 15 mg; retinyl acetate, 12000 IU; DL-cholecalciferol, 2250 IU; thiamin, 735
12 mg; riboflavin, 30 mg; pyridoxine, 15 mg; cyanocobalamin, 0.03 mg; nicotinic acid, 45 mg; 736
folic acid, 9 mg; inositol, 450 mg; biotin, 1.05 mg; calcium panthotenate, 105 mg; betaine, 600 737
mg. Minerals (mg/kg diet): cobalt carbonate, 0.15 mg; copper sulphate, 7.5 mg; ferric sulphate, 738
90 mg; potassium iodide, 2.25 mg; manganese oxide, 30 mg; sodium selenite, 0.38 mg; zinc 739
oxide, 45 mg; sodium chloride, 120 mg; excipient: wheat middlings. 740
o Dicalcium phosphate: 18% phosphorus, 23% calcium, Fosfitalia, Italy.
741
p Vitamin C: >35% sodium and calcium salts of ascorbyl-2-phosphate, BASF, Germany.
742
q Vitamin E: >50% DL-alpha-tocopheryl acetate, BASF, Germany.
743
r L-Lysine HCl 99%: Ajinomoto Eurolysine SAS, France.
744
s L-Taurine 99%: Ajinomoto Eurolysine SAS, France.
745
t Betafin S1 (>96% betaine): DANISCO, Denmark.
746 747 748
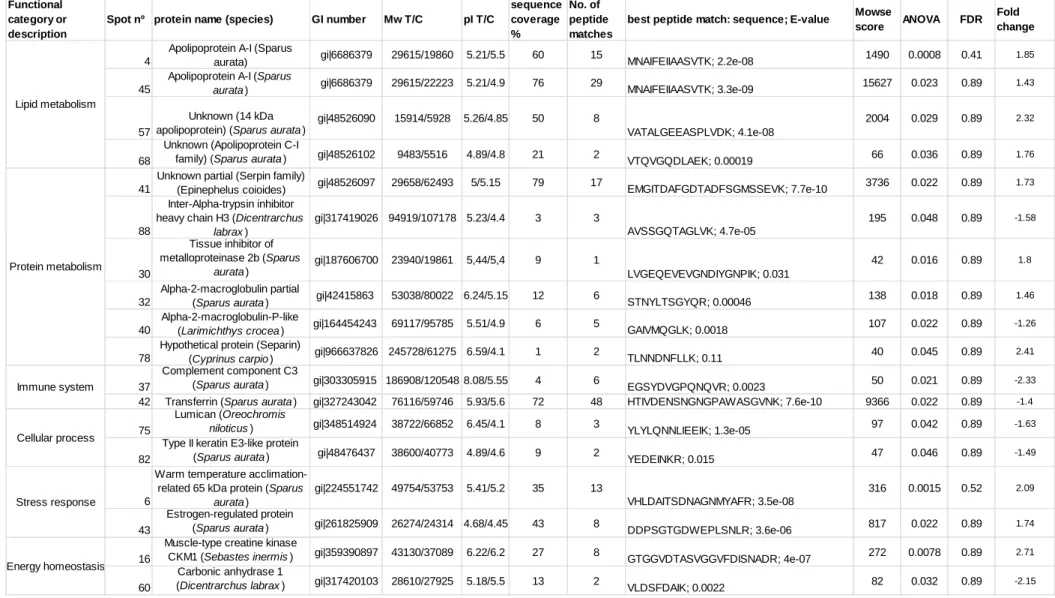
Table 2 - Protein identification of plasma of gilthead seabream by
ESI-749
orbitrap mass spectrometry, using the MASCOT search engine, showing 750
accession number, the theoretical (T) and calculated (C) molecular weight 751
(Mw) and isoelectric point (pI), percentage of sequence coverage, number of 752
peptide matches with sequence, mowse score, ANOVA p-value, FDR – false 753
discovery rate and fold change expression (positive value stands for an up-754
regulation in fish fed the winter feed). 755
756
Table 3 – Plasma free amino acid concentration (µM) in gilthead seabream at
757
the end of winter period, fed control (CTRL) and winter feed (WF) diets. 758 1 2 3 4 5 6 7 8 9 10 11 12 13 14 15 16 17 18 19 20 21 22 23 24 25 26 27 28 29 30 31 32 33 34 35 36 37 38 39 40 41 42 43 44 45 46 47 48 49 50 51 52 53 54 55 56 57 58 59 60
Values are means (n=2 pools of 5 fish per dietary treatment) in duplicate ± 759
standard deviation. Values not sharing a common letter in the same line are 760
significantly different (Student’s t-test). 761 762 1 2 3 4 5 6 7 8 9 10 11 12 13 14 15 16 17 18 19 20 21 22 23 24 25 26 27 28 29 30 31 32 33 34 35 36 37 38 39 40 41 42 43 44 45 46 47 48 49 50 51 52 53 54 55 56 57 58 59 60 61
CTRL WF Ingredients (% w/w)
Fishmeal 70 LTa 10.0 30.0
Fishmeal 65b 5.0 10.8
Krill protein hydrolysatec 0.0 5.0
Soy protein concentrated 8.0 0.0
Pea protein concentratee 4.0 0.0
Corn glutenf 16.0 5.5 Wheat gluteng 8.4 0.0 Soybean meal 48h 16.5 7.0 Wheat meal 5.0 12.5 Rapeseed meal 4.0 0.0 Aquatex G2000 (bran)i 2.0 3.0 Fish oilj 10.0 8.0 Rapeseed oilj 5.7 0.0 Krill PPCk 0.0 12.5 Soy lecithinl 0.0 1.0
Guar gum (binder) 0.5 0.5
Vit & Min Premix PVO 40/02 0.2m 0.3n
DCPo 4.0 1.0 Lutavit C35p 0.0 0.3 Lutavit E50q 0.1 0.5 L-Lysiner 0.5 0.0 L-Taurines 0.0 1.0 Choline chloride 0.1 0.1 Betainet 0.0 1.0 CTRL WF Proximate composition Dry matter (DM), % 97.5 94.3 Crude protein, % DM 48.3 50.6 Crude fat, % DM 19.6 19.7 Ash, % DM 8.2 10.9 Gross Energy, MJ/kg 22.8 22.4 Phosphorus, % DM 1.5 1.7