Faculdade de Ciências do Mar e Ambiente
DOES THE [NTERRENAL INFLUENCE SEX DIFFERENTIATION IN SEA
BASS, Dicentmrch us labrax?
Dissertação apresentada à Universidade do
Algarve para obtenção do grau de Mestre
Rute Sofia Tavares Martins
Júri:
Orientador: Doutor Adelino Vicente Mendonça Canário, Professor
Catedrático- Universidade do Algarve.
Arguentes: Doutora Maria Teresa Dinis, Professora
Catedrática-Universidade do Algarve
Doutora Maria Armanda Reis-Henriques, Professora
Associada- Instituto de Ciência Biomédicas Abel Salazar, Universidade do Porto
Classificação: Tese de Mestrado aprovada por unanimidade.
O conteúdo desta tese é da inteira responsabilidade do autor
levlfí
(lol/oil/2% líoctiiuí
Ao Professor Adelino Canário pela oportunidade que me deu para fazer este trabalho, disponibilidade, paciência e interesse demonstrado ao longo da realização deste trabalho; pela revisão do texto, leitura crítica. que em muito contribuíram para a realização deste trabalho.
Á Professora Deborah Power, pelo incentivo e apoio prestado na parte prática deste
trabalho, bem como pela disponibilidade que sempre demonstrou no seu decorrer.
Ao Juan Fuentes, para quem todas as palavras serão sempre insuficientes para agradecer
tudo o que deu durante toda a tese. A ele agradeço a amizade e apoio incondicional que
deu durante a preparação, elaboração do trabalho prático e da escrita da tese. Pela
orientação que sempre deu em cada experiência feita, pela interpretação e análise dos
resultados, pela consolidação da tese em geral, orientação essa que me ensinou o muito que aprendi neste trabalho. Pela leitura crítica. sugestões, e fundamentalmente pela amizade que me deu em todos os momentos. A ele agradeço a força que me deu nos piores momentos, sem qual teria sido difícil ter acabado esta tese e pela qual lhe dedico esta tese.
Ao Pedro Guerreiro e ao Pep Rotllant, pela amizade e ajuda que me deram tanto na
elaboração das experiências de stress como na análise dos resultados.
A Elsa Couto que para além do muito que me ensinou sobre os RIAS, foi uma mãe 24
horas por dia.
Ao João Kondeka, meu companheiro de crime no laboratório, no ramalhete, nas
amostragens e nos longos almoços.
À Teresa Modesto e Natália Moura pela amizade e ajuda que me deram na histologia, que tudo me ensinaram.
devo ainda a disponibilidade sempre demonstrada. leitura crítica e sugestões dadas ao longo da elaboração deste trabalho.
A minha companheira de maratonas de trabalho fora de horas Lurdes Diogo cujo apoio sempre demonstrado me ajudou a andar para a frente.
Aos meus companheiros de bancada que foram quem mais aturou e apoiou no dia a dia, nos bons e maus momentos, Liliana Anjos e Marco Campinho (Cota).
Aos meus colegas, companheiros e acima de tudo amigos Ana Passos, Rui Serrano, Ana
Freitas e Dulce Estevão pela amizade, força, dedicação e paciência que jamais faltou em
todos os momentos.
A todos os outros companheiros de trabalho pela camaradagem e amizade que me
deram João Reis, Mário Cruz, José Eduardo Cavaco, Lília Brinca, João Cardoso,
Eduardo Barata, Peter Hubbard, Laurence Deloffre, Begoña Redruello, Natália
Moncout, Patrícia Pinto, Pedro Frade, Dulcineia, Liana e Isabel.
Aos amigos que sempre me apoiaram e sem os quais teria sido mais difícil ultrapassar
os piores momentos Nuno Henriques, Sacha Coesel, Pedro Cação, Rita Batista, Magda
Mendes, Soraia Santos, Guida Vensceslau, João Sendão, Ana Violante, Ana Madeira,
Jorge Pinto, Natércia, Carla Viegas, Paulo Gavaia, Luis Carlos e Paulo Penacho.
Aos meus pais e irmãos sem os quais não teria feito nada na vida, um eterno
Abstract
I-Introduction
Aim of the study 1 .l- Sex determination 1.2- Sex differentiation
1.2.1- Environmental sex differentiation
1.2.2- Endocrine sex differentiation
1.3- Interrenal tissue
1.3.1- Corticosteroids
1.3.2- Androgens
1.3.3- Estrogens
II-Material and Methods
Experiment I: Preliminary examination of the effect of dexamethasone
on plasma levels of cortisol and androgens.
Experiment H: Effect of dexamethasone administration on the sex ratio
of sea bass populations.
Experiment III: Effect of confinement and handling stress on hormone
levels.
Experiment IV: Effect of confinement and handling stress on hormone
levels in fish treated with dexamethasone.
2.1- Histology
2.2- Steroid assays
2.3- RNA isolation
2.4- Amplification of partial genes by RT-PCR
C-2.6.2- RT-PCR Southern blot analysis 2.7- Statistical analysis
III- Results
3.1- Preliminary examination of the effect of dexamethasone on plasma levels of cortisol and androgens
3.2- Effect of dexamethasone administration on the sex ratio of sea lbass
populations
3.3- Effect of confinement stress on hormone levels
3.4- Effect of handling stress on hormone levels
3.5- Effect of confinement stress on hormone levels in sea bass treated
with dexamethasone
3.6- Effect of handling stress on hormone levels in sea bass treated with
dexamethasone
3.7- Gene cloning
3.8- Gene expression- Semi-quantitative PCR
IV- Discussion
V- Final considerations
Sea bass Dicentrarchus labrax is one of the most important cultured species in
Mediterranean aquaculture. This species remains sexually immature most of the first
year of life, and at the time of marketing (2 years old), females are 18-40% heavier than
males. However, in cultured populations, it is frequently reported skewed sex ratios in
favour of males (reaching 70-99%), and thus, the acquisition of all-female stocks is an
attractive option for sea bass aquaculture. The underlying hypothesis of this work is that
in intensive culture, the sea bass interrenal tissue produces corticosteroids in response to
stress, and together with them an excess of adrenal androgens shifting the normal
androgen/ estrogen ratio and thus leading to gonadal masculinization. Thus, blocking
cortisol production with an antagonist (Dexamethasone) during the androgen sensitive
period would most likely decrease the androgen levels and thereby the sex ratios would be altered.
Administration of 75 mg Kg`1 food dexamethasone to fish during the period of
sexual differentiation did not alter the sex ratios in sea bass (60-65% males; 35-40%
females), however, 150 mg Kg`l food dexamethasone induced some alterations to the
normal development of the gonads. In this respect, 7% of the fish had testicular tissue
with scattered intra testicular oocytes and 4% of the fish were still undifferentiated at 10
months of age. However, the doses of dexamethasone administered to the fish had
significant side- effects on the normal growth of the fish. Furthermore, all stress
experiments performed failed to show a correlation between the elevated levels of
cortisol and androgen levels (testosterone and ll-ketotestosterone) in sea bass. Overall,
no conclusive data was obtained to establish a direct role of the interrenal tissue
corticosteroidogenesis on sexual differentiation.
Two steroidogenic enzymes (CYP 19 and CYP 11B1) and four steroid receptors
(ERoú, ERBI, ERB2 and ARB) were isolated in sea bass. In sexually differentiated fish,
the expression of CYP 19, ERB1 was higher in the ovarian tissue than in the testicular
tissue. On the contrary, the expression of CYP 11B1, ERB2 and ARB was higher in the
testicular tissue than in the ovarian tissue. The expression of ERot was never detected in
either gonad.
During the androgen sensitive period, the expression of CYP11B1 and ARB Was high but decreased towards the end of this period. CYP 19 and ERB2 Were initially
of ERo‹. was never detected. Moreover, the expression of CYP1 1Bl and ARB was
inversely correlated to the expression of ERB2. From all the genes isolated, only the
expression of ARB presented a dimorphic pattem of expression during the androgen
sensitive period.
Altogether: (1) no correlation between cortisol and androgens could be found in response to stress; (2) administration of dexamethasone induced some alterations on the
normal differentiation of the gonads, although no conclusive effect could be seen on the
sex ratios; (3) during the androgen sensitive period there was a negative correlation
between the expression of CYPl1B1 and ARB with the expression of ERB2. From all
the genes studied only the ARB presented a dimorphic pattern of expression, which
points out that this gene most likely possesses an essential role in sexual differentiation in sea bass.
I- INTRODUCTION
Sea bass Dicentrarchus labrax is one of the most important cultured species in
Mediterranean aquaculture. With the enonnous expansion of fish culture in the past
years, it has become evident that there is a necessity to enhance the expression of the
associated morphological and physiological characteristics that would be advantageous
tmder certain culture strategies. In this respect, it is desirable to eliminate the sex that
shows less growth and to prevent precocious sexual maturation that is associated to
weight loss and to decreased flesh quality (Piferrer et al., 1989).
Sea bass remains sexually immature most of the first year of life. Most males
reach puberty in the second year of life, while females reach puberty in the third year (Blázquez et al., 1995). Thus, males divert energy resources into gonad development, while females use those resources for somatic growth. As a result, females are 18-40% heavier than males at the time of marketing (at 2 years of age) (Blázquez et al., 1995;
Pavlidis et al., 2000). Since females do not mature before the time of marketing, and
grow faster than males, the acquisition of all-female stocks is an attractive option for sea
bass aquaculture.
In natural populations, predominance of female or male fish has been equally reported in sea bass (Chatain et al., 1999). In cultured populations, however, skewed sex ratios in favour of males are frequently reported (reaching 70-99%) (Blázquez et al., 1998). For this reason several studies have been conducted aiming to understand the factors affecting sexual differentiation in this species, and to achieve more balanced sex ratios or even female-dominant stocks.
Sea bass lack heteromorphic sex chromosomes and ploidy manipulations failed in modifying the sex ratio (Pavlidis et al., 2000; Chatain et al., 2000). Similarly, attempts to obtain a molecular probe to identify the genetic sex in this species have also failed (Ollevier et al., 1998).
In this species, size rather than age, has been shown to be a critical marker of the timing of sex differentiation (Blázquez et al., 1998). Nonetheless, the failure to identify sex during the early developmental stages does not allow to determine whether within a certain population, individuals become males because of their smaller growth, or smaller because of their maleness (Pavlidis et al., 2000).
The high diversity of reproductive strategies in fish, together with this diversity of sex-influencing factors, explains why no pattern of sexual differentiation can be
generalized for fish. Sex steroids, however, are involved both in triggering and/or
throughout the differentiation of the gonads in all fish species (Yamamoto, 1968).
It has been shown that in sea bass, the critical period during which the gonads
are still undifferentiated but exhibit increased sensitivity to exogenous steroids
treatments is located between days 57 and 137 post-fertilization (Pavlidis et al., 2000).
The critical period for androgen-inducible masculinization is between 96 and 126 days
post-fertilization (Blázquez et al., 2001). Thus, administration of androgens during this
period of development results in all-male populations (Chatain et al., 1999; Blázquez et
al., 2001; Blázquez et al., 1995). Moreover, oral administration of estrogens (estradiol)
has been shown to result in all-female populations in sea bass (Chatain et al., 2000).
Several attempts have been made to show that enviromnental parameters used
under rearing conditions are responsible for the excess of males in sea bass
aquacultures. So far, it has been shown that the period of ontogenesis in sea bass seems
to coincide also with a thermosensitive period and that the sex ratios can be manipulated
by controlling water temperature (Pavlidis et al., 2000; Bláquez et al., 1998). However,
results are contradictory and suggest different effects of the same range of temperatures
on sex ratios, depending on the stage of development of the fish. In this respect, eggs
incubated at low temperatures (l5°C) will result in female-biased populations (Pavlidis
et al., 2000), while fish larvae (57 days post-hatching) incubated at the same
temperature will result in male-biased populations (Bláquez et al., 1998). Even though it is still not possible to establish how temperature influences sex ratios in this species, a recent report has given evidence for a genotype temperature interaction (Saillant et al.,
2002). Thus, breeding fish (both female and male fish), raised at high temperatures
strongly affect the sex ratios of the progenies, by increasing the proportion of females
(Saillant et al., 2002).
Despite the possible effects of temperature on sex differentiation, it is possible that other environmental factors in the fish farm may be influencing the sex ratios. These may include the stocking density, amount of food, confinement and social interactions. Most of these enviromnental parameters elicit stress responses, which are
patent in the elevated cortisol levels in several captive fish species, including in sea
bass. In addition, acute forms of handling stress, such as those associated with the routine hatchery procedures of grading, transportation and artificial stripping, also contribute to the elevation of plasma catecholamines and corticosteroids in captive fish (Pickering, 1981; Barton and Iwama, 1991).
Aim of the study
The underlying hypothesis of this thesis is that in intensive culture, the sea bass
interrenal tissue produces corticosteroids in response to stress, and together with them
an excess of adrenal androgens shifting the normal androgen/ estrogen ratio and thus
leading to gonadal masculinization. In order to test this hypothesis: (1) dexamethasone,
a synthetic glucocorticoid was used to block the Hypothalamus-Pituitary-Interrenal
(HPI) axis production of cortisol and possibly androgens, starting at the period of
highest sensitivity to androgens, until gonads were differentiated; (2) sea bass were
exposed to either confinement or handling stress experiments in order to test if the
elevated cortisol levels are accompanied by the elevation of androgen levels; (3) In
addition, a study was conducted of expression of mRNA for steroidogenic enzymes involved in androgen and estrogen production as well as of steroid receptors covering the period of sex differentiation.
1.1- Sex determination
Fish, amphibians and reptiles, exhibit several mechanisms of sex determination.
No simple gonadal sex determination (GSD) model can be generalized for fish and,
even though some species display simple heterogametic models (XX/XY or ZW/ZZ),
other variations can be found, including male and female heterogamety within the same
species, and hermaphroditic species (Scherer, 1999).
The molecular mechanisms involved in GSD have been intensively studied in
mammals and increasing information is now becoming available for non-mammalian
(birds, reptiles, amphibians, fish) and invertebrates species (e.g. insects, nematodes).
-__ ip, ___ _
-__;-_- - - -I
. nn .
|
Urogonital ' B potential
ii, ;..ri.‹.1s.›.-¬...;- ,. ,.,,
"-,..s,°,¡11.,fl,fl,,ii-W ,,
'I-Im -J III- J ílítr P Ovar; É I* Tostls -. , . 4 |'I|
Figure 1- Molecular events during gonad development and sex induction in mammalians. Effector genes or gene products are shown in black boxes.
A number of genes involved in mammalian gonad development have been identified. As shown in figure 1, these can be roughly sub-divided in three classes based on their order of action. Firstly, the genes required for the formation of the sexually undifferentiated gonad, such as steroidogenic factor-1 (SF1) and Wilms tumor-1 (WT1). Secondly, genes such as the testis- determining factor on the Y chromosome; SRY,
SOX- 9 and possibly Dax-1, which prepare the gonad to differentiate either into male or female. And thirdly, genes that promote male or female differentiation of the gonad once its sex has been determined, including SF1, DMRT-1 and WT1 (Raymond et al.,
Although vertebrates exhibit an array of sex determining mechanisms, and even
though the GSD upstream pathways can diverge among different taxa, it is becoming
apparent that some downstream sex determining genes are functionally similar in
several species. For instance, DMRT-1, a gene involved in testicular differentiation, is
highly conserved both at structural and ftmctional levels, from invertebrates to higher
vertebrates (Raymond et al., 1999; Smith et al., 1999; Raymond et al., 1998; Raymond
et al., 2000; Marchand et al., 2000). This supports the hypothesis that there may be
some degree of functional evolutionary conservation of sex determining genes across
taxa (Ottolenghi and McElreavey, 2000).
In fish, little is known on the molecular mechanisms regulating sex
determination. Nonetheless, it has been hypothesized that sex differentiation is controlled ultimately by specific sex-determining genes (Baroiller et al., 1999). In contrast with other taxa, there is an enormous plasti_city in gonadal development, and interactions between the genome and internal and/or external factors can influence
gonadal differentiation or may even lead to complete sex reversal (Pavlidis et al., 2000).
1.2- Sex differentiation
Like all vertebrates, fish go through a sex-neutral stage during early embryonic development. Prior to sexual differentiation, the ovaries and testes cannot be
distinguished and therefore are called bipotential or undifferentiated gonads. These
bipotential gonads arise from the urogenital ridge, a region that interestingly also contributes cell lineages to the adrenal cortex (the functional equivalent of interrenal or head kidney in fish), kidney and gonads (Parker et al., 1999; Scherer, 1999).
In teleosts, only a single primordial cortex appears to be involved in the ontogeny of both testes and ovaries (Hoar, 1961), but the timing of gonadal development differs among species as shown in Table 1.
Table l- Timing of gonadal development in different fish species. (dph- days post hatching).
Group/Species Age at gonadal differentiation References
Pe rcifo rmes Tiiapia zillii Oreochromis niloticus Dicentrarchus iabrax Salmoniformes Onconrhynchus mykiss Cypriniformes Cyprinus carpio Mugiliformes Mugil cephalus Silu riformes Ictaiurus punctatus
15 dph Yoshikawa & Oguri, 1976
23-26 dph Hines et al., 1999
9 months Blázquez et al., 1998
2-3 months Liu et ai., 2000
2-4 months Davies & Takashima, 1980
7-14 months Chang et ai., 1995
3-4 months Patiño et al., 1996
In some species, however, it is not accurate or even possible to consider a time
scale for gonadal differentiation since it has been shown that sexual differentiation is
more closely related to fish length than to fish age, as shown in Table 2, emphasizing that it is a developmental process.
Table 2- Relative size necessary for gonad differentiation.
Group/Species Length at gonadal References
differentiation _
Atheriniformes
Odontesthes bonariensis 1 1-18 mm Strüssmann et ai., 1997
Myxiniformes Eptatretus stouti
Perciformes
20-33 cm Gorbman, 1990
Cichiasoma citrinetium _ 52 mm Francis and Barlow, 1993
A broad range of literature is available on the control of gonadal sex differentiation in gonochoristic and hermaphroditic (protandric, protogynic and synchronous hermaphroditic) fish species and it is well established that in fish, as in other vertebrates (e.g. reptiles), there is an enviromnental as well as endocrine control of the phenotypic sex of the gonads (Baroiller et al., 1999). Consequently, the genotypic and phenotypic sex in fish may not necessarily coincide.
1.2.1- Environmental sex differentiation
Several environmental factors have been tested for their influence on sex
differentiation in fish as shown in figure 2. From those we can highlight stocking
density and temperature by the fact that fish reared in aquaculture systems are often
subj ected to extremely high stocking densities and extreme temperatures (both high and
low), which usually do not occur in natural conditions.
>tSâ1ifififsff
8 ro f
- pH of the water (til)
- Donsity
(o)
- Temperature (Í)
,
s
aa
,Maze
Figure 2- Environmental factors suggested to influence gonadal differentiation. (a) Badura and Friedman, 1988; Francis and Barlow, 1993; (b) Craig et al., 1996; (c) Abucay et ai., 1999; (d) Römer and Beisenherz, 1996; (e) Baroiller et ai., 1999; (Í) Blázquez et al., 1998.
Among the enviromnental factors involved in sex differentiation, temperature is
the most studied. Thus, rearing temperature has been shown to influence sex
differentiation in several vertebrates such as amphibians (Baroiller et al., 1999), reptiles (Pieau et al., 1999; Pieau et al., 1998; Dorizzi et al., 1996) and fish (Pavlidis et al., 2000; Blázquez et al., 1998; Craig et al., 1996; Abucay et,al., 1999; Strüssmann et al., 1997; Patiño et al., 1996).
In most fish species with therrno labile sex-determination (TSD), interactions
between enviromnental factors and genotype have been strongly suggested. Thermo
sensitivity in fish resembles the case of amphibians in which, genetic sex determination
governs sex differentiation at ambient temperatures, whereas extreme temperatures
(both low and high) strongly affect gonadal sex differentiation (Baroiller et al., 1999;
Strüssmami et al., 1997; Patiño et al., 1996; Craig et al., 1996).
Several studies have suggested a link between sex steroids and the mechanism of
TSD. It has also been suggested that there may be a relationship between the critical
period for response to exogenous sex steroids and the critical period for response to
temperature in fish (Blázquez et al., 1998). Also, administration of steroid hormones, steroid antisera, and steroid antagonists has proven to be successful in disrupting normal gonadal differentiation in TSD species (Smith and Joss, 1994; Merchant- Larios et al., 1997)
Likewise, most studies performed in reptiles point out that temperature exerts its action on the metabolic route(s) that lead to the Synthesis of sex steroids. Thus, it has been suggested that the ratio of estrogens to androgens, or the production of estrogens alone, may be temperature sensitive and may mediate the influence of temperature on
gonadal sex differentiation in TSD species (Smith and Joss, 1994).
Experiments carried out with different models such as reptiles (Pieau et al., 1999; Desvages and Pieau, 1992; Chardard et al., 1995; Rhen and Lang, 1994; Smith and Joss, 1994), birds (Villalpando et al., 2000) and fish (Chang et al., 1999, Cotta et al., 1999; Kwon et al., 1999) have demonstrated the implication of estrogens and the key role played by the enzyme complex that converts androgens to estrogens-cytochrome P450 aromatase- in ovary differentiation during TSD. This hypothesis has gained further support since it has been shown that in most TSD species, the sensitive period in which changes in gonadal aromatase activity can be induced by temperature
shifts corresponds to the thermo sensitive period for gonadal differentiation (Chardard
etaL,1995)
In fish, the effects of other environmental factors such as pH, salinity, density
and social interactions have also been shown to affect gonadal development in different species. An influence of water pH on sex differentiation, either alone or through interactions with temperature, has been reported in a number of species, e. g. Xiphophorous helleri (Rubin, 1985 Copeia), Poecilia melanogaster (Römer and
Beisenherz, 1996) and some species of Apistogramma (cichlids) (Römer and Beisenherz, 1996).
Density and/or social interactions within the fish population have also been
shown to affect the sex ratio in several species, e.g. Cichlasoma citrinellum (Francis and
Barlow, 1993); Anthias squamipinnis (Fishelson, 1970); Labroides dimidiatus (Shapiro,
1980); Gonostoma bathyphylum (Badcock, 1986) and Betta splendens (Badura and Friedman, 1988).
1.2.2- Endocrine sex differentiation
The levels of endogenous sex steroids change during embryonic and early
development of teleosts (Hines et al., 1999). Generally, developing embryos exhibit
relatively high levels of sex steroids just after fertilization, which decline during fry
emergence (Khan et al., 1997; Chang et al., 1995). This suggests that the temporal
change in steroid levels during development reflect initial metabolic processing of
maternal steroids by embryos. Furthermore, it has been shown that in teleost species,
embryos have the capability of conjugating steroids, thus providing a means of
elimination of some compounds (Iwata et al., 1994; Stouthart et al., 1998).
Early exposure of embryos or larvae to estrogens or androgens has proven
effective in manipulating the phenotypic gender of the gonads (Patiño et al., 1996; Kime, 1978; Gilling et al., 1996; Blázquez et al., 1999; Chatain et al., 1999). Such studies indicate that steroid hormone production is not only essential for the normal
expression of gender, but also that the early embryos of fish appear to have the ability to
synthesize and metabolise steroids. In fact, the presence of steroid synthesizing enzymes
has been demonstrated during early life stages of several fish species, namely in guppy (Poecilia reticulata) and in rainbow trout (Oncorhynchus mykiss) (Yeoh et al., 1996;
Feist and Schreck, 1996).
It has been hypothesized that gonadal sex is determined by the local androgen to
estrogen ratios with relatively higher or lower ratios yielding testicular or ovarian
development, respectively (Hines et al., 1999). Considering this hypothesis, a more or
less clear sexual dimorphism of plasma profiles of sex steroids around the period of
sexual differentiation would be expected. There are only a few reports of the profiles of
sex steroids during the period of sexual differentiation in fish, but it is evident that there
niloticus) (Nakamura and Nagahama, 1989) and coho salmon (Onconrhyncus Kisutch)
(Feist et al., 1990), the levels of either testosterone or testosterone plus
11-ketotestosterone, respectively, reflect the process of sexual differentiation. In contrast,
in the grey mullet (M cephalus), no clear sexual dimorphism of plasma profiles in
testosterone or estradiol was found during the period of sexual differentiation (Chang et
aL,1995)
Assuming that steroid hormones are critical for directing initial sex
differentiation, steroid-producing cells should be apparent prior to morphological
differentiation of the gonad. One possibility is that the adrenal gland can function as the
principal site of steroid biosynthesis during sexual differentiation, long before gonad
differentiation. This is clear in several reptile species such as the tropical lizard Caiotes
versicolor, the sea turtle Lepidochelys olivacea, T. scripta and Crocodylus porosus (Doddamani, 2000). In fish, however, there is no individualized adrenal gland, but
homologous functions are carried out by a specialized tissue- the interrenal or head
kidney. Several reports have shown that fish interrenal tissue is able to synthesize
several steroids, which are typically secreted in the gonadal tissue. In fact, in some fish
(e. g. African catfish Clarias gariepinus), most steroids usually synthesized in the testes
are still detected in blood plasma after castration, as they can also be synthesized in the
interrenal and other tissues (Vermeulen et al., 1995).
Furthermore, in several fish larvae such as tilapia Oreochromis niloticus (Hines et al., 1999), and rainbow trout Onchorhynchus mykiss (Susuki et al., 1997), the hypothalamus-pituitary-interrenal axis (HPI) is already functional at early stages,
consistent with the hypothesis that a steroid biosynthetic capacity precedes gonadal
differentiation.
Several reports have established a relationship between hormones of the HPI axis (which are released during stress) and the hypothalamic- pituitary- gonadal (HPG) axis (Rivier and Rivest, 1991; Pickering et al., 1987; Huang et al., 1999; Teitsma et al., 1998; Carragher and Sumpter, 1990; Pankhurst et al., 2000). At the level of the gonads, adrenal corticoids, pro-opiomelanocortin (POMC)-like peptides, and
corticotropin-releasing factor (CRF) are reported to interfere with the stimulatory action of
gonadotropins on sex steroid-producing cells and thus alter the reproductive function.
However, despite the well-established relationship between the HPI and HPG axis in
fish, little is known on the influence of adrenal steroids on sex differentiation in
In humans, several cases of sexual ambiguity have been reported due to
malfunction of the adrenals. An example is the Congenital Adrenal Hyperplasia (CAH)
syndrome. CAH is a form of adrenal insufficiency in which the enzymes involved in the
production of adrenal corticosteroid hormones, is deficient: because cortisol production
is blocked, the adrenal gland overproduces androgens, which lead to the virilization of
female foetuses (Forest and David, 1992). This syndrome results from deficiencies of
the enzymes 21- hydroxylase (Forest and David, 1992; Schawab et al., 2001), 11- beta
hydroxylase (Bouchard et al., 1989) or 315-HSD (Pang, 2001).
In rats, cortisol administration during pregnancy induced a shift of the
differentiation of the foetus female genital tract into the male direction (Roland et al. (1977). In fish, however, few studies have shown effects of adrenal steroids in the process of sex differentiation. High dosage treatments of rainbow trout with
cyanoketone (a 313-HSD inhibitor) resulted in a significant shift of the sex ratios towards
the male differentiation. This inhibitor also increased the 313 -HSD activity in the
interrenal tissue, but not in the gonads, suggesting that stimulated steroidogenesis in the interrenal tissue, could lead to dramatical changes in the sex ratios (van den Hurk and van Oordt, 1985).
In vitro experiments, namely in rainbow trout Onconrhyncus mykiss, Esox iucius
and perch Perca fluviatilis have shown that adrenal corticosteroids can be metabolised
by 1115-HSD into 1115- hydroxyandrostenedione and 1113- ketoandrostenedione, which
are known to be potent masculinizing steroids (Goswami et ai., 1985; Kime, 1978). Furthermore, administration of cortisol and cortisone to rainbow trout fry has been
shown to skew the sex ratio in favour of males, which suggested that the two
corticosteroids could have been converted into 11-oxygenated androgens (Schulz,
1986). It has been hypothesized that 11-oxygenated androstenedione derivatives which are present in large amounts within the free steroid metabolites produced by newly hatched larvae in several fish species, e.g. Artic Charr (Khan et al., 1997), catfish Clarias gariepinus (Khan et al., 1997) and Asian sea bass (Lates calcarzfer) (Guigen et al., 1995), are involved in sustaining the differentiation and early development of the
testis in fish (Baroiller et al., 1999). This could be a possible pathway through which
adrenal corticosteroids may influence sex differentiation.
»
1.3- Interrenal tissue
Several experimental approaches over the last decades have established that the
pituitary hormone adrenocorticotrophin (ACTH) is the principal regulator of the
interrenal tissue (Bradford et al., 1992). ACTH is not only responsible for maintaining
interrenal homeostasis in adult animals (acting as a growth factor and preserving the
differentiated state of the interrenal) and promoting interrenal development in larvae but
it is also involved in increasing the levels of precursors for steroid synthesis and the
synthesis and activation of enzymes leading to the formation of steroid hormone
molecules namely mineralocorticoids, glucocorticoids and androgens (Bülow et al.,
1996)
Steroid
hormones
are
synthesized
from
precursor
steroid-cholesterol.
Presumably, all tissues have some capacity for cholesterol synthesis, although most of the circulating cholesterol is synthesized in the liver. Adrenocortical tissue can synthesize cholesterol, and can also take it up from the blood when circulating levels are sufficiently high (Gorbman et al., 1983).
In most steroidogenic tissues cholesterol that is not directly required for
hormone production is stored within the cell under the form of cholesteryl esters. When
a high demand for steroid hormones occurs, cholesteryl esters are cleaved to yield free cholesterol, stimulating the synthesis of steroid hormones either by making substrate available to the steroidogenic enzymes in the cell, or by increasing the transcription of several key cAMP- responsive genes that encode steroidogenic enzymes (Feige et al.,
1998)
There is considerable information available concerning the properties of
enzymes involved in the synthesis of corticosteroids, androgens and estrogens. Most of
the enzymes involved in this process belong to the family of mixed-function oxygenases known as cytochrome P450 (Bülow et al., 1996).
1.3.1. - Corticosteroids
Two
types
of
corticosteroids,
mineralocorticoids
(aldosterone)
and
glucocorticoids (cortisol, corticosterone) are produced by the adrenal cortex/ interrenal
from lungfish and amphibians to mammals (figure 3). Tissue effects of glucocorticoids
are mediated by the type II corticosteroid receptor- also termed the glucocorticoid receptor (GR)-, and in addition, by the mineralocorticoid receptor (MR). Cortisol has
significant affinity for both receptors, while aldosterone clearly possesses higher affinity
for MR (Ray, 1996).
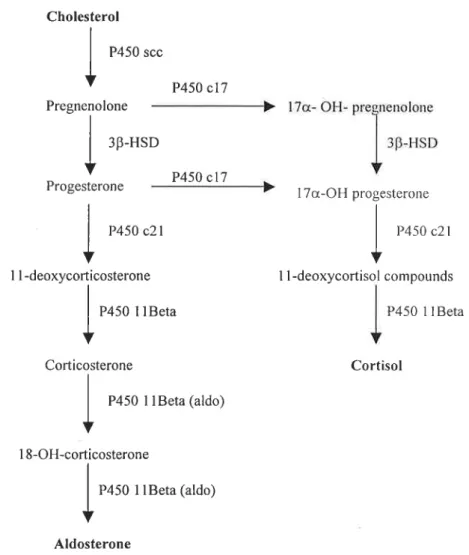
P450 (1113) (1113-hydroxylase) or CYP1 IB (according to accepted nomenclature
proposed by Nelson et al., 1993) catalyses the final steps of corticosteroid biosynthesis: from 11-deoxycorticosterone (DOC) to aldosterone or 11-deoxycortisol to cortisol, respectively (Jiang et al., 1998).
Cholesterol P450 scc
P450 017
Pf€gI1€fl0l0I1€ P* l7r1- OH- prosniorioloiio
313-I-ISD 311-I-[SD
Pro esteroneg P450 Cl? -Ir- l7ot-OH progesterone
P450 c2l P450 c2l
1 1-deoxycorticosterone 1 1-deoxycortisol compounds
P450 11Beta P450 1 1 Beta Corticosterone Cortisol P450 11Beta (aldo) 18-OH-corticosterone P450 1lBeta (aldo) Aldosterone
Figure 3- Schematic representation of the main pathways for corticosteroid biosynthesis (adapted
Previous studies have shown that in several species including htunan (Fisher et al., 2000), mouse (Domalik et al., 1991), rat (Mukai et al., 1993), and hamster (LeHoux
et al., 1994), two distinct isoforms of the CYP11B subfamily exist, namely CYP11B1
(P450 1113-hydroxylase) and CYP11B2 (Aldosterone synthase or AS). In bovines
(Ogishima et al., 1989), ovines (Sun et al., 1995; Anwar et al., 1998), bullfrog (Nonaka
et al., 1995) and Guinea pig (Büllow et al., 1996), only one type of enzyme could be
detected (P450 1113-hydroxylase, AS or CYP1 1B0) which has the activity of both
knoxni isozymes. In rat, in addition to these two isozymes, a third form CYP11B3 is
also present (Mellon et al., 1995).
Although some earlier studies reported that small amounts of aldosterone could be detected in the interrenal of some teleosts such as the lungfish, Fundulus, the coelacanth Latimeria and in sockeye Salmon blood (Chester Jones et al., 1969; Barrington, 1963), still no conclusive data has been shown for aldosterone synthesis in teleost fish.
Moreover, the CYP 1113 (1113-hydroxylase) gene has been cloned in eel Anguilla
japonica (Jiang et al., 1998), in zebra fish Danio rerio (GenBank accession number
BG73 8320), and in rainbow trout Oncorhynchus mykiss (Kusakabel et al., 2000), but so far none of these genes present any evidence of AS activity.
1.3.2- Androgens
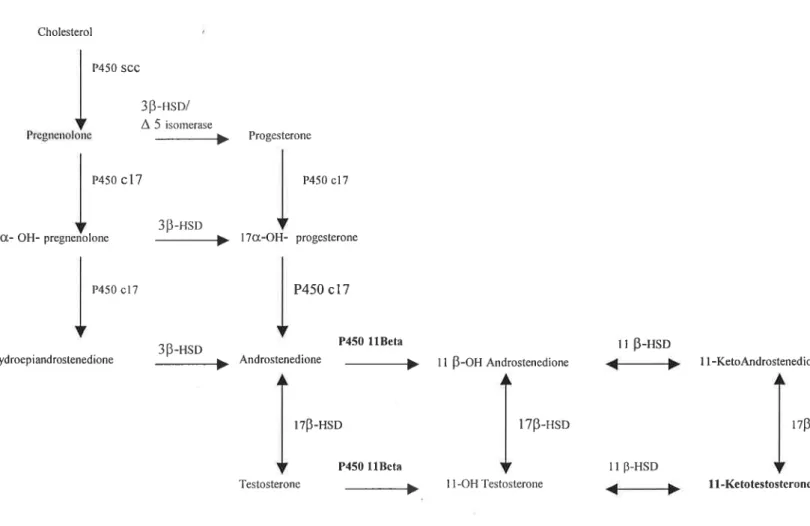
11-Ketotestosterone is a fish specific androgen implicated in male sexual
differentiation and development (Takeo et ai., 1999). The enzyme P450
1113-hydroxylase is not only involved in corticosteroid biosynthesis, as it is also involved in the synthesis of 11-ketotestosterone in fish gonads and interrenal tissue. 11-Ketotestosterone is synthesized from testosterone by the actions of two enzymes, P450
1113-hydroxylase and 1113-hydroxysteroid dehydrogenase (1113-HSD) (Jiang et al., 1996) (figure 4). The androgen receptor (AR) mediates most actions of
11-ketotestosterone (Todo et al., 1999). So far, two different isoforms of AR (ARot and
AR13) have been identified in fish, namely in red sea bream Pagrus major (Touhata et
al., 1999), rainbow trout Onchonrhyncus mykiss (Takeo and Yamashita, 1999), kelp bass Paralabrax ciathratus (Sperry and Thomas, 1999), Atlantic croaker
Micropogonias undulatus (Sperry and Thomas, 1999) and in eel Anguilla japonica (Ikeuchi et al., 1999; Todo et al., 1999).
Cholesterol P450 SCC 3B-HsD/ A 5 isomerase Ilrügrlultrllllllu __í› Progesterone P450 (317 P450 017 313-HSD
Ot- OH- pregnenolone M l70t-OH- progcsterone
P450 cl? P450 c17
3B_HSD P450 11Beta 11 B-HSD
ydroepiandrostenedione íí› Androstenedione M 11 5-011 And¡0S¡cned¡one *Mp 11-K¢t0Andm5ten¢d¡0m
1713-Hsn 1713-Hso 1715-1
P450 1lBcta ll 13-HSD
Testosterone › 1 1 -OH Testosterone 1 i 11-Ke totestosteronc
Figure 4- Schematic representation of the main pathways for androgens biosynthesis (adapted from Nagahama, 1999).
1.3.3- Estrogen
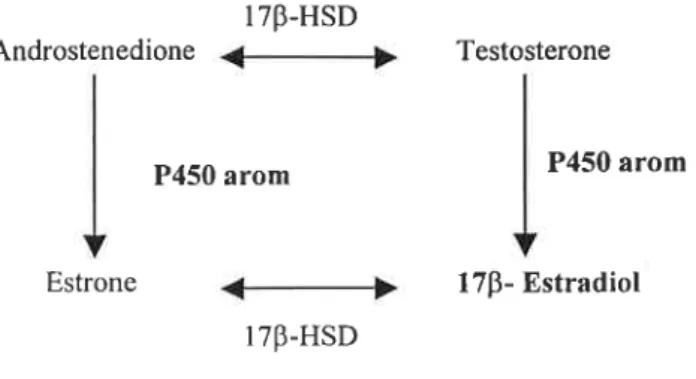
Aromatase cytochrome P450 (P450arom or CYP19) is the catalytic component
of the aromatase complex responsible for the synthesis of estrogens from androgens. In
fish it is responsible for the conversion of testosterone to 1713- Estradiol (Corbin et al.,
1999) and therefore plays a unique role in maintaining a physiological balance between
androgens and estrogens, which is critical for gonadal development and function in vertebrates (Trant, 1994).
1 713-H SD
Androstenedione gi; Testosterone
P450 amm P450 arom
Estrone qiíp 1713- Estradiol
1713-HSD
Figure 5- Schematic representation of 1713- Estradiol biosynthesis, the major estrogen in fish.
The aromatase gene has been isolated in several fish species such as tilapia Oreochromis niloticus (Kwon et al., 2001; Chang et ai., 1997), Atlantic stingray Dasyatis Sabina (Ijiri et al., 2000), medaka Oryzias latipes (Fukada et al., 1996), rainbow trout Onchonrhyncus mykiss (Tanaka et al., 1992), zebra fish Danio rerio (Kishida and Callard, 2001), Atlantic croaker Micropogonias undulatus (Corbin et al.,
1999), goldfish Carassius auratus (Callard and Tchoudakova, 1997; Tchoudakova and
Callard, 1998), Japanese flounder Paralichthys olivaceus (Kitano et al., 1999) and sea bass Dicentrarchus labrax (GenBank accession number AJ311177).
In both males and females, estrogen programes and coordinates developmental, physiological, and behavioral responses essential for reproduction (Ando et al., 2000; Tchoudakova and Callard, 1998). It is well established that many of the effects of estrogens are mediated by classical nuclear receptors- estrogen receptors (ER), which can bind estrogen and act as transcription factors (Kishida and Callard, 2001 ; Andrews etaL,1997)
So far, three distinct ER subtypes (termed ERot, ER13 and ERy) have been
identified in fish, sea bream Sparus aurata (Socorro et al., 2000), rainbow trout Onchonrhyncus mykiss (Pakdel et al., 2000), channel catfish Ictalurus punctatus (Xia et al., 1999; Xia et al., 2000; Patiño et ai., 2000), Atlantic croaker Micropogonias
II- MATERIAL AND METHODS
Experiment I: Preliminary examination of the effect of dexamethasone on plasma levels ofcortisol and androgens.
Twenty sexually immature sea bass (1 year old) were distributed in two 5 0-liter
tanks (density: 9 Kg/m`3) with constant temperature (18°C), salinity (3 7%0) and aeration.
After one week of acclimation, the normal daily ration (commercial dry pellets,
Provimi) at the rate of 1% body wt day`l was replaced by a control meal or an
experimental meal fed at the same rate. The pellets were prepared either by spraying
food with ethanol (control) or with dexamethasone dissolved in ethanol and allowing
the ethanol to evaporate overnight at room temperature. The fish in one tank were given a control meal, and the fish in the other tank received pellets with a 150 mg Kg _' dexamethasone (Dex). After one week of treatment, fish Were allowed to recover for two weeks by feeding them with the normal daily ration of untreated pellets. Fish were sampled at the begimiing of the experiment (no treatment had been administered), after one week of treatment and after one and two Weeks upon treatment removal. On sampling, fish were captured, anaesthetized with phenoxyethanol (1:10000, Sigma) and
blood was collected from the caudal vessels. Blood was immediately centrifuged (7
minutes at 13000 rpm), aliquoted, frozen in liquid nitrogen and stored at -20°C, until
assayed for cortisol and androgens (see below).
Experiment H: Efièct of dexamethasone administration on the sex ratios of sea bass populations
Sea bass larvae 80 days-post-hatching were obtained from a fish farm (TIMAR,
Peniche). Fish larvae were acclimated in 200-L tanks in a closed seawater system, equipped with biological and mechanical filters. Fish were fed twice a day with commercial food (PROVIMI) at the rate of 1-2% body Wt day`l. At the age of 100 days-post-hatching, 1500 larvae were distributed in six 1000-L tanks (250 larvae per tank) with constant aeration and natural ambient temperature and salinity. Four tanks were
given dexamethasone treated food (two tanks with 75 mg Kg`l and two tanks with 150
meal. These concentrations of dexamethasone were chosen because with the previous
experiment 150 mg Kg 71 blocked cortisol production. VVhen the fish reached 10 months
of age 50 fish from each tank were anaesthetized, sacrificed and the gonads were
removed for histological determination of the gonadal sex.
Experiment III: Ejfiact ofconfinement and handling stress on hormone levels.
For the following experiments 2.5-year sea bass were used (mean weight 120g).
Confinement stress
Twenty sea bass were divided evenly between two 500-L tanks, ten fish per
tank. After one week of acclimation, the water level in one of the tanks was reduced to
half, increasing the stocking density (density: 8 Kg m`3). Fish were exposed to this type
of stress for 16 hours, after which they were netted, anaesthetized and blood was
collected. Blood samples were treated as described above and each sample was assayed
for cortisol, testosterone and 11-ketotestosterone.
Handling stress
Twenty fish from the stock population were distributed in two 1000-Liter tanks.
After one week of acclimation, the fish from one tank were subjected to a handling
stress. The handling stress consisted of submitting the fish to manipulation of the tank with a hand net, throughout six hours. After six hours of stress, fish were netted, anaesthetized and blood was collected. Blood samples were treated as previously
Experiment IV: Eflect of confinement and handling stress in sea bass treated with dexamethasone.
For the following experiments 2.5-year sea bass were used (mean weight 110g).
Confinement stress
The same confinement experiment, as previously described, was repeated but
this time in one of the tanks, fish were given ethanol treated food, and the fish, which
were subjected to confinement stress, were given dexamethasone treated food (150 mg
Kg `l). Sampling procedure was as described for experiment III and each sample was
also assayed for cortisol, testosterone and 11-ketotestosterone.
Handling stress
The same handling experiment, as previously described, was repeated with some
alterations. In one tank, fish were fed with ethanol treated food and the fish which were
subjected to handling stress, were given dexamethasone treated food (150 mg Kg `l).
Sampling procedures were as previously described and the blood samples were assayed
for cortisol, testosterone and 11-ketotestosterone.
2.1- Histology
At the end of experiment II, fish were sampled (50 fish per group) and the sex of each individual was determined by histological analysis. On sampling, fish Were
anaesthetized (1:10000 phenoxyethanol, Sigma), killed and gonads were dissected and
fixed in Bouin°s solution (Sigma) for 24 hours. The tissues were dehydrated in grade
alcohol series, paraffin embedded and cross-sectioned (5-7um). The cross-sections were
stained with Erlich°s hematoxilin-eosine and observed at the microscope. Gonads Were scored as testis when they exclusively contained predominantly undifferentiated tissue with a few scattered germ cells and as ovaries When they presented groups of germ cells With solitary oocytes. Gonads that only presented undifferentiated tissue with no typical features as in testis or ovaries were classified as undifferentiated. All gonads that
presented all the characteristics of the testis but also presented scattered oocytes were
2.2- Steroid assays
For steroids radioimmunoassay (RIA), aliquots (I00ul) of plasma were
denatured with (900ul) gelatine buffer at 80°C for one hour. For cortisol, the denatured
plasma was diluted to 1:50 and 100ul of this dilution was used in the radioimmunoassay
as described in (Condeça, 2001). The samples were counted under standard 3H
conditions, using a Beckman L60000IC Scintillation counter (Beckman Instruments
Inc., Fullerton, USA). Testosterone and 11-ketotestosterone assays were performed
using the same procedure described for cortisol assays (Condeça, 2001), with the
exception that the plasma samples were not diluted prior to assay.
2.3- RNA lsolation
Total RNA from Dicentrarchus labrax tissues and whole individual larvae at
different developmental stages was extracted using TRI reagent (Sigma), based in the
acid guanidinium thiocyanate-phenol-chloroform method by Chomczynski and Sacchi
(1987). The isolated RNA was subsequently run in a 1.0% agarose gel stained with EtBr
(0.5 ug ml 71) to verify its integrity and quantity.
2.4- Amplification ofpartial genes by RT-PCR
Complementary DNA was synthesised from 2-4 ug of total RNA by reverse
transcription in 40ul at 37°C for 2 h using 50 U of M-MLV Reverse Transcriptase
(Gibco BRL), 4ul 5x Buffer (Gibco, BRL), 0.25mM of each' dNTP, 20uM oligodT
primer, 2.5mM DTT and 5 U of RNA Guard (Gibco, BRL). Twenty-five microliters
PCR reactions were performed with 2-4ul of RT reaction in the presence of 0.5U of Taq
Polymerase (Promega), 5ul 10x Buffer (Promega), 0.12 mM of each dNTP, 0.5pmol of
forward and reverse primers and variable concentrations of MgCl2 which varied
according to the primers used for each target gene (see table 1). After PCR, the reaction
products were analysed on 1% agarose Agel and stained with EtBr (0.5 ug ml `1).
forward and reverse primers and variable concentrations of MgCl2 which varied
according to the primers used for each target gene (see table 1). After PCR, the reaction
products were analysed on 1% agarose gel and stained with EtBr (0.5 ug ml `1).
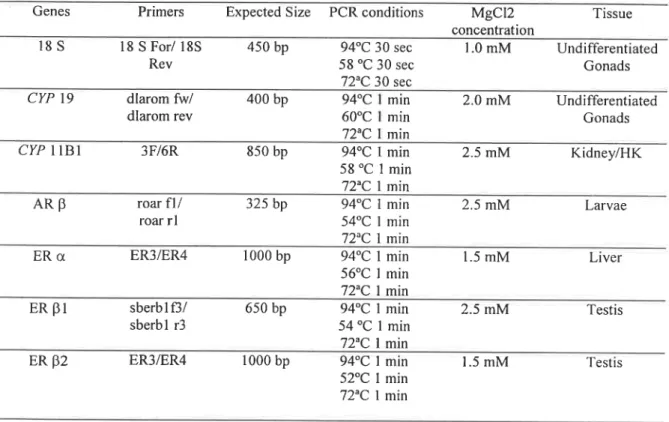
Table 1: Conditions for PCR amplification of target genes.
Genes Primers Expected Size PCR conditions MgCl2 Tissue
concentration
issi
18 S For/ 18S Rev450 bp
94°C 30 sec 58 °C 30 sec 72°C 30 sec 1.0 mM Undifferentiated Gonads CYP 19 dlarom fw/ dlarom rev 400 bp 94°C 1 min 60°C 1 min 72°C I min 2.0 mM Undifferentiated Gonads CYP l1B1 3F/6R350 bp
94°C 1 min 58 °C 1 min 72°C I min 2.5 mM Kidney/I-[KAne
roar fl/ roar rl325 bp
94°C 1 min 54°C Í min 72°C l min 2.5 mM LarvaeERot ER3/ER4
1000 bp
94°C I min56°C I min 72°C I min 1.5 mM Liver
ERB1
sberb 1 f3/ sberbl r3650 bp
94°C Í min 54 °C Í min 72°C 1 min 2.5 mM TestisER 52
ER3/ER41000 bp
94°C 1 min 1.5 mM Testis52°C 1 min 72°C 1 min
2.5- Cloning and sequencing
PCR products with the expected size were excised from the agarose gel, and eluted from the agarose using a commercial kit (GFXTM PCR DNA and Gel band
purification kit, Amersham Pharmacia), according to the manufacturer°s instructions.
The DNA fragments isolated were inserted into the pGem T-easy plasmid (Promega)
vector and subsequently used to transform Escherichia coli XL-1Blue strain
(Stratagene) using a standard method by Inoue et al. (1990). The transformed bacteria
were then plated in Lb-Agar (Sigma) supplemented with 50ug/ml ampicilin (Sigma),
0.05M IPTG (Sigma) and 80ug/ml X-Gal (Sigma). The plates were incubated overnight
at 37°C and the clones with the insert of the correct size were selected by PCR colony
screening. For PCR colony screening, white colonies were transferred into 200 ul
Lb-Broth medium (Sigma) supplemented with 50ug/ml ampicilin and incubated at 37°C for
a. 'L Tqf. ..,_-r ¡-':.i_'-_,,'-r_|. '1 ¬.._-_;. hi +;â¿' ¬_:¡; '-_ nf 11'; F I '||I| -. . ¬ I-'-' .I *'-~5.'-._- . |. .-. '|
2 hours. Two microliters of grown cultures were used in 25 ul PCR reactions using 0.5U
of Taq Polymerase (Promega), 2.5 ul 10x Buffer (Promega), 0.12 mM of each dNTP, 0.5
pmol of T7 and SP6 primers and 2mM MgCl2. The PCR conditions used were 30” at
95°C, 30” at 50°C and 45” at 72°C, for 25 cycles. The colonies with inserts of the
correct size were then transferred to Sml Lb-Broth medium supplemented with 50ug/ml
ampicilin and incubated at 37°C ovemight. The plasmids were recovered using the
alkaline lysis method (Sambrook et al., 1989) and subsequently sequenced in an
automated sequencer (ABI 373A) with Thermo Sequenase TM Dye terminator cycle Sequencing Pre-Mix Kit (Amersham Pharmacia). The obtained sequences were compared to GenBank database at NCBI to determine the similarity with other known genes.
2.6- SEMI-QUANTITA TIVE PCR
2.6.1- PCR Optimisation
Sea bass larvae total RNA extraction and cDNA synthesis was prepared as previously described with the exception of the primer used in the reverse transcription,
which was done with 4ug of random hexamers (pdN (6), MWG- Biotech AG) in order
to use the 18S as an internal control. Specific primers for the genes CYP11B1, CYP19,
AR13, ERot, ER131, ER132 and l8S were designed and PCR conditions were optimized
(see table 2). For each gene, the Specific primers were optimised in order to obtain a
single product and the linear range for the PCR reaction was determined. To determine
the linear range, a 60ul PCR reaction was set-up for each gene, 5ul aliquots were
removed every two cycles, starting in cycle 16 until cycle 35 and subsequently resolved
by electrophoresis on 1% agarose gel stained with EtBr (0.5 ug ml "l). The products
Were quantified with the program ImageMaster ID Primer (Pharmacia Biotech) and
cycle numbers were plotted against log of the signal. Once the linear range was
established, a cycle number in the middle of the linear range of the plot was chosen in order to perform semi quantitative PCR.
Genes Primers Expected Size PCR conditions MgCl2 concentration Cycles
pdN (6)
CYP 19 dlaromforll dlarom revl 450 bp 94°C 5 8°C 72°C 1 min 1 min 1 min2.5 miví
22 CYP llB1 ro1lblor/ rollblrev290 bp
94°C 48°C 72°C Ã min 1 min _ min7
2mM
26Ants
roar fl/ roar rl300 bp
94°C 5 8 °C 72°C  min  min Í min 2.5 mM 26 ERot roera fl/ roera rl550 bp
94°C 60°C 72°C 4 u 0 [T1111 _ l'l'1llT _ 1T11l'1 1.5 mM 35ER151
sberb1f`3/ sberbl r3650 bp
94°C 58°C 72°C  min I min  min 2 mM 35Enbz
roerb2 fl/ roerb2 rl200 bp
94°C 48°C 72°C Â min _ mm 1 min 2.5 mM 35 l8S 18S for/ 18S rev 450 bp 94°C 60°C 4 u 1 mm l min lmM 18 _ 72°C Í min _2.6.2- RT-PCR Southern Blot analysis
PCR reactions were performed with the optimised conditions (see table 2) and
subsequently run in 1% agarose gel stained with EtBr (0.5 ug ml "). After
electrophoresis, the gel was denatured in a 1.5M NaCl/ 0.5M NaOH solution for 30
minutes, washed briefly in distilled water and neutralized in a 1.5M NaCl/ IM Tris-HCl
solution for 30 minutes. After neutralisation, the gel was washed with 6X SSC and the
DNA samples Were transferred into a Hybond- N Nylon membrane (Amersham Pharmacia) by a capillary method (Sambrook et al., 1989). The membrane was cross-linked with UV radiation and the membrane was pre-hybridised at 58°C for 2 hours in Church-Gilbert buffer. Hybridisation was carried out overnight in Church-Gilbert buffer
with the respective probe labelled with o‹.32P-dCTP and RediPrime It II Random Primer
labelling kit (Statagene), according to the manufacturer°s instructions. The blots were then washed twice with 2X SCC/ 0.1%SDS at RT for 10 minutes, twice with IX SSC/ 0.1%SDS at 58°C for 20 minutes and twice with 0.1X SSC/ 01% SDS at 65°C for 30
minutes. The membrane signals were quantified by phosphoimaging and expressed as
the ratio of amplified target over arnplification of 18 S ribosomal RNA.
2.7- Statistical analysis
Results are presented as mean i SEM. The effect of dexamethasone treatment on
weight, length, condition factor, gonad differentiation and the effect of stress on steroid
levels was tested by two-Way Analysis of Variance (ANOVA) followed by Tuckey°s
Honestly Significant Difference test. Correlation between steroid levels was assessed
using the Pearson product moment correlation. Analysis of covariance (ANCOVA) was
used to assess whether the effect of dexamethasone on the condition factor was due to
its influence on the weight or length of the fish. Before the analysis, the data was log
(weight, length, and concentrations) or inverse sine (condition factor) transformed. Plots
in figures are based on untransformed data. Correlation between the expressions of the
different genes was assessed using the Pearson Product Moment Correlation. Statistical
significance was considered at the 5% level.
III- RESULTS
3.1- Preliminary examination of the efifect ofdexamethasone on plasma levels of cortisol and androgens.
800 -.
*
.L
600 -I'-"\ ng/m 400 - 1 ** -nz* Conso \.._,../ 200 -T O Iíríl Il 1.O days 7 days 15 days 21 days
Pfe'l"ealme“l Dexamethasone Post treatment treatment
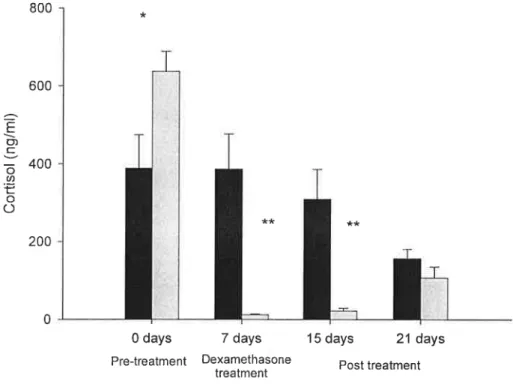
Figure 6- Dexamethasone suppression test. Black bars- control fish (n=l0); Grey bars- fish treated with dexamethasone (n=10). Pre treatment- fish fed with ethanol treated food; Dexamethasone
treatment- fish fed with dexamethasone at a dose of 150 mg Kg* food for one week after which they were
sampled; Post treatment- Fish were sampled one week and two weeks after treatment removal. Significant differences between treatment groups are marked with * if the value of p= 0.03 and with ** if p< 0.001.
At the beginning of the experiment, the mean cortisol levels were in the range of 388.6- 636.9 ng ml`l in control groups, although throughout the experiment, the levels
of cortisol were significantly (p< 0.03) reduced (156.8 ng ml`l) (fig.6). Dexamethasone
at a dose of 150 mg Kg`l food had a significant (p<0.001) suppressive effect on the
plasma cortisol levels (12.13 ng ml") after one week of steroid treatment. One week
post-treatment the suppressive effect of dexamethasone was still present (p<0.001) and
removal (fig.6). The levels of both testosterone and ll-ketotestosterone were below the
detection limit of the assay.
3.2- Effect of dexamethasone administration on the sex ratios of sea bass populations. ¡ % Male gonads 1:] % Female gonads 100 T % Intersexes 1:1 % Undifferentiated
8° `
N= 43
N=47
N=22
N=47
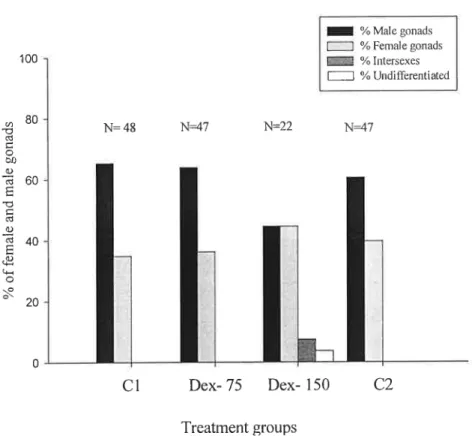
andmaegonads O) CJ Çlifl p||II_I _ ii-of femae -láC7 % I'\) O U - 1 |` E ' ~|~ _ Cl Dex- 75 Dex- 150 C2 Treatment groupsFigure 7- The effect of dexamethasone administration on the sex ratios of sea bass. Cl and
C2-l
control fish fed with ethanol treated food; Dex-75- fish treated with 75 mg Kg' food of dexamethasone;
1
Dex-150- fish treated with 150 mg Kg` food of dexamethasone.
Control groups had between 60-65% of males and 35-40% females; Dex-75 group presented 64% males and 36% of females and the Dex-150 group presented 44% males and 44% of males (figure 7).
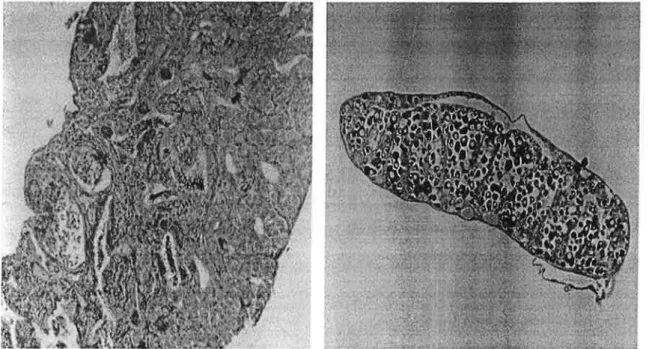
When gonads were examined at I0 months of age, all fish from the control groups and those treated with the lowest dose of dexamethasone (75 mg Kg`l food) presented fully differentiated gonads either into testis (figure 8.a) or ovaries (figure 8.b). 4 % of the fish treated with the highest dose of dexamethasone (150 mg Kg 'I food) were undifferentiated (figure 8.c) and 7% had ovotestes (figure 8.d).
a) b)
._.¬:--;'..a
-I . ..._ ''._ _., . in. .. . ' ___.i __ . ¡-p .'f'-"E_H-r.'__À ._ ¬I--'|_'I__`¬L ¬.1 'I-|-| 4-1-l Êfiiv-a.-. 11 ,r -|" -I iIl . Í.-=;Í*...IÍ+1 L0)
fi)
Figure 8- Histological cross sections (8 um) of gonads from experiment II at 10 months of age. a) gonad showing a developed testis; b) gonad showing a developed ovary; c) gonad showing testicular tissue with 5 intra scattered oocytes; d) undifferentiated gonad.
Since no significant differences in weight, length and condition factor could be seen between the two control groups, the data were pooled for subsequent analysis. In both control and Dex-75 groups, female fish were heavier (p<0.00l and p=0.011,
respectively) (figure 9.a) and larger (p<0.001 and p=0.011, respectively) than male fish
(figures 9.b). Female and male fish treated with the highest dose of dexamethasone did
not present any significant differences in weight or length.
3 _ Females 1:1 Males n=94 n=47 n=22 l 50 - H '
T
40T _
;_\ ._T_., 30 - .E 8 Weght Ivä 20-10-f 0 +4- r-_--1- ._-í C Dex-75 Dex-150 Experimental groupb
_ Fem ales Males n=94 n=47 n=22 az* az 18 -16 - Í-. 14 -I 'i-' -T--12 -~(Cm)
1 0 l Length 8. 5. 4.. 2-f O -M C Dex-75 Dex-150 Experimental groupFigure 9- Fish weight (a) and length (b) at the end of the experiment II. C- control fish; Dex-75-fish treated with 75 mg Kg" food dexamethasone; Dex-l50- Dex-75-fish treated with 150 mg Kg* food dexamethasone. Significant differences in weight and length between female and male fish in each group
are marked with * if p= 0,011 and ** if p< 0,001.
There were no significant differences in condition factor between females and males within the same group. However, females from the control group had a significantly higher condition factor than fish treated with the lowest dose of dexamethasone (P = <0.001) or with the highest dose (P = <0.001) (figure 10). Similarly, male fish from the control group also had a significantly higher condition factor than males treated with the lowest (P = <0.001) and the highest (P = 0.001) dose of dexamethasone (figure 10).
À Females [III] Nunes 2"| i n=94 n=47 n=22
Conditionfactor(k)
M1 1 -I04
'
C Dex-75 Dex-1 50 Experimental groupsFigure 10- Condition factor at the end of experiment II: C- control fish; Dex-75- fish treated with 75 mg Kg" dexamethasone; Dex-l50- fish treated with 150 mg Kg`l dexamethasone. Condition factor was calculated according to the formula: K= [(W/L3) x l00]. Significant differences in condition factor in each group in comparison to the control are marked with ** if p< 0,001.
3.3- Ejfect of confinement stress on hormone levels
After 24 hours of confinement, there were no alterations in cortisol levels or in
testosterone (figure 11). The levels of 11-ketotestosterone in most fish were below the
__ n=I0 10
25°
,Flo
11-10
0.5-
'F
mes/ml)
ë
(ng/m)e .O.DEi
ã
-1-¬
Cortisol (nàs
'š
Testosteron
.O.CJ5%
õ*
5
~a¬.
O- - -.~ ' - 1 qm 1 l -_ ,__ .C(I'l1'0l CUIÊIBTHÍ C(l1l1Ul Cbnfin€lTflÍ
Figure 11- Cortisol and testosterone levels in sea bass blood plasma after 24 hours of confinement.
3.4- Effect ofhandling stress in sea bass.
Handling stress caused a highly significant (p<0.00l) elevation of blood cortisol
levels, and no alterations could be detected on plasma testosterone levels (figure 12).
The levels of 11-ketotestosterone in most fish were below the detection limit of the
assay. n=10 n=l 0 0.14 - 1 0,12 - , ___ É 0,10 -- I L F 0.03 f .
~
I
|
I
n=l0 n=10 350 _ 0,16 o (ng/m)ss
ê
erone (ng/ml).__l___
I ' | Cortsêš
Testost 0,04 - | l .l _ - 1 50- T 1 0,02 z ' 1 0. ., - ¬ . 0,00 L z-com-01 Handling Control Handling
Figure 12- Cortisol and testosterone levels in sea bass blood plasma after 6 hours of handling stress. Significant differences between treatment groups are marked with ** if the value of p< 0.001.
3.5- Effect ofconfinement stress in sea bass treated with dexamethasone.
Dexamethasone treatment (150 mg Kg* food) had no suppressive effects on the
cortisol levels after 24 hours of confinement stress (figure 13). In contrast, testosterone
levels were significantly higher (p=0.0l) in fish treated With dexamethasone When
compared With the control fish. The levels of 11-ketotestosterone in most fish were
below the detection limit of the assay.
11:10 n=l0 n=l0 n=l0
18° ¬
0,18
-160"
0,16 -
*
140;
___
0,14 ›
-'_
_
0,12
'
0,10
-0,08
--0,06
0,04
20-
'
0,02
O 1 | “' | -- - -,z. |_ - -¡_ L C0fll1'0Í Cbflfillflmt Control Confinement Cortiso (ng/m)aaa
Ê
ãš
(ng/m)Testosterone 1;Figure 13- Cortisol and testosterone levels in sea bass blood plasma after 24 hours of confinement. Before the experiment control fish were given ethanol-treated food and fish subjected to confinement stress were given food treated with 150 mg I(g" dexamethasone. Significant differences between treatment groups are marked with * if the the value of p= 0.01
3.6- Eflect ofhandling stress in sea bass treated with dexamethasone.
Handling stress caused a highly significant (p<0.001) increase of blood cortisol
levels despite dexamethasone treatment, and no alterations on plasma testosterone levels
could be detected (figure 14). The levels of 11-ketotestosterone in most fish were below
the detection limit of the assay
n=10
n=l0
n=l0
'F1°
Em ,
0,18
0,16
-5°”
J-¬
_ 0,14 ‹-
) IX! I(ne/m)
â
e(ng/m .CJ.Q .Q88R3 1-.;i;¡i;...._ nim' | 'Im 0,02 - ! | | , - , Um ' 1 ' 1 -f-Comol Handling Coma Hmdnng
Cortso
zz.
ë
Testosteron .Q.OE8
Figure 14- Cortisol and testosterone levels in sea bass blood plasma after 6 hours of handling stress. Before the experiment, control fish were given ethanol-treated food and fish subjected to handling stress were given food treated with 150 mg Kg' dexamethasone. Significant differences between treatment groups are marked with ** if the value of p< 0.001.
Although there appeared to be a trend for higher level of testosterone when
levels of control cortisol decreased there was no significant correlation between cortisol
testosterone levels for the pooled data of confinement and handling stress experiments
N=77 8 P =0.l64 ¬ 2 - r=-0.l60 7-- .
nem
)
*Í 1 -É l-O I O .Q_
J.,
0.'
I I O I gi; so( -l=~ U1 Ino-I 0 11 ni: 0 Q I .L -n-q oiii Cort 3-2 '1 |' 1 1 -4 -3 -2 -1 O Testosterone (ng ml`l)Figure 15- Correlation between cortisol and testosterone levels. Data was Ln transfonned before correlation analysis was performed.
3.7- Gene cloning
In order to determine the enzymatic expression profile in sea bass during the
period of sexual differentiation, two key enzymes involved in the final steps of estrogen
and androgen synthesis were isolated- CYP 19 and CYP 1lBl.
CYP 19 (P450
aromatase) had 100 % similarity with the sequence that had been previously published
for sea bass. As seen in table 5, the CYP llBl sequence had a high similarity to the
sequence of CYP llBl isolated in Oncorhynchus mykiss. Four other genes, which had
high similarity to the three estrogen receptors (ot, B1, B2) identified in fish and to the
Genes Obtained E value
Size
Species
CYPI9 400 bp 0.0 Dicentrarchus labrax
CYPIIBI
S50 bp
lem Oncorhynchus my/cisslARfl
3:5 bp
6e"m Pagrus major5 Ena
1000 bp
Sem Spams auratalenpi
650 bp
l efif Spams aurataEnpz
1000 bp
lem Micropogonias undulanzs3.8- Gene expression- Semi-quantitative PCR
As seen in figure 16 (a), the expression of CYP1 lB1 enzyme was highest at 80
days post-hatching and showed a higher dispersion of values among individual fish
From that age onwards, the expression decreases to a stable level and the expression of
this enzyme is similar in all individuals. In mature gonads, the expression of this gene is
0,20 0,l8 -1 0.16 raryun s
_
0,14
1 ._| -i 4 'i I 1. ¢_q raryun ts) ¬|_I ou-l (arb O 0, 0, 0, 0, 20 l8 16 14 l2 l"' 0,12 ~'
'°`
O 1 ¡ .¡ l l ._. 121,03-" 0,10 -z
.
;
__,
Z i ¡ 1' i "' 0,06 -: O °¬É 003 ¬
É
Là ” U " 0,04 -I 0,05 "' . O 0,02 -1 n 1 I- 1 0,00 L Ovary Testis B /8Sarb B/18S 1 0,04 -'- 1 ao 100 130 170Stage of development (dph) Gonads
Figure 16- CYP ll Bl gene expression from day 80 until day 170 post-hatching (a) and in mature gonads (b). Gene expression was measured by specific RT-PCR followed by southem blot as the ratio of amplified target over amplification of l8S ribosomal RNA.
The highest expression of androgen receptor was observed at 80 days
post-hatching, and after it progressively decreased (figure 17 a). From day 80 until day 130
post-hatching, the expression of this gene presented a dimorphic pattem. The expression
of this gene was higher in testis than in the ovaries (figure 17 b).
a b
0,35 -‹
25
0,30 -1 I ary un'ts) ts)aryun --Nvw<:> Ú" 0,25 -
°
M
' 0 Í0,20 -~
._
. I ARbeta/8S( P O ARbeta/ l8S(arb`tr E CUII arb tr Uífl 0,10 '-' 5005 -1
1¡
0'
0 ' 11 O I O . 0,00 ~ 1 =l ` I30
100
130
170
OW'-“Y Testis
Stage of development (dph) Gonads
Figure 17- AR beta gene expression from day 80 until day 170 post hatching (a) and in mature gonads (b). Gene expression was measured by specific RT-PCR followed by southem blot as the ratio of amplified target over amplification of 185 ribosomal RNA.