Method implementation and
technique development
for studies with cyanobacteria
-CONTENTS
Acknowledgements ... 2
Introduction ... 3
Biohydrogen... 3
Cyanobacteria... 4
Hydrogen evolution by cyanobacteria... 4
Nostoc punctiforme and the NHM5 mutant ... 10
Initial proposed work ... 12
Selecting, establishing and developing methods for physiological studies... 13
Research aim and context... 14
Materials and methods... 15
Initial photobioreactor... 15
Light intensity ... 15
Sensors ... 15
Cleaning of tube walls... 15
High-level and low-level control of bioreactor ... 16
Sterilization ... 16
Initiating culture... 16
Measuring chlorophyll a ... 17
Extraction of genomic DNA ... 17
New methods – selection and development ... 18
Photobioreactor development... 18
Detection and quantification of Hydrogen, Oxygen and Nitrogen... 19
Strains in competition - detection and quantification... 19
Results and discussion... 22
Initial experiments... 22
The new reactor... 22
Growth kinetics ... 25
Gas content variation in short term experiments... 26
Use of PCR for strain quantification ... 27
New methods applied to the study of Gloeocapsa alpicola... 31
Studies with Gloeocapsa alpicola... 31
Discussion and Conclusions... 32
Method implementation ... 32
Technique development ... 33
Overall conclusions... 34
Future developments ... 35
Molecular basis for growth and cell division in Nostoc punctiforme... 35
Hardware and software development for photobioreactor ... 38
References ... 39
Acknowledgements
My thanks go to: Professor Peter Lindblad for, once again, receiving me in his lab; Professor Rosário Oliveira for taking the chance of being my supervisor in Portugal; all my colleagues in the lab - Pia Lindberg in particular for her support in the molecular work; Rikard Axelsson, José Costa and Marie Holmquist for their support, good humor and for laughing at my bad jokes. For sharing his results, I want to thank and mention Professor Taras Antal.
The present work is part of the IEA Agreement of the Production and Utilization of Hydrogen, Annex 15 Photobiological Production of Hydrogen, and financially supported by the Swedish Energy Agency, and the Swedish Research Council. For a period of seven months, partial financial support was provided by the Swedish Institute.
Introduction
Biohydrogen
The increase of global pollution and the depleting of the fossil fuel reserves make the research concerning alternative energy resources a priority. One environmentally acceptable alternative energy carrier, which could initially supplement or even substitute fossil fuel, is molecular hydrogen, H2 [1].
Hydrogen produced by microalgae and bacteria is biohydrogen [2]. Diverse microorganisms are capable of hydrogen evolution: from light dependent photosynthetic microorganisms to non-photosynthetic microorganisms that depend on organic and inorganic compounds. These are classified into anaerobic bacteria, fermentation bacteria, aerobic bacteria, photosynthetic bacteria, and algae [3] (see Table 1).
Table 1. Classification of hydrogen producing bacteria. Taken from [3]. Available
Energy Form
Enzyme of H2 Evolution
Class of Bacteria Genus of Bacteria Electron Donor
Green Algae Chlamydomonas Water
Hydrogenase Heterocyst Chlorella “
Cyanobacteria Anabaena “
Photosynthesis Non-Heterocyst Oscillatoria “
Non-sulfur Bacteria Rhodopseudomonas Organic Matters (Organic Acids)
Nitrogenase Photosynthetic Bacteria Rhodobacter “
Rhodospirillum “
Sulfur Bacteria Chromatium Sulfates
Thiocapsa “ Obligate Anaerobes Clostridium Organic Matters (Sugers) Hydrogenase Methanobacterium “ Non- Photosynthesis Facultative Anaerobes Escherichia “ Facultative Aerobes Azotobacter “
Nitrogenase Nitrogen Fixing Bacteria Clostridium “
Facultative
Introduction
Production of hydrogen by direct splitting of water using solar radiation is seen as the preferable solution. Three ways to achieve this can be considered: a) the use of photochemical fuel cells, b) by applying photovoltaics, or c) by promoting production of hydrogen by photosynthetic microorganisms [4].
Cyanobacteria
Cyanobacteria have a long evolutionary history thought to extend to at least 3500 million years ago [5]. This group includes many different physiological and morphological types that can be found in many different habitats – from cold seawater to hot springs. Cyanobacteria show a remarkable morphological diversity. They may be unicellular or filamentous, occurring singly or grouped in colonies [6] - an example of their morphology is shown in Figure 1.
All cyanobacteria are characterized as eubacteria that grow as autotrophs with CO2 as
the carbon source, utilizing an oxygen-producing photosynthetic mechanism for the generation of ATP and reductant.
Cyanobacteria are gram-negative prokaryotes with the ability to synthesize chlorophyll a and carry out photosynthetic metabolism. Water is typically the electron donor during photosynthesis – that results in oxygen evolution and reduction of carbon dioxide. In fact, this photosynthetic activity is thought to have been the main source of atmospheric oxygen during the first million years of our planets life. But at the same time oxygen inactivates the nitrogenase used to convert atmospheric nitrogen to ammonium. One successful way to circumvent the detrimental influence of oxygen [7, 8] was to restrict the process of nitrogen fixation to a differentiated, non vegetative, cell type whose interior is microaerobic. These cells are called heterocysts (Figure 1).
Hydrogen evolution by cyanobacteria
For photobiological hydrogen production cyanobacteria are among the ideal candidates since they are capable of hydrogen evolution, and have simple nutritional
Introduction
requirements - they can grow in air (N2 and CO2), water and mineral salts, with light as the
only energy source [1].
Figure 1 – The filamentous cyanobacterium Nostoc punctiforme, with vegetative cells (v) and heterocysts (h).
When analyzing the H2 metabolism in nitrogen-fixing cyanobacteria in detail, three
enzymes should be taken into consideration: a) nitrogenase, evolving hydrogen during nitrogen fixation, b) an uptake hydrogenase, recycling the hydrogen produced, and c) a bi-directional hydrogenase that catalyses both hydrogen production and consumption [9] (see Figure 2 and Equations 1, 2, 3, and 4).
Introduction
Cyanobacteria split water directly into protons and oxygen using light as energy source. This hydrolysis (Equation 1) has very simple requirements – water and light – making it environmentally important [11].
+ 0
2 2
Equation 1. H 0 → 2H + 1/2O ( G = +237kJ)∆
Protons obtained from water splitting are then used by nitrogenase to oxidize ferrodoxin, using ATP in the process (Equation 2) [11]. At the same time, the oxygen sensitive nitrogenases promote the reduction of nitrogen to nitrate, in an ATP dependent reaction [1] (Equation 3).
+
red 2 ox
Equation 2. 2H + 2Fd + 4ATP → H + 2Fd + 4ADP + 4Pi
+
-2 3 2
Equation 3. N + 8H + 8e + 16 ATP → 2NH + H + 16 ADP + 16Pi
The hydrogen evolved by the nitrogenase can be further metabolized by a group of enzymes known as hydrogenases. This group of enzymes catalyzes the inter-conversion between hydrogen gas and its elementary particle constituents (Equation 4).
+
-2
Equation 4. H ←⎯→ 2H + 2e
Uptake hydrogenases, catalyzing the consumption of hydrogen, have been found in all nitrogen-fixing cyanobacteria examined so far [12-14]. The catalyzed reaction, thought to be advantageous to the organisms, is undesired from a hydrogen evolution point of view. Bidirectional hydrogenase is able to either produce or oxidize hydrogen. Its role in cyanobacterial metabolism is still unclear. It has been suggested that this enzyme acts as a mediator in the release of excess of reducing power in anaerobic environments [15]. Another hypothesis states that bidirectional hydrogenase in Synechocystis sp. PCC 6803 works as an electron valve for the disposal of low potential electrons generated at the onset of illumination [16]. Even considering the fact that the bidirectional enzyme is not a universal cyanobacterial enzyme [14, 15, 17, 18], its impact on hydrogen evolution should
Introduction
not be overseen. The role of this enzyme should be more thoroughly investigated and its potential for hydrogen evolution explored.
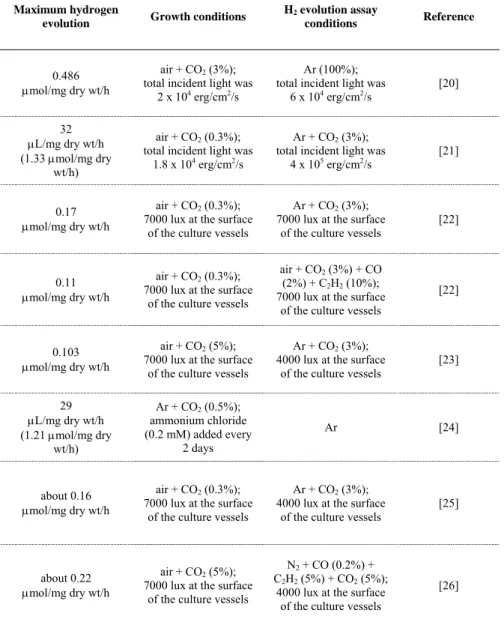
The use of cyanobacteria is regarded as promising not only as a putative hydrogen producer but also as a tool to further understand the physiology and genetics of biological hydrogen metabolism. The last 30 years of research gave the field a good level of basic knowledge that should be the base of future research [19]. Initial work focused on the heterocystous filamentous cyanobacterium Anabaena cylindrica B-629 - light intensity, oxygen, uptake hydrogenase, and gas phase composition were immediately underlined as key factors in the success of hydrogen evolution (Table 2).
Table 2. Maximum hydrogen evolution by Anabaena cylindrica B-629 when grown and assayed under different conditions. Adapted from [19].
Maximum hydrogen
evolution Growth conditions
H2 evolution assay
conditions Reference
0.486 µmol/mg dry wt/h
air + CO2 (3%);
total incident light was
2 x 10⁴ erg/cm2/s
Ar (100%); total incident light was
6 x 10⁴ erg/cm2/s [20] 32 µL/mg dry wt/h (1.33 µmol/mg dry wt/h) air + CO2 (0.3%);
total incident light was
1.8 x 10⁴ erg/cm2/s
Ar + CO2 (3%);
total incident light was
4 x 10⁵ erg/cm2/s [21]
0.17 µmol/mg dry wt/h
air + CO2 (0.3%);
7000 lux at the surface of the culture vessels
Ar + CO2 (3%);
7000 lux at the surface
of the culture vessels [22]
0.11 µmol/mg dry wt/h
air + CO2 (0.3%);
7000 lux at the surface of the culture vessels
air + CO2 (3%) + CO
(2%) + C2H2 (10%);
7000 lux at the surface of the culture vessels
[22]
0.103 µmol/mg dry wt/h
air + CO2 (5%);
7000 lux at the surface of the culture vessels
Ar + CO2 (3%);
4000 lux at the surface of the culture vessels
[23] 29 µL/mg dry wt/h (1.21 µmol/mg dry wt/h) Ar + CO2 (0.5%); ammonium chloride (0.2 mM) added every 2 days Ar [24] about 0.16 µmol/mg dry wt/h air + CO2 (0.3%);
7000 lux at the surface of the culture vessels
Ar + CO2 (3%);
4000 lux at the surface of the culture vessels
[25]
about 0.22 µmol/mg dry wt/h
air + CO2 (5%);
7000 lux at the surface of the culture vessels
N2 + CO (0.2%) +
C2H2 (5%) + CO2 (5%);
4000 lux at the surface of the culture vessels
Introduction
The cultivation of cyanobacteria in nitrate-free media under air and CO2, followed by
incubation in light under argon and CO2 atmosphere, rapidly became standard, since it
resulted in immediate hydrogen production [20, 21]. It was also established that light saturated, nitrogen-fixing cultures had a good and stable supply of reductant, underlining the relationship between photosynthesis and nitrogen fixation. These conditions were considered vital for optimal nitrogen fixation and biomass production. Filament integrity was also discussed and established as a factor in the duration of hydrogen production, since filament breakage leads to loss of nitrogenase activity [21]. The need for strategies in order to minimize mechanical breakage of filaments and general improvement in experimental conditions became evident.
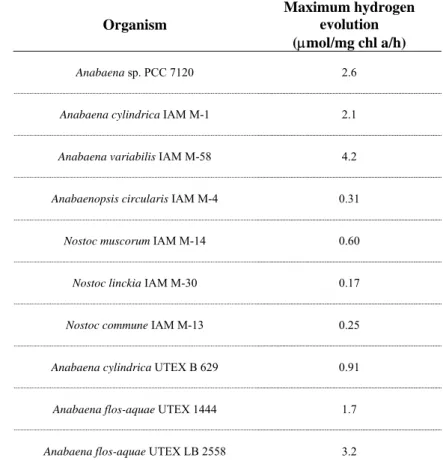
Recently, research was presented analyzing hydrogen evolution in different cyanobacterial strains in an effort to find a suitable strain for cyanobacterial biohydrogen production [27] (Tables 3 and 4).
Table 3. Comparative study of hydrogen production in some heterocystous cyanobacteria. All organisms were grown under air and 20µE/m2/s, and H2 evolution assays were
performed under Argon atmosphere and 60 µE/m2/s. Adapted from [19].
Organism
Maximum hydrogen evolution (µmol/mg chl a/h)
Anabaena sp. PCC 7120 2.6
Anabaena cylindrica IAM M-1 2.1
Anabaena variabilis IAM M-58 4.2
Anabaenopsis circularis IAM M-4 0.31
Nostoc muscorum IAM M-14 0.60
Nostoc linckia IAM M-30 0.17
Nostoc commune IAM M-13 0.25
Anabaena cylindrica UTEX B 629 0.91
Anabaena flos-aquae UTEX 1444 1.7
Introduction
Table 4. Maximum hydrogen evolution by different Anabaena strains. Adapted from [19]. Organism Maximum hydrogen evolution Growth conditions H2 evolution assay conditions Reference
Anabaena sp. N-7363 µmol/mg chl a/h 36 -- Ar [28]
Anabaena variabilis ATCC 29413
about 1.3 µL/mg dry wt/h
(0.05 µmol/mg dry wt/h)
5000 lux at the surface of the culture vessels
Ar + CO2 (5%);5000 lux; addition off Tween 85 (77 mM) [29] Anabaena variabilis 1403/4B 20 µL/mg dry wt/h (0.83 µmol/mg dry wt/h) air; 15 µE/m2/s no gas phase;
cells immobilized in hollow fibers;
25 µE/m2/s on top surface and
13 µE/m2/s on bottom surface of
reactor
[30]
Anabaena variabilis ATCC 29413 µmol/mg chl a/h 45.16
Ar (73%) + N2 (25%) + CO2 (2%); 90 µE/m2/s Ar (93%) + N2 (5%) + CO2 (2%); 90 µE/m2/s [31]
Anabaena variabilis PK84* µmol/mg chl a/h 167.60
Ar (73%) + N2 (25%) + CO2 (2%); 90 µE/m2/s Ar (93%) + N2 (5%) + CO2 (2%); 90 µE/m2/s [31] 2.63 µL/mg chl a/h (0.11 µmol/mg chl a/h) air + CO2 (2%); outdoor conditions air + CO2 (2%); outdoor conditions (about 400 W/m2) [32]
Anabaena variabilis PK17R* µmol/mg chl a/h 59.18
Ar (73%) + N2 (25%) + CO2 (2%); 90 µE/m2/s Ar (93%) + N2 (5%) + CO2 (2%); 90 µE/m2/s [31]
Anabaena azollae µmol/mg chl a/h 38.5
air + CO2 (2%);
continuous turbidostat
mode; 113 µE/m2/s Ar
Anabaena variabilis ATCC 29413 µmol/mg chl a/h 39.4
air + CO2 (2%);
continuous turbidostat
mode; 113 µE/m2/s Ar [33]
Anabaena variabilis PK84* µmol/mg chl a/h 32.3
air + CO2 (2%);
continuous turbidostat
mode; 113 µE/m2/s Ar
Anabaena variabilis AVM13* µmol/mg chl a/h 68 air + CO100 mE/m2 (1%); 2/s -- [18]
Anabaena sp. PCC 7120 µmol/mg chl a/h 2.6 20 µE/mair; 2/s
Ar;
60 µE/m2/s
Anabaena cylindrica IAM M-1 µmol/mg chl a/h 2.1 20 µE/mair; 2/s
Ar;
60 µE/m2/s
Anabaena variabilis IAM M-58 µmol/mg chl a/h 4.2 20 µE/mair; 2/s 60 µE/mAr; 2/s [27]
Anabaena cylindrica UTEX B 629 µmol/mg chl a/h 0.91 20 µE/mair; 2/s
Ar;
60 µE/m2/s
Anabaena flos-aquae UTEX 1444 µmol/mg chl a/h 1.7 20 µE/mair; 2/s 60 µE/mAr; 2/s
Anabaena flos-aquae UTEX LB 2558 µmol/mg chl a/h 3.2 20 µE/mair; 2/s 60 µE/mAr; 2/s * mutant strains
Introduction
Several studies, directly comparing the hydrogen evolution by different cyanobacterial strains, have shown to be extremely useful. In the seventies, a period when developing a new energy production was a major priority, some studies started to diverge from using the initial Anabaena cylindrica B-629.
In Table 4 several Anabaena strains, together with maximum hydrogen evolution rates, are presented. A significant number of Anabaena strains have been, for quite some time, the object of intensive studies. Nostoc punctiforme, a very close relative to Anabaena strains, is the model organism used in Peter Lindblad’s laboratory and the one used in initial testing of the new bioreactor and the techniques developed. This cyanobacteria has a relatively large genome [34], with about 70% of similarity to other cyanobacteria.
Nostoc punctiforme ATCC 29133 and the NHM5 mutant
Nostoc punctiforme is a nitrogen-fixing cyanobacterium belonging to the family
Nostocaceae in the order Nostocales [35]. Members of the order Nostocales are broadly characterized by growth as unbranched filaments and the production of up to four kinds of differentiated cells.
Nostoc punctiforme can be obtained from at least two collections: ATCC (strain
number 29133), and PCC (strain number 73102). The strain was first isolated from a symbiotic association with the cycad Macrozamia sp. It was deposited in the Pasteur Culture Collection in 1973 as Nostoc sp. PCC 73102 [36]. For practical reasons, the used strain will be simply referred throughout the text as Nostoc punctiforme.
Obtaining mutants and studying their hydrogen evolution capabilities has driven research concerning hydrogen production a step forward - higher levels of cyanobacterial hydrogen production were the result (some examples are given in Table 4). Genetic engineering was used to create mutants lacking uptake hydrogenase in both Anabaena
variabilis [18, 31], and more recently in Nostoc punctiforme [37]. These mutants show that
improved production of molecular hydrogen is possible in oxygen evolving photosynthetic microorganisms.
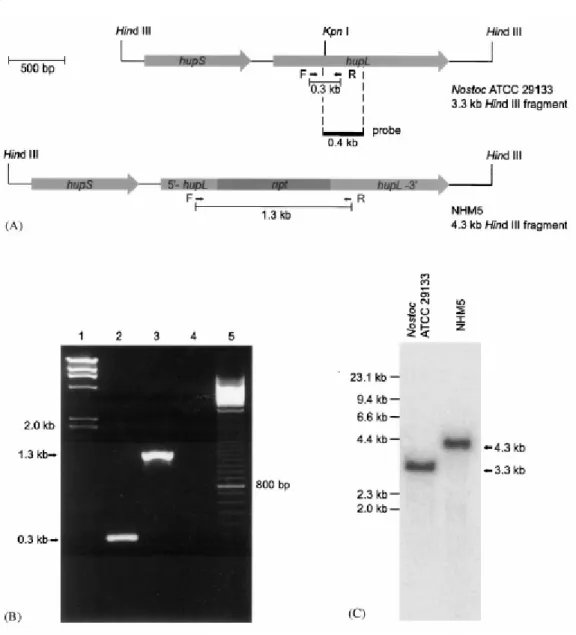
A hupL- mutant strain of Nostoc punctiforme was constructed by replacing the hupL gene, encoding for the uptake hydrogenase large subunit, with an inactivated copy via
Introduction
homologous recombination (Figure 3). Therefore, this mutant completely lacks hydrogenase activity, since it does not possess a bidirectional hydrogenase.
.
Figure 3 - (A) Physical map of wildtype and inactivated hupSL. F and R represent primers used for PCR analysis. HindIII sites and probe used in Southern blot are indicated. (B) Gel with PCR analysis products, with genomic DNA from the wildtype Nostoc ATCC 29133 and the mutant NHM5 as templates. Lane 1: Size marker (HindIII fragments), lane 2: wildtype, lane 3: NHM5, lane 4: PCR negative control (dH2O), lane 5: 100 bp ladder. (C) Southern blot of genomic DNA
from wildtype Nostoc ATCC 29133 and NHM5 digested with HindIII and probed with a fragment from within the wildtype gene (see A). Taken from [37].
Introduction
The gene was interrupted by inserting a neomycin resistance cassette into a unique KpnI site within hupL [37]. The completely segregated recombinant strain NHM5 (Nostoc Hup Mutant 5) was selected for analysis of hydrogen evolution.
Initial proposed work
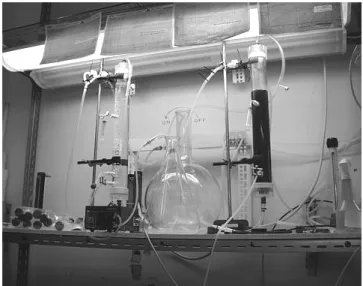
Cyanobacterial cultures were initially grown in a laboratory-scale helical tubular photobioreactor, made of polyvinyl chloride tubing (Figure 4) [38]. Specific hardware and software allowed the real-time monitoring of several parameters (pH, optical density, temperature, oxygen concentration, and light) and their variations during cyanobacterial growth. The cyanobacterial suspension was kept in a turbulent state by gas injection (active air-lifting).
Figure 4 – Right - photobioreactor initially used.
Introduction
The “nature of the biological material” sometimes is the cause of unexpected changes in research planning. Independently of how organized and carefully constructed an experimental procedure is, it will ultimately be dependent on the behavior of the cells. In this particular case, using the equipment described, the cells did not show any sign of growth. The peculiarities of growing Nostoc were already known [39], but growth was still expected. Faced with this problem, along with the age and deteriorated state of sensors and signal acquisition of existing equipment, it was decided to make methods development a priority.
Selecting, establishing and developing methods for physiological studies
The main obstacles in the development of H2 production technologies using
cyanobacteria are: a) inhibition of enzymes directly involved in hydrogen production by oxygen, b) H2 consumption by an uptake hydrogenase, and c) an overall low productivity
[40]. Therefore, improved hydrogen production over a long period demands that: a) the strains used must be selected taking in consideration their specific hydrogen metabolism, b) the most suitable strain(s) should be genetically modified in order to improve the H2
evolution, and c) the overall conditions for cultivation in bioreactors be studied and improved [9].
The bubble column reactor is a bioreactor, in the shape of a column, in which the reaction medium is kept mixed and aerated by introduction of air into the bottom [41]. The use of bubble column reactors is growing specially due to their uncomplicated construction and low cost, associated with high surface area to volume ratio [42] – making them well suited for photosynthetic bacterial growth. The use of this type of bioreactor also facilitates cleaning and maintenance procedures reducing downtime and overall handling demands – making it an interesting solution in a work environment where efforts are focused on physiological problems and not engineering aspects. Even the expected low mixing intensities when compared to stirred tank reactors [43] can be considered as “positive” due to the disrupting effects of filament breakage on metabolism [21].
Introduction
Research aim and context
This work was done taking in consideration that future research should include: a) screening for wild-type strains possessing high nitrogenase activity and/or very active hydrogen evolving hydrogenase, b) specific genetic modification of these strains (aiming for uptake hydrogenase deficient mutants with higher heterocyst content, increased level of bidirectional hydrogenase and decreased growth/cell division), and c) optimization of cultivation conditions for hydrogen evolution - improvement of parameters like light intensity, CO2 content, temperature, pH or micronutrient content.
This type of research requires establishment of procedures and techniques that are flexible and time effective. With this in mind, the work focused on: a) selecting, adapting and use of a simple and practical bioreactor model, b) developing strategies for short and long-term hydrogen production measurements, c) improving previously existing and explore new techniques to study competition between wild-type and mutant cells, d) selecting monitoring sensors and acquisition hardware, and e) develop software for culture monitoring and control. This project main objective was to build an adequate and easily operated photobioreactor that permitted the study of the metabolism and hydrogen evolution in cyanobacteria.
Materials and methods
Initial photobioreactor
When first essays were attempted a previously existing photobioreactor was used, very similar to a previously described system [38]. The reactor had a total volume of 1.85 liters. Inside the cylinder formed by the coil of polyvinyl chloride tube four 55 W fluorescent lamps were installed (Figure 4). Culture motion was induced by gas injection (6 L/hour) during the experiments.
Light intensity
The installed fluorescent lamps (Figure 4) permitted manipulation of total irradiation, going from 40 µmoles/m2/s (with room lights only) to 446 µmoles/m2/s. During cell
growth two internal lamps were constantly on (228 µmoles/m2/s).
Sensors
To monitor cultivation parameters four sensors were used. The oxygen sensor was placed at the end of the PVC coil, since this should be the point of higher O2 concentration,
resulting from cyanobacterial photosynthesis. The remaining three (for optical density, temperature and pH, respectively) were placed in a vertical section of PVC tube, along with a pneumatic shaker - this way not only the culture passing through the sensors was more homogenized, it also was less prone to cell deposition.
Cleaning of tube walls
Cell deposition on the tube walls is unavoidable due to the laminar nature of the culture flow in the PVC tubes [38]. Biofilm occurs on the walls preventing light from penetrating the tube. To minimize this problem, polyurethane foam cylinders were manufactured and regularly introduced into the photobioreactor.
Materials and methods
High-level and low-level control of bioreactor
Data monitoring and control of the bioreactor was executed at two levels. Low-level control was performed by a device for automation of photobioreactors (CODAPH), comprising of one digital measuring and one control system based on a standard AT motherboard, with an 80286 microprocessor. A Pentium II class PC performed high level control, in order to: a) execute calibration of sensors and pumps, b) alter operational settings, c) allow visual data presentation, and d) quickly store data as tables of values or graphics. High and low-level hardware were connected thru RS232 ports. Both low-level and high level systems used specific software.
Sterilization
Before utilization the photobioreactor was sterilized. First, pure water was pumped in and left to circulate for about 30 minutes, with airflow of 12 L/hour. After discarding the water, using the bottom appendix, 1.5% solution of sodium hypochlorite was inserted and left to circulate for about 2 hours. After this solution was discarded, autoclaved pure water was inserted continuously until pH reached a value between 7.0 and 8.0. At this point, the reactor was considered prepared to receive the medium - BG110 [44] was used in all
experiments.
Initiating culture
Medium was inserted into the reactor, and once the temperature stabilized, the oxygen sensor and optical density sensors were calibrated. Some medium was discarded, in order to introduce the cell batch cultures. These cultures, both Nostoc punctiforme and the mutant NHM5, were obtained by inoculating 600 ml of autoclaved BG110 medium which
was grown for 14 days, in continuous light (40 µmoles/m2/s; Thorn Polylux 4000 and
Materials and methods
Measuring chlorophyll a
To determine chlorophyll a content 1 mL samples of culture were taken from the reactor. The samples were spinned (Heraeus Sepatech Biofuge A, 60 seconds, at 13000 rpm), the supernatant discarded and the cells ressuspended in 1 mL methanol. This mixture was vortexed for 60 seconds and stored, at 4ºC, for 24 hours. Afterwards, the cells were centrifuged (15 seconds), the supernatant used to analyze the absorbance at 663 nm (Jasco 7800 UV/VIS spectrophotometer) and thereby be able to calculate the chlorophyll concentration by applying the simplified formula:
Chlorophyll a (µg/ml) = Abs663 * 12.7
Extraction of genomic DNA
Frozen samples were resuspended in 0.5 ml of Resuspension Buffer (10mM EDTA, 50 mM Tris HCl, pH 8.0) in 2.0 ml microfuge tubes, before, 0.6 g of Glass Beads (Sigma type V), 25 ml of SDS 10% and 500 µl phenol/chloroform 1:1 were added. The tubes were vortexed at high speed for 30 seconds followed by a 60 seconds pause on ice (this procedure was repeated four times). After centrifugation (Eppendorf centrifuge 5402, 14000 rpm, 4º C, during 10 minutes), the upper aqueous phase was transferred to a 1.5 ml eppendorf tube. From this solution genomic DNA was extracted by adding 500 µL of chloroform and, after a short vortex, centrifuged (Eppendorf centrifuge 5402, 14000 rpm, 4º C, for 3 minutes) saving the upper phase. Precipitation followed by adding, in fresh tubes, 50 µL 2M of NaAc and 1250 µL of 100% ethanol. After mixing, the tubes were placed at –20º C for 30 minutes, and then centrifuged (Eppendorf centrifuge 5402, 14000 rpm, 4º C, during 10 minutes). After drying using, a speedvac (Savant speedvac), the precipitated DNA was resuspended in 100 µL of TE (0.1 mM EDTA, 10 mM Tris HCl, pH 8.0).
New methods – selection and development
Photobioreactor development
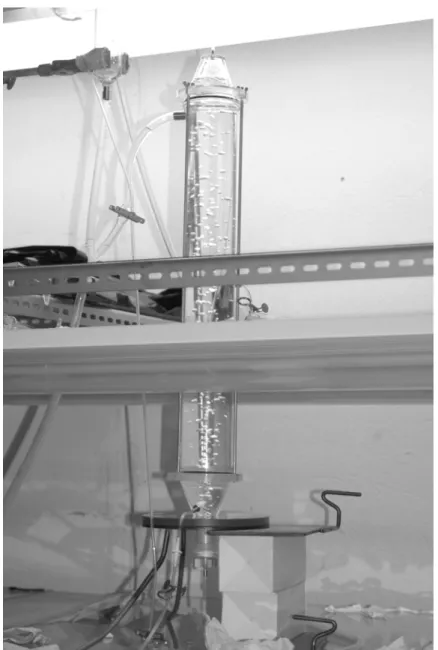
The initial setup used, and described above, showed to be inadequate for cell growth. As an attempted alternative, two bubble column reactors were manufactured. Adapted from old separation columns these units shared all characteristics (see Figure 5). Each reactor had a volume of about 1.7 L and circa 60 cm height. Modified 1.5 mL microtubes were used as gas injectors, placed in the bottom of the column. The gas mixture inserted was filtered using 0.2 µm circular membranes. Inlet of autoclaved media was performed via an orifice created in the main tube just above the bottom screw-on lid – one 4 mm id tube connector was split and used as a support for the tube carrying media into the reactor. A similar procedure resulted in a second inlet/outlet connection – about half the height of the column, used for culture sampling. The main system outlet was a connector opposite to the injector. This outlet in the upper lid had 10 mm id and directed the gas and overflowing culture into an autoclave resistant PVC container.
Figure 5 – The former separation columns adapted to act as bioreactors.
This setup was used for trial growth, in order to assert optimal light and gas flow conditions. The initial phase of growth can be problematic due mostly to light conditions – too high or too low intensities will affect growth. Usually lower light intensities are favored, and in batch cultures it is normal to cover the flasks with some paper during the first 24 to 48 hours of cell cultivating. An intensity of about 250 lux was found to be
New methods – selection and development
suitable for all growth stages (intensity is average of incident light taken from 12 points in the reactor wall). Growth was then possible and surprisingly fast (data not shown) – taking in consideration not only the previous growth problems but also what is generally known about growing Nostoc punctiforme. After some planning and literature search the final design for the reactor was decided and a prototype built.
Detection and quantification of Hydrogen, Oxygen and Nitrogen
For numerous reasons, debated in Introduction, the knowledge of gas concentrations for hydrogen, oxygen and nitrogen is vital. The best alternative to quantify these gases is the use of a gas chromatograph. For that purpose, after analyzing the available units in the market, one Perkin Elmer Clarus 500 GC was acquired. Equipped with one Packed Column Injector and one Thermal Conductivity Detector, and after proper calibration and setting, this unit allows for the detection of these three gases in about 1.6 minutes per sample. Each 100 ml gas phase of sample was transferred from the reactor or test vials using a Hamilton 81156 Gastight syringe.
Experiments to measure gas phase variation due to metabolic processes in cyanobacteria were performed using 8 mL Chromacol tubes, with teflon coated rubber septa fixed with plastic lids. The tubes, with 2 mL of cell culture and one 4 mm glass bead, were rotated at 20 revolutions per minute and illuminated with strong light (about 600 lux). This setup should provide maximum hydrogen evolution rate values for every tested strain.
Strain detection and quantification
One possible way of detecting and quantifying different strains of cyanobacteria is the use of PCR. Assuming that different initial concentrations of a DNA template will result in different product concentrations, comparative concentrations between strains can be ascertained. Genomic DNA was isolated from wildtype Nostoc punctiforme and mutant strains using the method described in Materials and methods. PCR was initially performed according to standard protocols. The primers used were:
New methods – selection and development
forward primer - 5’-[CGCCATTATGAGGAAGCTGT]-3’ and reverse primer - 5’-[CGGTCTTCATCCAACCAATC]-3’.
These primers yield a 308 bp PCR product from the wildtype hupL, and a 1.3 kb product from the inactivated gene (when containing the npt gene and part of the vector used for insertion - see Figures 3 and 6) [37]. The first obstacle to be overtaken was the difficulty of simultaneously amplifying two differently sized products using the same pair of primers. Ideally, the two fragments would be correctly amplified so that one pair of primers would be enough to produce gels with two distinct bands per lane, whose intensities could be quantified. This was not possible and an alternative approach was designed (described later in “Results” and analyzed in “Discussion and Conclusions”).
ATGACAATTCAATCATTAGACATTTCGCCCGTCGGTAGAGTTGAAGGCGATTTAGATGTCCGAGTTGATA TTGAACATGGAAGAGTAGTCAACGCCTGGACACACGCTGAATTATTCCGTGGATTTGAAGTTATTCTTCG TGGTAAAGACCCCCAAGCCGGATTAATTGTCACACCTCGCATTTGCGGAATTTGCGGCGGTTCTCACCTG ACATCTGCATCTTGGGCATTAGATACAGCTTGGGAAACAGAAGTTCCCCGCAATGCAATTTTAGCGAGAA ATCTTGGTCAAATTGTCGAGACAATTCAAAGCATTCCCCGCTATTTTTATGGTTTGTTCGCCATTGATTT AACCAATAAAAAATACCGTAATAGTCGCCATTATGAGGAAGCTGTTAGACGCTTTGCCGCCTTCACTGGC AAATCTTACGAACTAGGCATAACAATTTCTGCTAAACCCGTAGAAATTTATGCACTGTTGGGCGGACAAT GGCCTCATTCTAGCTACATGGTACCTGGTGGCGTGATGTGCGCCCCCACTTTAACAGACATTACTCGCGC TTGGGCGATTCTAGAATATTTCCGCACCAATTGGTTAGAACCAGTGTGGTTAGGTTGTTCATTAGAACGC
TACGAACAAATCCAAACTTATGATGACTTCAGAGATTGGTTGGATGAAGACCGAAATCATCGAGATTCCG
ACTTAGGTTTTTATTGGCGCATGGGTTTAGACATCGGTTTAGATAGATATGGCGCTGGTGTTGGTAAATA TGTGACTTGGGGATATTTAACCCATGAAGATAAATACCAAAAGCCGACTATCGAAGGACGAAATGCGGCG ATGATTATGAAAAGTGGAGTGTACGACAGCTTCGCAGACACTCACGTTTTAATGGATCAGTCATTTACCC GCGAGAATACAACTCACTCTTGGTACGATGAAGGGACAGAGGATATTCACCCTAGCGATCGCACCACTAA ACCCACTGCAATCAATACCAAAGACTTCGATAACGCCTACTCTTGGTCAAGTGCAGTCCTTCACAAAGAC TTCGGACGCTTGGAAACCGGCCCTTTAGCGCGGCAATTAGTAGCTGGTGGTCAGCATGGCGAATCTTGGC AACATTACGACGGTTTTATCTTGGATGCTTTCCAAAAAATGGGTGGTGCTAGTATTCATTTACGTCAACT TGCACGAGTTCACGAAATTGTCAGGTTATATCGCCAAGCGGAAAGATGTCTGCGTGAGTTTGTCTTAAAT GACCCTTGGTATATCAAACCCAAAGAAAAAGACGGACGCGGTTGGGGTGCAACGGAAGCCTCACGGGGTT CTTTGTGTCACTGGATAGATATAGAAGGTGGCAAGATTAAGAATTATCAGGTGATTGCTGCGACTACTTG GAATATCGCCCTTCGTGACGGCGAAGGAATCCGCGGCCCAATTGAAGAAGCGTTAATTGGGACACCCATT TACGATTCTAGCGATCCGGTGGAAGTTGGTCATGTGGCGCGATCGTTTGATTCATGTTTGGTGTGTACAG TCCACGCCCATGATGCGAAGACTGGTGAAGAGTTGGCGCGTTTTCGGACTGCTTAA
Figure 6 – Nostoc punctiforme hupL homolog gene, complete cds. Marked areas are: forward primer region in red, reverse primer region in green, and blue defines the remaining of the product obtained by PCR from Nostoc ATCC 29133 wildtype DNA.
The new strategy involved: a) finding the ideal PCR conditions that favored the amplification of the smaller fragment using the above described primers (in the case of wiltype and mutant mixtures), and b) the use of a second pair of primers, specific for the
New methods – selection and development
forward primer - 5’-[AGGCTATTCGGCTATGACTGGG]-3’ and reverse primer - 5’-[TGGATACTTTCTCGGCAGGAGC]-3’.
This new second pair of primers, for detection of the npt gene resulted in a PCR product of 292 bp (see Figure 7). The two pair primer strategy allows the detection and/or quantification of the relative concentrations of the two strains.
ATGATTGAACAAGATGGATTGCACGCAGGTTCTCCGGCCGCTTGGGTGGAGAGGCTATTCGGCTATGACT
GGGCACAACAGACAATCGGCTGCTCTGATGCCGCCGTGTTCCGGCTGTCAGCGCAGGGGCGCCCGGTTCT
TTTTGTCAAGACCGACCTGTCCGGTGCCCTGAATGAACTGCAGGACGAGGCAGCGCGGCTATCGTGGCTG GCCACGACGGGCGTTCCTTGCGCAGCTGTGCTCGACGTTGTCACTGAAGCGGGAAGGGACTGGCTGCTAT
TGGGCGAAGTGCCGGGGCAGGATCTCCTGTCATCTCACCTTGCTCCTGCCGAGAAAGTATCCATCATGGC
TGATGCAATGCGGCGGCTGCATACGCTTGATCCGGCTACCTGCCCATTCGACCACCAAGCGAAACATCGC ATCGAGCGAGCACGTACTCGGATGGAAGCCGGTCTTGTCGATCAGGATGATCTGGACGAAGAGCATCAGG GGCTCGCGCCAGCCGAACTGTTCGCCAGGCTCAAGGCGCGCATGCCCGACGGCGAGGATCTCGTCGTGAC CCATGGCGATGCCTGCTTGCCGAATATCATGGTGGAAAATGGCCGCTTTTCTGGATTCATCGACTGTGGC CGGCTGGGTGTGGCGGACCGCTATCAGGACATAGCGTTGGCTACCCGTGATATTGCTGAAGAGCTTGGCG GCGAATGGGCTGACCGCTTCCTCGTGCTTTACGGTATCGCCGCTCCCGATTCGCAGCGCATCGCCTTCTA TCGCCTTCTTGACGAGTTCTTCTGA
Figure 7 – npt gene, complete cds. Marked areas are: forward primer region in red, reverse primer region in green, and blue defines the remaining part of the product obtained by PCR
Results
Initial experiments
The initial growth experiments were just the beginning of a new set of problems/challenges, and the proof that not getting cyanobacteria to grow can be the start of a good challenge. The solution for the problem involved the construction of a new photobioreactor (Figure 8).
The new reactor
In Figure 8 is shown the new 1.55L bubble column reactor, which as three main parts: one central cylinder (50 cm long), one base cone and a top cone. The central cylinder comprehends most of the reactors volume. It has three input/output points: one small at middle height for sampling and, opposite, two larger for culture circulation (for future culture parameter monitoring, see Figures 8 and 9).
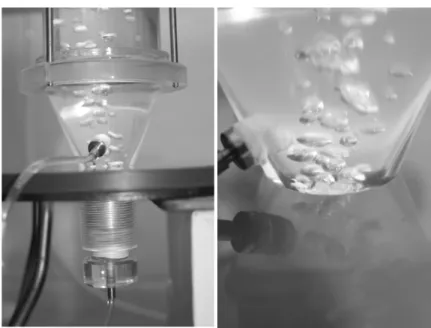
The lower cone supports the gas injection system and the primary inlet/outlet. Gas injection is done using a double membrane system on top of a cylindrical chamber that precedes the gas injection point. The chamber is then fixed to the cone by screwing, with a rubber ring to seal the reactor content (see Figure 10). Four 0.2 µm PTFE membranes (Acro 50 Vent Device, Gelman Laboratory) filter all incoming gas, and the pressure is constantly regulated to 1 atm.
The upper cone provides the system with an exit for both gas and liquid. This is then connected to a trap that allows for gas recirculation, with liquid/solid elements being drained to a container for posterior decontamination (see Figure 11).
Recirculation is made possible using a KNF NMP 05 S micro pump (see Figure 11). This feature and the fact that all tubing is high quality PVC (Tygon by Saint-Gobain) allows for the analysis of hydrogen gas content variation for an extended time.
Results
Figure 8– General view of the prototype bubble column reactor built.
Figure 9 – Left image: the sampling point about half height of the main cylinder; right image: the top cone and recirculation exit immediately below it.
Results
Figure 10 – Left image: the lower cone with primary inlet/outlet; right image: detail of gas injection.
Figure 11 – Left higher image: upper general view; left lower corner: the micro pump for gas recirculation; right image: trap to ensure only the gas phase is recirculated and liquid phase is rejected.
Results
Growth kinetics
After installation and first detail modifications, several culture cycles were performed in fed-batch to calculate the basic growth kinetics of Nostoc punctiforme. All data taken was compiled and the resulting growth curve is shown in Figure 12.
Time (hours) 0 50 100 150 200 250 300 Ch lo ro pl yll a (m g/ L) e-1 e0 e1 e2
Figure 12 – Variation in chlorophyll a concentration during Nostoc punctiforme, under constant light, air flow rate mixture and temperature conditions.
The growth curve is the result of several cell growth cycles, in order to get a curve as accurate and informative as possible. From this curve the values of K, doubling time (dt) and specific growth rate (µ) were calculated applying the following equations.
ln(n2) - ln(n1) Equation 5. K=
Results ln(2) Equation 6. dt= K 1 Equation 7. = dt µ
From the growth curve shown above in Figure 12, the values calculated concerning growth kinetics were: 0.038 for K, 18.17 hours for doubling time and 0.055 for µ. Previous to this work, tests run in the lab have shown that in batch culture the doubling time is about 24 hours.
Gas content variation in short term experiments
In Figure 13 the variation in gas composition during H2 production is shown. This
graphical representation is the results of the use of 8 mL Chromacol vials described in “New methods - selection and development”. For this particular experiment, 4 such vials were used all containing: 2 mL of the same cell culture, one 4 mm glass bead in 21% oxygen and 79% nitrogen atmosphere. The glass bead allows for improved mixing of the populated culture medium and better gas exchange between the liquid and the gas phase.
The initial variation for the three gases monitored was quite fast, but declined between 50 and 60 minutes the start of the experiment. Adaptation to the new environment (more precisely the higher light intensity) might help explain the reduction in hydrogen evolution, after such a promising start. It is know that light intensity variations can have implications in the growth of cyanobacteria, both wildtype and mutants [45].
During the initial period the maximum hydrogen evolution rate was 72 nmol/µg chl
a/h. This result is higher than the initially expected (14 nmol/µg chl a/h), taking in
consideration previous tests performed [37]. This is evidence that growth and hydrogen evolution testing conditions are vital to optimize hydrogen production.
The variation in hydrogen concentration observed between minutes 80 and 210 is interesting and will be the subject of further analysis in “Discussion and Conclusions”.
Results Time (minutes) 0 100 200 300 Oxy gen (%) 20 21 22 23 24 25 Nitrogen (%) 73 74 75 76 77 78 79 80 0.0 0.2 0.4 0.6 0.8 1.0 Hy drog en (%)
Figure 13 – Variation in gas phase composition during short-term experiment.
Use of PCR for strain quantification
The initial set of tests with PCR was performed in order to overcome the problem posed by simultaneous amplification of two different sized products (Figure 3). The primers specific for the hupL gene were used having a 99% mutant/1% wildtype DNA mixture as target. Several gradient PCR, associated with different MgCl2 concentrations,
were performed – in Figure 14 some results of those tests are shown. The aim of the test was to find such PCR conditions that allowed for single amplification of the smaller fragment (wildtype). The manipulation of MgCl2 was enough to create such condition that,
even a relatively small amount of wildtype DNA in a given sample would still result in the amplification of the smaller fragment. In section 3 of Figure 14 the success to avoid amplification of the largest fragment is clear. Therefore, the final PCR conditions included an annealing temperature of 60ºC and 3 mM MgCl2 (final concentration).
Results
Figure 14 – Analysis of PCR products from a DNA mixture of both wildtype and mutant. In 1, 2, and 3 gradient temperature for PCR was between 62 and 57ºC (from left to right). The concentration of MgCl2
increased from situation 1 to situation 3.
The second pair of PCR primers, specific for the npt gene and previously described, was tested and the results of those tests are shown in Figure 15. The product resulting from amplification of NHM5 DNA containing the npt gene (lanes 4 and 5) shows very similar size when compared to the fragments resulting from amplification with the hupL specific primers (lanes 2 and 3). Lanes 6 and 7 are the negative controls for both primers. Lanes 1 and 8 contained λ DNA cut with the enzyme Pst I for band size assessment.
Figure 15 – Nostoc punctiforme and NHM5 analysis by PCR. In lanes 2 and 3 - fragments resulting from amplification with the hupL specific primer. In lanes 4 and 5 - product resulting from amplification of NHM5 DNA containing the npt gene. Lanes 6 and 7 are the negative controls for both primers and lanes
Results
To further check for the specificity of the npt specific pair of primers, other PCR reactions were performed (Figure 16). In these, the npt specific primers were applied in samples containing only wildtype DNA - as expected no amplification at all occurred (lanes 2 and 3). Also, hupL specific primers were used with a sample of 100% NHM5 DNA – the resulting bands, shown in lanes 4 and 6, have about 1.3 Kbp and are in accordance with the expected size (see Figure 3, in Introduction). Lanes 7 and 8 contain the controls for both pairs of primers, and lanes 1 and 6 are makers of λ DNA cut with the enzyme Hind III.
Figure 16 – Nostoc punctiforme and NHM5 analysis by PCR, in order to assure npt primer pair specificity.In lanes 2 and 3 - npt specific primers were applied in samples containing only wildtype DNA. In lanes 4 and 6 - hupL specific primers were used with a sample of 100% NHM5 DNA. Lanes 7 and 8 contain the controls for both pairs of primers, and lanes 1 and 6 are
makers of λ DNA cut with the enzyme Hind III.
The ability to establish a relation between one specific PCR product and the concentration of a strain in a culture sample was tested (Figures 17 and 18). Using different mixtures of strains (from 0 to 100%, in 20 % intervals), the extracted DNA was used for PCR with npt specific primers (Figure 17, from lanes 2 to 7). There is a clear difference in band intensity, which gives a first indication about the feasibility of the test. Lanes 1 contains the maker (λ DNA cut with the enzyme Hind III) and lane 8 is the control.
Results
Figure 17 – Strain mixture analysis using PCR. In lanes 2 to 7- mixtures of strains from 0 to 100%, in 20 % intervals). Lane 1 contains λ DNA cut with the enzyme Hind III.
Further analysis of this gel image with appropriate software (LabImage version 2.62a, Kapelan GmbH) supplied the data that made possible the graphic presented in Figure 18. The graphic shows that a linear relation between strain concentration and band intensity is not possible for this PCR conditions. This, however, does not undermine the technique as will be discussed later.
Strain percentage in culture mixture
0 20 40 60 80 100 Im ag e si g n a l are a 0.0 2.0e+4 4.0e+4 6.0e+4 8.0e+4 1.0e+5 1.2e+5 1.4e+5
New methods applied to the study of Gloeocapsa alpicola
Studies with Gloeocapsa alpicola
After initial testing with Nostoc punctiforme, it was suggested that the new setup could be used in the study of Gloecapsa alpicola. This work was performed by Prof Taras Antal, currently working in Prof Lindblad’s group.
This work was performed using different gas mixtures and flow rates, and varying light intensities. It was possible to obtain valuable data that otherwise, using the traditional methods, would take considerably longer time and resources. The increased culture volume, five to seven times higher than the typical batch culture, allows for more frequent sampling and analysis of a higher number of parameters.
Preliminary results are shown in Figure 19.
Time (hours) 0 100 200 300 0,0 0,5 1,0 1,5 2,0 2,5 P rot ei n (m g/ L ) 0 20 40 60 80 100 120 140 pH 7,3 7,4 7,5 7,6 7,7 7,8 7,9 Ch lor op hy ll a (mg /L )
Figure 19 – Variation in pH, protein content and chlorophyll a concentration during three consecutive growth periods.
Even when faced with a seemingly unavoidable contamination, the stability and reproducibility of growth conditions allowed for the replication of the problem. Final data is not available yet. Taking in consideration available information, it is possible that a particular growth environment might have provided the cells with good conditions for exopolysaccharide production [46].
Discussion and Conclusions
Method implementation
The choice of the bubble column reactors has been positive. The growth rates obtained for Nostoc punctiforme support this method as a real alternative for improved cell growth, when compared to the previously used method. The use of the new bioreactor also allows for bigger culture volume, easier sampling, and much larger array of environmental variables that can be introduced and allow for better physiological studies.
The new method gained general acceptance, and another two units are being built so that bioreactor use can be more intensive and broader. Hopefully, the coming publications from the group will include several studies made easier, or even possible, due to the use of the bubble column photobioreactor. However, work concerning the design and development is not complete. This system still lacks the control and automation component that will increase its overall value and capabilities. The development has not stopped, and further improvements will be presented in “Future developments”.
Gas analysis was made much easier and faster with the introduction of the Perkin Elmer Clarus 500 GC. The user friendly interface and velocity made this unit a huge success, and its use has expanded from hydrogen quantification only to being used in nitrogen uptake tests in more than one cyanobacterial strain.
The use of Chromacol tubes with teflon/rubber sealing has also proved to be a good method for hydrogen production assays. This very simple procedure, combined with the GC velocity, allows for fast testing and very good hydrogen evolution.
The peak hydrogen evolution found, 72 nmol/µg chl a/h, was surprisingly high and the subject of discussion. The overall conclusion was that not only the analysis method might be more effective, but the physiological state of the cells might have played a key role. The previous test, in witch maximum production was 14 nmol/µg chl a/h, was done when the batch culture used was already entering stationary phase. In contrast, the latest tests were performed with cultures in the initial logarithmic growth phase.
In Figure 13, the unexpected drop in H2 concentration does not have a clear
justification. NHM5 does not possess any hydrogenase, so an answer has to how could there have been H2 uptake still remains. The hypothesis of contamination with wildtype
was raised. In this scenario, a decrease in hydrogen evolution has a late response to the high light intensity could have taken the net hydrogen evolution to negative figures, due
Discussion and Conclusions
uptake activity by the contaminating wildtype community. After adaptation by NHM5 cells, around minute 120, H2 evolution returned to positive figures and concentration in the
gas phase increased. This situation occurred systematically, so an effort to maintain strain purity of cultures is an essential requirement for future testing.
Technique development
The use of quantitative PCR for strain relative concentration assertion is still not fully developed, but has already shown great potential. It was important to refine PCR conditions in order to eliminate the amplification of the bigger band when using the hupL specific primers. This allows for exclusive amplification of wiltype DNA – these settings emulate exclusivity of these primers for the intact hupL gene. This opens the possibility of band intensity comparation, since the final products for both pairs of primers have similar size. Having similar size implicates that under equal PCR conditions the probability of primer/template annealing and extension will have approximate values. The option for a second pair of primers was necessary and gave good results.
Even the non-linear relation between band intensities and relative concentration reported is of low relevance. There are numerous ways to reduce or even eliminate this, since the basic problem will ultimately be the quantity of the fragment DNA producing the band in the gel. One way is to reduce the number of PCR cycles – 30 cycles were used, and a decrease to 28 cycles alone would result in a theoretical reduction of 75% of produced DNA fragment. Another way, for instance, is to dilute all samples to the same degree just before applying in the electrophoresis gel.
Basically a relation must be established between: a) total genomic DNA after extraction, b) number of PCR cycles and c) quantity of DNA to be used for electrophoresis. Establishing this relation is still not done, but getting this task completed is more time consuming then technically challenging. This method has all the potential to be, in the short term, established as the de facto method for strain quantification for all competition experiments to be performed in the future. An important part of the planned work, and to be presented in short next, will require such experiments and a solid technique to reliably provide strain relative concentration data.
Discussion and Conclusions
Overall conclusions
The focus points of this work were: a) selecting, adapting and use of a simple and practical bioreactor model, b) developing strategies for short and long-term hydrogen production measurements, c) improving previously existing and explore new techniques to study competition between wild-type and mutant cells, d) selecting monitoring sensors and acquisition hardware, and e) develop software for culture monitoring and control. Of these, only d) and e) were not extensively researched. They were not forgotten, and will the referenced again in “Future developments”.
The main objective of this project was achieved: an adequate and easily operated photobioreactor was produced, its use proved fruitful already, and the basis for future successful work established.
Future developments
Molecular basis for growth and cell division in Nostoc punctiforme
Typically the aim in traditional cyanobacterial growth engineering is to maximize growth rates in order to obtain higher biomass. When obtaining specific products from cyanobacteria, like specific polysaccharides for instance, high growth rates become secondary or even an obstacle. When it comes to hydrogen evolution by cyanobacteria, it is known that in batch cultures H2 output is higher when cells are not in exponential growth.
With these facts in mind, a strategy to theoretically improve overall productivity would be obtaining cyanobacteria with altered growth rate.
Cell division in bacteria occurs by the coordinated invagination of the cell envelope layers that make up the cell wall. At least nine proteins have been identified that are required for the process of dividing a cell to compartmentalize intracellular constituents (cytokinesis) - FtsA, FtsI, FtsK, FtsL, FtsN, FtsQ, FtsW, FtsZ, and ZipA [47]. It is also known that MinC, MinD, and MinE coordinate action is required for proper placement of the division septum [48] - in prokaryotes cell division is mediated by the septal ring. In
Escherichia coli, this organelle consists of several essential division proteins, including
FtsZ, FtsA, and ZipA [49]. FtsZ and FtsA are essential for cell division in Escherichia coli and are located by the septal ring [50]. In the current model for bacterial cell division, FtsZ protein forms a ring that marks the division plane, creating a cytoskeletal framework for the subsequent action of other proteins such as FtsA. This putative protein complex ultimately generates the division septum [51].
The work concerning cyanobacteria has mostly focused in the presence and role of FtsZ and Anabaena PCC 7120 [52-54]. It has been found that a mutant lacking the ability to produce a functional FtsZ [53] is not viable – implying that septation is required for cell viability. In Anabaena PCC 7120, and according the fully sequenced genome available at Cyanobase, the following Fts proteins and genes can are present: FtsW (in all0154), FtsY (in all1759), FtsH (in all3642, all4776, all4936, and alr1261), FtsE (in alr1706), and FtsZ (in alr3858). Table 5 presents a brief summary of the presence of putative division related genes in cyanobacteria, including Anabaena PCC 7120 - the translated sequenced taken from these different genes can be useful in determining the presence of important genes in the, so far non complete*, genome of Nostoc punctiforme.
Future developments
Table 5 – Presence of different cell division related proteins in cyanobacteria. Summary of search using SRS over the SpTrEMBL database.
Organism Gene name Description SpTrEMBL accession
Anabaena PCC 7120 FTSK OR ALL7666 FtsK protein Q8ZS46
FTSE OR ALR1706 Cell-division ATP-binding protein Q8YWA9
FTSH OR ALR1261 Cell division protein Q8YXF2
FTSH OR ALL4776 Cell division protein Q8YMZ8
FTSH OR ALL3642 Cell division protein Q8YR16
FTSH OR ALL4936 Cell division protein Q8YMJ7
FTSW OR ALL0154 Cell division protein Q8Z0E4
FTSY OR ALL1759 Cell division protein Q8YW57
ALR0446 Hypothetical protein Alr0446 Q8YZL1
ALR0452 Hypothetical protein Alr0452 Q8YZK5
ALR0653 Hypothetical protein Alr0653 Q8YZ34
ALL0808 Hypothetical protein All0808 Q8YYN8
ALL0906 Hypothetical protein All0906 Q8YYE4
ALR1506 Hypothetical protein Alr1506 Q8YWT8
ALL1757 Cell-division protein Q8YW59
ALR3648 Hypothetical protein Alr3648 Q8YR10
ALR3857 Hypothetical protein Alr3857 Q8YQH2
ALR4281 Hypothetical protein Alr4281 Q8YPB7
ALR4974 Hypothetical protein Alr4974 Q8YMG0
ALL5346 Hypothetical protein All5346 Q8YLF2
ALL0473 Hypothetical protein All0473 Q8YZI7
MINC OR ALR3455 Septum site-determining protein Q8YRJ1
MIND OR ALL2033 Cell division inhibitor Q8YVE5
MIND OR ALL2797 Cell division inhibitor Q8YTC5
MIND OR ALR3456 Septum site-determining protein Q8YRJ0
MINE OR ASR3457 Septum site-determining protein Q8YRI9
Synechococcus PCC 6301 FTSW FtsW Q9R6T2
Prochlorococcus PCC 9511 FTSZ Cell division protein FtsZ Q9RLE3
Synechococcus PCC 7942 FTSZ Cell division protein FtsZ O85785
FTSY FtsY Q8GIR8
Prochlorococcus marinus FTSZ FtsZ protein Q93JX6
FTSQ FtsQ protein Q93JX7
Synechocystis PCC 6803 SLR0594 Hypothetical protein slr0594 P74738
SLL1632 Hypothetical protein sll1632 P73457
SLR0950 Hypothetical protein slr0950 P74319
SLL1482 Hypothetical protein sll1482 P74616
Synechococcus elongatus FTSH OR TLL0131 Cell division protein Q8DMI5
FTSW OR TLR0440 Cell division protein Q8DLN8
TLL0452 Tll0452 protein Q8DLN1
FTSH OR TLR0528 Cell division protein Q8DLG5
FTSH OR TLL0734 Cell division protein Q8DKW7
FTSY OR TLR0928 Cell division protein Q8DKD1
TLR1583 Tlr1583 protein Q8DIK2
FTSH OR TLL1832 Cell division protein Q8DHW1
FTSZ OR TLL2382 Cell division protein Q8DGD6
MINC OR TLR2016 Septum site-determining protein Q8DHE3
MIND OR TLR2017 Septum site-determining protein Q8DHE2
Future developments
Nostoc punctiforme has been used for several years as a model organism at Peter
Lindblad’s laboratory and the future work will focus in this organism. The available genomic data for this organism has already been searched, and genes like ftsZ (already annotated) and ftsA (not annotated at the time of the search) were found (see Table 6).
The overall goal of this project is to obtain the basic genomic and physiological knowledge in order to create mutants with restricted and/or controlled growth rates. The genomic/proteonomic data allows for either direct searches (using available databases, see Table 2, or indirect searches (using molecular tools like PCR or RT-PCR). This search should be the first step in this project.
The cell growth will be performed in photobioreactors that allow for continuous cell growth (either in fed-batch or chemostat). The presently developed and here presented growth methods are flexible and adequate for the fulfillment of the overall objective of this coming project.
* (submitted by the DOE Joint Genome Institute, in November the 7th 2002)
Table 6 – Results of Anabaena PCC 7120 aminoacid sequence BLAST [55] against the available information for Nostoc punctiforme.
Search base Definition for N. punctiforme Accession Score E value
FtsW / all0154 hypothetical protein ZP_00111434 570 e-163 FtsY / all1759 hypothetical protein ZP_00112012 699 0.0
hypothetical protein ZP_00110921 133 4e-32
FtsH / all3642 hypothetical protein ZP_00105811 1146 0.0
hypothetical protein ZP_00108866 832 0.0 hypothetical protein ZP_00111391 665 0.0 hypothetical protein ZP_00106389 500 e-142
FtsH / all4776 hypothetical protein ZP_00108866 1019 0.0
hypothetical protein ZP_00105811 817 0.0 hypothetical protein ZP_00111391 624 e-179 hypothetical protein ZP_00106389 498 e-141
FtsH / all4936 hypothetical protein ZP_00106389 692 0.0
hypothetical protein ZP_00111391 513 e-146 hypothetical protein ZP_00108866 471 e-133 hypothetical protein ZP_00105811 453 e-128
FtsH / alr1261 hypothetical protein ZP_00111391 1089 0.0
hypothetical protein ZP_00108866 624 e-180 hypothetical protein ZP_00105811 619 e-178 hypothetical protein ZP_00106389 529 e-151
FtsE / alr1706 hypothetical protein ZP_00110062 323 1e-89 FtsZ / alr3858 hypothetical protein ZP_00111461 647 0.0
Future developments
Hardware and software development for photobioreactor
The development of hardware should include the integration of sensors for pH, oxygen, temperature and optical density. All this parameters could then be at least partially controlled. For instance, a pH value could be set and maintained, or a culture could be kept within certain density values. This work could also contemplate the installation of a scale that could monitor in real time the total weight of the reactor. Knowing this value would allow for automatic compensation of medium due to sampling, for instance.
The possibilities are numerous and will rely not only on proper hardware, but also in well designed software. The construction of the reactor already had in mind the installation of some devices, but all the sensors, accessory electronics and software must be designed and assembled by a specialized team. Since it is not easy to acquire a full prepared solution, the cooperation with an institution or a company is the most effective way to achieve this goal. A cooperative work with a team of engineers would be ideal.
References
1. Hansel, A., Lindblad, P., Mini-review: Towards optimization of cyanobacteria as biotechnologically relevant producers of molecular hydrogen, a clean and renewable energy source. Applied and environmental microbiology, 1998(50): p. 153-160.
2. Benemann, J.R., The technology of biohydrogen. BioHydrogen (edited by Zaborsky et al), 1998: p. 19-30.
3. Wakayama, T., Miyake, J., Hydrogen from biomass. BioHydrogen II (edited by Miyake et al), 2001: p. 41-51.
4. Lindblad, P., Cyanobacterial H2 metabolism: knowledge and potential/strategies for a photobiotechnological production of H2. Biotecnología Aplicada, 1999(16): p. 1-10.
5. Schopf, J.W., The fossil record: tracing the roots of the cyanonbacterial lineage, in The Ecology of Cyanobacteria, B.A. Whitton, M. Potts, Editor. 2000, Kluwer Academic Publishers, Dordrecht. p. 13-35.
6. Whitton, B.A., Potts, M., Introduction to the cyanobacteria, in The Ecology of Cyanobacteria, B.A. Whitton, M. Potts, Editor. 2000, Kluwer Academic Publishers, Dordrecht. p. 13-35.
7. Fay, P., Oxygen relations of nitrogen fixation in cyanobacteria. Microbiol Rev, 1992(56): p. 340-73. 8. Gallon, J.R., Reconciliating the incompatible: N2 fixation and O2. New Phytol, 1992(122): p.
571-609.
9. Lindblad, P., Hansel, A., Oxelfelt, F., Tamagnini, P., Troshina, O., Nostoc PCC 73102 and H2 - Knowledge, Research and Biotechnological Challenges. BioHydrogen (edited by Zaborsky et al), 1998: p. 53-63.
10. Oxelfelt, F., Hydrogenases in the Cyanobacterium Nostoc sp. Strain PCC 73102, in Department of Physiological Botany. 1998, Uppsala University: Uppsala.
11. Miyake, J., The science of biohydrogen - an energetic view. BioHydrogen (edited by Zaborsky et al), 1998: p. 7-18.
12. Houchins, J., The physiology and biochemistry of hydrogen metabolism in cyanobacteria. Biochim Biophys Acta, 1984(768): p. 227-255.
13. Lambert, G., Smith, G., The hydrogen metabolism of cyanobacteria (blue-green algae). Biol Rev, 1981(56): p. 589-660.
14. Tamagnini, P., Costa, J., Almeida, L., Oliveira, M., Salema, R., Lindblad, P., Diversity of cyanobacterial hydrogenases, a molecular approach. Curr Microbiol, 2000(40): p. 356-361. 15. Stal, L., Moezelaar, R., Fermentation in cyanobacteria. FEMS Microbiol Rev, 1997(27): p.
179-211.
16. Appel, J., Phunpruch, S., Steinmüller, K., Schultz, R., The bidirectional hydrogenase of Synechocystis sp. PCC 6803 works as an electron valve during photosynthesis. Arch Microbiol, 2000(173): p. 333-338.
17. Mikheeva, L., Schmitz, O., Shestakov, S., Bothe, H., Mutants of the cyanobacterium Anabaena variabilis altered in hydrogenase activities. Z Naturforsch, 1995(50): p. 505-510.
References
18. Happe, T., Schütz, K., Böhme, H., Transcriptional and mutational analysis of the uptake hydrogenase of the filamentous cyanobacterium Anabaena variabilis ATCC 29413. J Bacteriol, 2000(182): p. 1624-1631.
19. Lopes Pinto, F., Troshina, O., Lindblad, P., A brief look at three decades of research on
cyanobacterial hydrogen evolution. International Journal of Hydrogen Energy, 2002(27): p. 1209-1215.
20. Benemann, J., Weare, N., Hydrogen evolution by nitrogen-fixing Anabaena cylindrica cultures. Science, 1974(184): p. 174-175.
21. Weissman, J., Benemann, J., Hydrogen production by nitrogen-starved cultures of Anabaena cylindrica. Appl Environ Microbiol, 1977(33): p. 123-131.
22. Daday, A., Platz, R., Smith, G., Anaerobic and aerobic hydrogen gas formation by the blue green alga Anabaena cylindrica. Appl Environ Microbiol, 1977(34): p. 478-483.
23. Lambert, G., Smith, G., Hydrogen formation by marine blue-green algae. FEBS Lett, 1977(83): p. 159-162.
24. Jeffries, T., Timourian, H., Ward, R., Hydrogen production by Anabaena cylindrica: effects of varying ammonium and ferric ions, pH, and light. Appl Environ Microbiol, 1978(35): p. 704-710. 25. Daday, A., Lambert, R., Smith, G., Measurement in vivo of hydrogenase-catalysed hydrogen
evolution in the presence of nitrogenase enzyme in cyanobacteria. Biochem J, 1979(177): p. 139-144.
26. Lambert, G., Daday, A., Smith, G., Duration of hydrogen formation by Anabaena cylindrica B629 in atmospheres of argon, air, and nitrogen. Appl Envirom Microbiol, 1979(38): p. 530-536. 27. Masukawa, H., Nakamura, K., Mochimaru, M., Sakurai, H., Photobiological hydrogen production
and nitrogenase activity in some heterocystous cyanobacteria. BioHydrogen II (edited by Miyake et al), 2001: p. 63-66.
28. Asada, Y., Tonomura, K., Nakayma, O., Hydrogen evolution by an isolated strain of Anabaena. J Ferment Technol, 1979(57): p. 280-286.
29. Famiglietti, M., Hochkoeppler, A., Luisi, P., Surfactant-induced hydrogen production in cyanobacteria. Biotechnol Bioeng, 1993(42): p. 1014-1018.
30. Markov, S., Bazin, M., Hall, D., Hydrogen photoproduction and carbon dioxide uptake by immobilized Anabaena variabilis in a hollow-fiber photobioreactor. Enz Microbial Technol, 1995(17): p. 306-310.
31. Sveshnikov, D., Sveshnikova, N., Rao, K., Hall, D., Hydrogen metabolism of mutant forms of Anabaena variabilis in continuous cultures and under nutritional stress. Microbiol Lett, 1997(147): p. 297-301.
32. Fedorov, A., Tsygankov, A., Rao, K., Hall, D., Production of hydrogen by an Anabaena variabilis mutant in photobioreactor under aerobic outdoor conditions. BioHydrogen II (edited by Miyake et al), 2001: p. 223-228.
33. Tsygankov, A., Serebryakova, L., Rao, K., Hall, D., Acetylene reduction and hydrogen photoproduction by wild-type and mutant strains of Anabaena at different CO2 and O2
![Table 1. Classification of hydrogen producing bacteria. Taken from [3].](https://thumb-eu.123doks.com/thumbv2/123dok_br/17963451.854574/5.892.143.788.522.1128/table-classification-hydrogen-producing-bacteria-taken.webp)

![Table 4. Maximum hydrogen evolution by different Anabaena strains. Adapted from [19].](https://thumb-eu.123doks.com/thumbv2/123dok_br/17963451.854574/11.892.86.826.179.1071/table-maximum-hydrogen-evolution-different-anabaena-strains-adapted.webp)