APPLICABILITY OF A DISTRIBUTED WATERSHED
POLLUTION MODEL IN A DATA-POOR
ENVIRONMENT IN SANTA CATARINA STATE, BRAZIL
(1)Ivan Luiz Zilli Bacic(2), David G. Rossiter(3) & Christiaan Mathias Mannaerts(3)
SUMMARY
Intensification of agricultural production without a sound management and regulations can lead to severe environmental problems, as in Western Santa Catarina State, Brazil, where intensive swine production has caused large accumulations of manure and consequently water pollution. Natural resource scientists are asked by decision-makers for advice on management and regulatory decisions. Distributed environmental models are useful tools, since they can be used to explore consequences of various management practices. However, in many areas of the world, quantitative data for model calibration and validation are lacking. The data-intensive distributed environmental model AgNPS was applied in a data-poor environment, the upper catchment (2,520 ha) of the Ariranhazinho River, near the city of Seara, in Santa Catarina State. Steps included data preparation, cell size selection, sensitivity analysis, model calibration and application to different management scenarios. The model was calibrated based on a best guess for model parameters and on a pragmatic sensitivity analysis. The parameters were adjusted to match model outputs (runoff volume, peak runoff rate and sediment concentration) closely with the sparse observed data. A modelling grid cell resolution of 150 m adduced appropriate and computer-fit results. The rainfall runoff response of the AgNPS model was calibrated using three separate rainfall ranges (< 25, 25–60, > 60 mm). Predicted sediment concentrations were consistently six to ten times higher than observed, probably due to sediment trapping along vegetated channel banks. Predicted N and P concentrations in stream water ranged from just below to well above regulatory norms. Expert knowledge of the area, in addition to experience reported in the literature, was able to compensate in part for limited calibration data. Several scenarios (actual, recommended and excessive manure applications, and point
(1) Received for publication in november of 2006 and accepted in april of 2008.
(2) Researcher of Empresa de Pesquisa Agropecuária e Extensão Rural de Santa Catarina S.A. (EPAGRI), Centro de Informa-ções de Recursos Ambientais e de Hidrometeorologia de Santa Catarina (CIRAM), Caixa Postal 502, CEP 88034-901 Florianópolis (SC). E-mail: bacic@epagri.sc.gov.br
source pollution from swine operations) could be compared by the model, using a relative ranking rather than quantitative predictions.
Index terms: soil and water pollution, AgNPS, pig manure, simulation modeling, model calibration, scenario analysis, local expert knowledge.
RESUMO: APLICABILIDADE DE UM MODELO DE POLUIÇÃO PARA BACIAS HIDROGRÁFICAS EM UM AMBIENTE POBRE EM DADOS NO ESTADO DE SANTA CATARINA, BRASIL
A intensificação da produção agrícola sem o acompanhamento de práticas adequadas de manejo e de uma sólida regulamentação da atividade pode levar a sérios problemas ambientais, como os observados no oeste do Estado de Santa Catarina, Brasil, onde a produção intensiva de suínos tem causado grande acúmulo de dejetos e, conseqüentemente, poluição da água. Os tomadores de decisões freqüentemente questionam os pesquisadores da área de recursos naturais sobre práticas de manejo e decisões relacionadas à legislação ambiental. Para ajudar a responder a essas perguntas, modelos de simulação do ambiente podem ser ferramentas úteis, uma vez que podem ser usados para explorar as conseqüências de diversas práticas de manejo. No entanto, em muitas regiões do mundo, dados quantitativos adequados para calibração e validação de modelos não estão disponíveis. Este estudo avaliou a possibilidade da aplicação de um modelo ambiental altamente exigente em dados (AgNPS), integrado a um sistema geográfico de informações, em um ambiente relativamente pobre em dados. O trabalho foi realizado na microbacia do Rio Ariranhazinho, com área de 2.520 ha, localizada no município de Seara, no Estado de Santa Catarina. Foram descritos os passos necessários para que o modelo pudesse ser aplicado nesse ambiente, incluindo: preparação dos dados, seleção do tamanho de células, análise de sensibilidade, calibração e aplicação em diferentes cenários. O modelo foi calibrado usando-se uma “aproximação realista” para determinação dos valores dos parâmetros necessários e realizando-se uma análise de sensibilidade pragmática em que se utilizaram possíveis limites para os referidos parâmetros, considerando-se cenários otimista e pessimista. Em seguida, os parâmetros foram ajustados para que os resultados da aplicação do modelo se aproximassem dos dados observados. Não foi possível calibrar o modelo para toda a série de chuvas considerada, a qual foi então dividida em três faixas: < 25, 25–60 e > 60 mm. As previsões de concentração de sedimentos em água foram consistentemente de seis a dez vezes maiores do que os valores observados, possivelmente devido à captura de sedimentos pela vegetação próxima dos rios e drenos – situação não considerada pelo modelo. As estimativas de concentrações de N e P, ajustadas conforme as proporções empíricas encontradas para os sedimentos, variaram desde pouco abaixo até bastante acima dos padrões de qualidade de água estabelecidos em lei. O estudo demonstrou que o conhecimento técnico da área, somado às experiências relatadas na literatura disponível, foi capaz de compensar em grande parte a deficiência dos dados para calibração. Foi então possível aplicar o modelo para uma classificação relativa dos diferentes cenários em estudos comparativos, mas não para previsões quantitativas precisas.
Termos de indexação: poluição do solo e da água, AgNPS, dejetos de suínos, simulação, calibração de modelo, análise de cenários, conhecimento especializado local.
INTRODUCTION
Intensification of agricultural production may lead to higher living standards of the producers and more wealth in a country. However, if not coupled with sound environmental management, severe environmental problems may arise, both at the farm level and off-site. This is especially true in transitional economies such as Santa Catarina State, Southern Brazil, with a well-developed market system, but languid environmental legislation or enforcement. An
example is intensive swine production, causing large accumulations of manure and consequently water pollution (EPAGRI, 2002). Indeed, information on the environmental impact, in particular water pollution, is in high demand by decision-makers, both farmers and policy makers, in search of enhanced management systems and land use zoning (Bacic et al., 2003).
locations, but for some time the trend has been towards spatially more explicit and quantitative predictions, based on distributed environmental models. Models are useful tools to cope with the complexity of reality in simulations of actual and potential management practices and exploring their consequences. One worldwide used model for such purposes is the AgNPS or Agricultural Non Point Source pollution model (Young et al., 1989). Past applications included the assessment of soil erosion (Prato & Shi, 1990; Engel et al., 1993; Mitchell et al., 1993; Rainis et al., 2002; Walling et al., 2003), prediction of surface runoff (Engel et al., 1993; Mitchell et al., 1993; Grunwald & Norton, 2000), assessment of allowable nutrient loads (Pekarova et al., 1999; Rode & Lindenschmidt, 2001), prediction of effects of different land use management practices (Prato & Shi, 1990; Mostaghimi et al., 1997) and simulation of the effect of expanded swine production on P transport and water quality (Sauer et al., 2003). In Santa Catarina, a series of studies have investigated the use of pig manure as fertilizer (Dartora et al., 1998) but not the possible environmental implications. Moreover, quantitative and spatial information on current and potential pollution to support planning and decision-making is lacking. Santa Catarina State is a region where application of a distributed environmental model might have a major effect on decision-making (Bacic, 2003). It could permit a quantitative prediction of the environmental quality of a watershed in different scenarios. A distributed model is also a useful tool for the visualization and relative ranking of scenarios in interactive decision- making.
AgNPS and similar models are too often applied for predictions without robust model calibration and validation. A related issue is the selection of the modelling grid cell size of a distributed model, which is known to affect model predictions (Panuska et al., 1991; Vieux & Needham, 1993).
Finally, in many areas of the world where model results could be useful, as in Santa Catarina State, data for appropriate model calibration are lacking. This study therefore examined how a data-intensive distributed model can be applied in a relatively data-poor environment, describing the steps to apply the AgNPS model in a Geographic Information System (GIS) setting, in order to analyze impacts of agricultural practices i.e., intensive swine production on surface water quality, including an evaluation of management scenarios at the watershed scale.
STUDY AREA
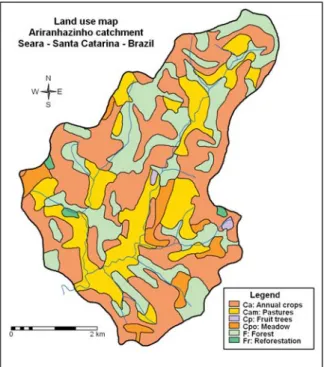
The study area is the upper catchment (2,520 ha) of the Ariranhazinho River, with the outlet at 27 ° 10 ’ S – 52 ° 22 ’ W (Figure 1). It is representative for most of the Western region of Santa Catarina State, Brazil (25,300 km2). Elevation ranges from 385 to
930 m.a.s.l. and average land slope is 30 %. Principal land use (about 40 % of the area) are annual crops,
mainly maize (Figure 2). Almost 30 % of the catchment area is further covered by secondary forest and more than 20 % is under pasture (Tassinari et al., 1997). The underlying geological formation is the “Serra Geral”, composed of sub-parallel layers of dark grayish to black basalt (Silva & Bortoluzzi, 1987). Figure 3 shows the spatial distribution of the physiographic units according to Tassinari et al., 1997. Predominant soils are “Cambissolos” (physiographic units E1 – Erosional Hillslope, E5 – Colluvial-Erosional Hillslope and FV1 – Erosional Valley) and “Nitossolos” (Physiographic units C4 - Summit and FV5 – Colluvial-Erosional Valley) according to the Brazilian system (Embrapa, 1999), corresponding respectively to the thermic families of Oxic Dystrudepts and Typic Kanhapludults in the USDA system (USDA, 1999). The soils are moderately deep to deep, moderately well to well-drained and have moderate to high infiltration rates, which place them in hydrologic soil group B, as defined by USDA (1986). The soil texture classes and the proportion of clay, silt and sand of the representative soil of each physiographic unit are shown in table 1.
Average annual precipitation and temperature at the nearby Meteorological Station Chapecó (located at 27 ° 07 ’ S – 52 ° 37 ’ W – 679 m.a.s.l., about 40 km west of the study area, in the same climatic zone) are 1,740 mm and 18.7 °C, respectively. Average monthly
2003). Estimated total amount of manure produced is 25,700 m3 per year. The average manure storage
pond capacity is around 170 m3 (Instituto Cepa/SC,
2001). The watershed area was selected because its river stages at the outlet and water quality were monitored and soil and land use information were available.
MODELLING PROTOCOL Software
AgNPS
AgNPS, the “Agricultural Non-Point Source pollution” model was developed to provide information on surface water quality and analyze pollution problems in agricultural watersheds for single storm events (Young et al., 1987). The model can also deal with point source pollution from e.g. feedlots, which in the study area resemble the concentrated swine production units. The AgNPS v. 5.0 model was selected for the following reasons: (1) model outputs closely matched the information required by decision-makers; (2) availability of data for calibration; (3) required ancillary input data were obtainable; (4) the extensive worldwide use in similar cases and (5) availability of the spatial modelling interface GRIPS (Mannaerts et al., 2002).
GRIPS
The distributed input data layers were prepared using GRIPS, a “Geo-Referenced Interface Package” for the AgNPS v. 5.0 model. This computer program uses the ILWIS v. 3.2 Academic Geographic Information System (ITC, 2002) to automatically generate digital terrain and land surface data layers from basic GIS vector maps at a user-defined modelling cell size as distributed AgNPS input data. It also creates the AgNPS model input data files. The AgNPS 5.0 model is run within the interface and model outputs can be visualized as GIS maps or tables for further analysis. GRIPS uses a watershed boundary, a stream network and a contour line map to generate the following topographic AgNPS inputs: cell number, receiving cell, flow direction, slope gradient, slope shape, slope length, channel indicator, channel slope and length. However, GRIPS cannot always prepare flawless input data layers, depending on the original digital contour elevation model. In particular, the analyst must verify flow continuity and direction from cell to cell and remove any sinks. The watershed boundary, stream network and contour line data were extracted from a topographic map of Seara (scale 1:50,000, 20 m contour lines), produced by the Brazilian Army.
Model input data preparation
In addition to the inputs produced using GRIPS mentioned in the previous section, AgNPS must be parameterized with values that can be entered as a single value for the whole watershed, cell by cell or temperatures are highest in January and February
(23.0 and 22.8 °C) and lowest in June and July (13.9 and 14.4 °C) (Tassinari et al., 1997).
Almost all farmers raise pigs and produce most of the animals’ feed (mostly maize) on their farmland. Most producers are integrated in agro-industries, either for the complete production cycle, for the sow and piglet stage, or for the finishing phase (Bacic,
Figure 2. Land use map of Ariranhazinho catchment, Seara, Santa Catarina, Brazil (Source: Tassinari et al., 1997).
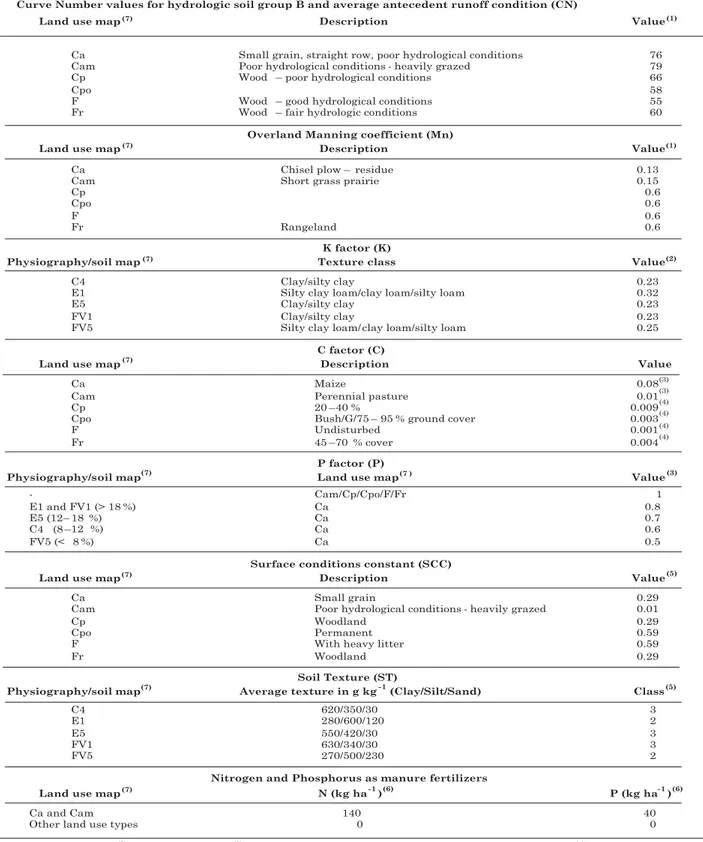
Table 1. Criteria and sources used to establish the initial parameter values as input data for the “best guess” scenario, assigning to each cell in AgNPS (Agricultural Non Point Source pollution model) the corresponding value in the maps. This was called “best guess” scenario, as reality-near as possible, according to available data and authors’ experience, i.e. prior to model calibration
using a map, assigning the corresponding value in the map to each cell. Tables 1 and 2 show criteria and sources used to establish the initial parameter values as input maps and single values, respectively. This was called “best guess” scenario, adapted as close as possible to reality according to available data and authors’ experience, prior to model calibration. Model parameter estimation crucially relies on field experience and knowledge of soil-water-land use relations in the region where the model is to be applied. Table 3 shows the highest and lowest realistic parameter limits for AgNPS map inputs in relation to possible variability in the study area (e.g. soil group, hydrological conditions, organic matter contents, texture classes and management practices), called “optimistic” and “pessimistic” scenarios, respectively. The maps of land use, physiography and soil used are from Tassinari et al. (1997).
Observed rainfall and water data
The outlet of the watershed was instrumented from April 1998 to December 2000. Rainfall, water level and turbidity were measured daily at 8:00 AM. The observer’s reliability was not verified. Approximately every week until the middle of 1999 and every fortnight until December 2000, water samples were collected and analyzed by EPAGRI, the State Agricultural Research and Rural Extension Service, for pH, biochemical oxygen demand (BOD), dissolved oxygen, forms of bacterial coli forms and concentration of sediments, N and P. Sediment concentration at the catchment outlet was measured by EPAGRI according to Clesceri et al. (1998) during one year to establish a correlation to turbidity. A satisfactory
Table 3. Highest and lowest realistic parameter limits for AgNPS (Agricultural Non Point Source pollution model) map inputs in relation to
possible variability in the study area (1). These
were called “optimistic” and “pessimistic” scenarios
(1) Values vary as a function of variability in soil groups (B and C), hydrological conditions, organic matter contents, texture classes and management practices in the study area. Ca: annual crops; Cam: pastures; Cp: fruit trees; Cpo: meadow; F: forest; Fr: reforestation; C4: Summit; E1: Erosional Hillslope; E5: Colluvial-Erosional Hillslope; FV1: Erosional Valley; FV5: Colluvial-Erosional Valley.
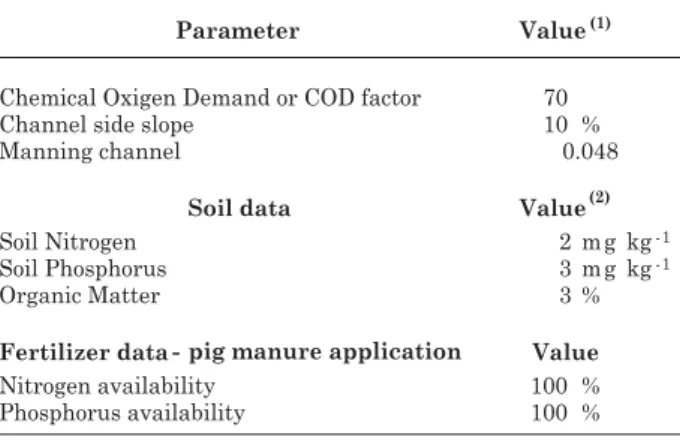
Table 2. Criteria and sources used to establish the initial parameterization for AgNPS (Agricultural Non Point Source pollution model) single-value inputs, assigning a single value for the whole watershed for the “best guess” scenario. This was called “best guess” scenario, as reality-near as possible, according to available data and authors’ experience, i.e. prior to model calibration
linear regression (R² = 0.93), was obtained and used to convert turbidity measurements to sediment concentrations.
Observed water levels were converted to discharge or runoff rate (in m3 s-1) based on a rating curve
derived from current meter gauging experiments by EPAGRI. A stable cross section profile at the gauging station was observed. To obtain direct storm runoff volumes and peak runoff rates to compare to AgNPS simulated runoff volumes and peak flow rates, a simple base flow separation was applied to the observed flow data. This was based on an analysis of the recession time characteristic of the stream flow hydrographs of the catchment (Wilson, 1990).
Use of rainfall dataset
The rainfall dataset was split into two seasons: November to April and May to October, representing respectively summer and winter. Summer rainfall is characterized by localized convective storm events, whereas during winter, large frontal rainfall depressions are common. The localized summer storm events were considered inappropriate for rainfall runoff calibration of the AgNPS model, due to the uncertainty of the area extent of these rainfalls. This observation was confirmed by the local observer monitoring rainfall and stream flow at the catchment outlet.
Eliminating unreliable and incomplete data and selecting storm events
To evaluate the consistency of the rainfall data collected at the Ariranhazinho catchment outlet, monthly precipitation data were compared to long-term data sets of the Meteorological station Chapecó. Storm events used in further analysis and for calibration were selected by expert judgment, selecting those that were most suitable for the rainfall runoff modelling purpose, e.g., single storm runoff hydrographs. Small storms with no effect on the river water level as well as large 48 - 72 h rainfall events with composite hydrographs were avoided, as AgNPS only simulates single events.
Definition of cell size
The selection of an appropriate model cell size was based on various considerations: (1) model manageability, considering the intended use for interactive scenario analysis with clients; (2) limitations due to model algorithms (i.e. leading to unrealistic process representations at certain cell sizes); and (3) spatial scale of available input data and information quality. Cell sizes from 50 by 50 m (0.25 ha) to 400 by 400 m (16 ha) were evaluated.
Sensitivity analysis
A sensitivity analysis was performed using the realistic limit values of the optimistic and pessimistic scenarios data. Beginning at the “best guess” scenario
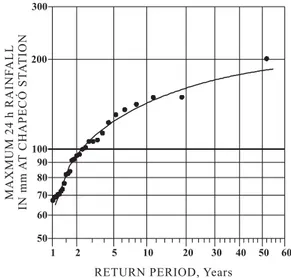
values, the values of the following input variables were varied one factor at a time, keeping all others constant: Curve Number or CN, Manning roughness coefficient, soil erodibility or K factor, crop management and vegetation cover or C factor, structural soil conservation practice or P factor and the surface conditions constant influencing overland flow velocity. Possible interactions between factors were not assessed. Nine storm rainfall depths were used: 12.5, 20, 25, 32.5, 40, 60, 80, 100, and 120 mm. For small storms, no runoff or sediment transport was expected. The large storm represented the annual 24 h storm with a return period of 5 years (Figure 4) for the region, as fitted by a Gumbel extreme value distribution (Stedinger et al., 1993).
Calibration
It was not possible to calibrate the model for nutrient transport in stream flow, because this required information was not available. In particular, knowledge on times and amounts of manure application to the field, and times when excess manure is released from the storage ponds to the streams is essential for the calibration of nutrient loads in runoff. It was assumed that if AgNPS was able to adequately describe sediment movements and transport in the watershed system, it would be reasonable to expect a fair simulation of dissolved chemical loads as well. In addition, an important part of chemicals is transported as sediment-bound chemical matter. Therefore, the model was calibrated for peak runoff rate and sediment concentration, which are both directly related to pollutant transport.
The greatest difficulty in calibration was the limited dataset and reliability of the rainfall and stream flow gauging measurements. The following strategy was adopted: (1) establishment of best guess, optimistic and pessimistic scenarios data values
(section Model input data preparation); (2) performance of pragmatic sensitivity analysis of parameters that affected model results at local conditions (Sensitivity analysis Section); and (3) comparison of the modeling scenarios to observations and fitting of the most sensitive parameters so that model output matched observed values for the selected storms. The three scenarios were simulated with all 54 selected storms (rainfall depth between 8.2 and 108.4 mm). The coefficient of Nash & Sutcliffe (1970) was used to evaluate model performance.
As explained in the section “Use of rainfall dataset”, rainfall data of the winter season were used for model calibration. It is believed that winter calibration is also valid for summer conditions in this subtropical climate. The soil in the region is covered with actively growing vegetation all year round, and consequently soil moisture conditions, infiltration and runoff rates are similar in both seasons.
Scenario analysis
Following calibration of the model for peak runoff rate and sediment concentrations, the following scenarios were formulated to apply the model and evaluate water pollution: (1) realistic manure application: current swine density, with pig manure production in the catchment distributed homogeneously over annual crops and pasture at a rate of 15 m3 ha-1;
(2) recommended manure application, i.e. pig manure applied to annual crops and pasture according to recommended amounts, i.e. 60 m3 ha-1 (Dartora et al.,
1998); (3) exaggerated manure application, i.e. manure application to annual crops and pasture at four times the recommended rate; (4) point pollution sources in combination with realistic manure application, i.e. direct discharge from two manure storage ponds to streams, combined with realistic manure application. All scenarios were simulated for three storm sizes: small (Pt24 = 20 mm), medium (Pt24
= 40 mm) and large (Pt24 = 80 mm).
RESULTS AND DISCUSSION Observed rainfall and runoff data
In a comparison of rainfall data of the station at the Ariranhazinho catchment outlet and the Meteorological station Chapecó the monthly rainfall pattern was similar, except in May 1998. This increased confidence in local observations. A missing rainfall measurement could be identified in May 1998, which consistently affected watershed runoff. For further analysis this month was therefore removed from the dataset.
Figure 5 shows the observed precipitation and direct catchment runoff rate using winter season rainfall data. After removing incomplete and unreliable data, 54 events were selected for calibration, from a total of 144 rainfall events.
Effect of cell size
First, the model manageability was considered. Depending on the catchment size, the determination of a small cell size can lead to unnecessary detail and slow model execution, considering that the model can be part of an interactive scenario exploration with decision makers. A 2.25 ha cell size resulted in a manageable number of 1,115 cells for the study catchment. It takes about 40 sec to convert data in GRIPS, run the model in AgNPS and visualize outputs. A reduction of the cell size to 0.25 ha would require over 10,000 cells, and processing would take about five minutes, which is too long for interactive use, for example in meetings with decision-makers.
Cell size in combination with the drainage network density and digital terrain model also determines overland flow length as well as channel length and slope generated by the GIS flow direction algorithms. In turn, these variables affect the time of concentration and peak runoff rate calculation in AgNPS. Time of concentration calculated in AgNPS for different cell sizes were compared to values obtained from standard engineering hydrology using watershed lag time equations (Linsley et al., 1982). A cell size of 2.25 ha achieved appropriate results.
Finally, cell size was compared to input data resolution. The scale of soil and land use maps is 1:25,000, corresponding to a minimum mapping unit resolution of 2.5 ha (Forbes et al., 1982) and comparable to the selected cell size of 150 by 150 m. Less than 3.7 % of the area corresponds to soil map units smaller than 9 ha, which can be represented by approximately 4 grid cells at this resolution.
A cell size of 2.25 ha was therefore determined for modeling the catchment.
Sensitivity to input data
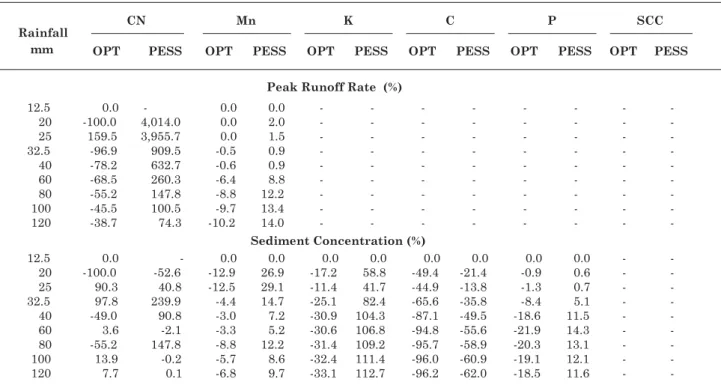
Results of a sensitivity analysis of the model output variables, peak runoff rate and sediment concentration to input data variation are summarized
in table 4. Peak runoff rate calculations are primarily affected by the Curve Number parameter. Although the relative sensitivity decreases with increasing storm size, the sensitivity remains high even for large storms. The Manning surface roughness coefficient has a smaller effect on calculated peak runoff rates. Sediment calculations are primarily affected by changes in Curve Number and variation in soil erodibility and the cover management factors in the erosion component of AgNPS.
Calibration
The model was calibrated for runoff volume, peak runoff rate and sediment concentration using observed daily rainfall, stream flow, sediment and nutrient concentration data from the period 01-Apr-1998 to 31-Dec-2000. From this time series, 54 daily events were selected, representing individual storms and covering the observed rainfall range (Figure 5) in the model performance analysis. When applying the best guess scenario input value data set (Table 1), good runoff volume and peak rate estimations were obtained for medium-sized storm events (25–60 mm). For small storms (0–25 mm), the model underestimated runoff volume and peak flow, whereas for large rainfall events (60–120 mm), the model overestimated these runoff volumes and peak rates. This model behavior can be attributed to the Curve Number method for estimation of runoff volume and the direct effect on the modeled peak runoff rate. This is consistent with other calibration attempts (Mitchell et al., 1993). Some
authors propose the exclusion of small events when calibrating the AgNPS model (Grunwald & Norton, 2000), because of their minor contribution to runoff and consequently sediment and nutrient transport.
The solution for model validation used here was a calibration of the model for three separate storm sizes, i.e., small (Pt24 < 25 mm), medium-sized (25 < Pt24 <
60 mm) and large storms (Pt24 > 60 mm). For small
rainfall events, the observed and simulated values fitted best when using the pessimistic scenario input data. For medium-sized storms, the best guess scenario data and for large storms, the optimistic scenario data values led to the best model performance (Figure 6). Model efficiency based on the Nash & Sutcliffe (1970) criterion (0.02, 0.10 and 0.85 respectively) was significantly higher than efficiencies obtained with a single calibration using a single scenario for the entire rainfall range (-13.09, -0.04 and 0.85, respectively).
When analyzing model behavior for sediment concentration, some AgNPS model inconsistencies were observed when simulating storm events around the rainfall threshold for runoff generation (Pt24 < 12 mm). Although no overland flow is
simulated by the model, a minimal channel flow is predicted, probably as a result of initial conditions internal to AgNPS. This resulted in unrealistically high values for calculated sediment concentration for these small storms, which were therefore discarded in the analysis of sediment concentration.
Table 4. Sensitivity analysis for the model output variables peak runoff rate and sediment concentration to input data variation. Results show model output variation (%) of “best guess” scenario values
Using the same parameter sets as for best prediction of runoff and flow rate, AgNPS significantly overestimated sediment concentration in all cases. When changing the K, C and P soil loss factor values in the model to optimistic scenario values (Table 3), the calculated values still exceeded the observed by factors of 10.2, 6.0 and 7.6, respectively, for the three storm ranges. These overestimates may be explained by reduced sediment delivery to the channel system due to sediment trapping along vegetated channel
banks and densely vegetated riparian areas, as it is typically observed in this tropical region. No parameter adjustment is possible, since runoff and flow would be biased. Instead, a modification of the model structure would be needed to reflect erosion, sediment delivery and transport mechanisms for these conditions more consistently. This task was beyond the scope of this study, so it was necessary to find an ad hoc solution for the scenario analysis. Figure 7 shows simulated versus observed sediment
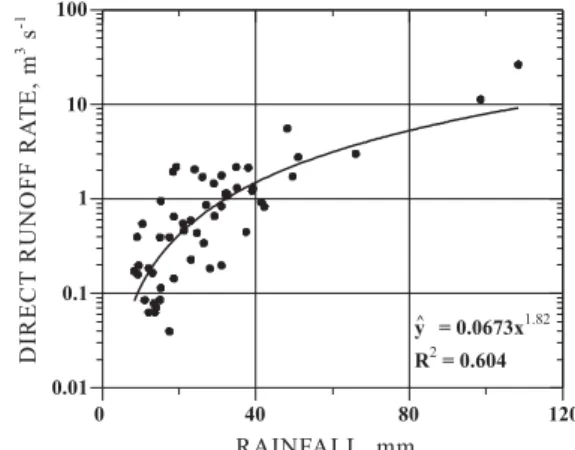
Figure 7. Observed and simulated sediment concentrations for the three rainfall ranges (0–25; 25–60; > 60 mm), using the optimistic scenario as model input data set.
concentrations as related to rainfall, using the optimistic scenario as model input dataset. The values were obtained by dividing the simulated values by the above factors for each storm range. This permitted a rough prediction of sediment delivery in the watershed with AgNPS for the whole range of observed rainfall conditions.
Scenario analysis
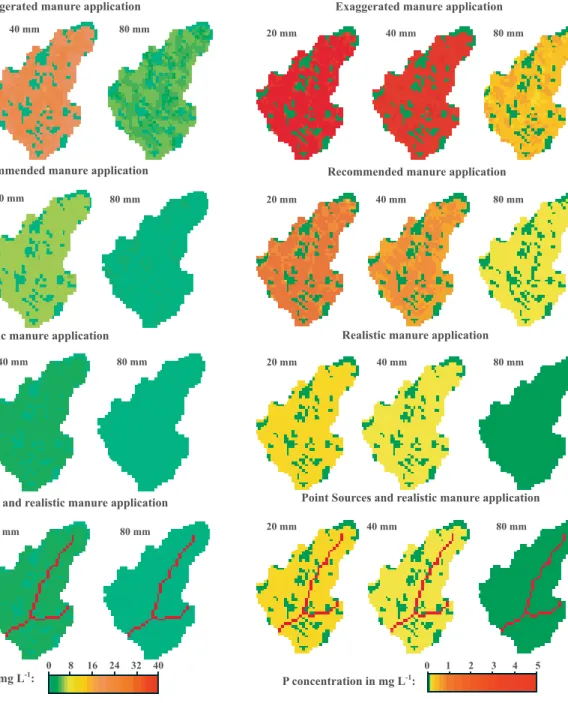
Spatial patterns of N and P runoff concentrations in the different scenarios are shown in figures 8 and 9. Simulated values were divided by the storm size ratios as explained above, except for direct manure flow into the streams from point sources, which is
Figure 8. Spatial patterns of simulated N concentration values in runoff for three different storm sizes (20 mm, 40 mm and 80 mm) and four scenarios: (1) exaggerated manure application
(240 m3 ha-1); (2) recommended manure
application (60 m3 ha-1); (3) realistic manure
application (15 m3 ha-1); and (4) point pollution
sources (direct discharge from two manure storage ponds to streams) in combination with realistic manure application.
Figure 9. Spatial patterns of simulated P concentration values in runoff for three different storm sizes (20 mm, 40 mm and 80 mm) and four scenarios: (1) exaggerated manure application
(240 m3 ha-1); (2) recommended manure
application (60 m3 ha-1); (3) realistic manure
application (15 m3 ha-1); and (4) point pollution
not related to upland erosion and nutrient runoff from farmland. Point sources and their location directly affect N and P concentrations in stream flow and drainage network (figures 8 and 9).
According to regulations in Santa Catarina state, total acceptable N and P concentrations in water are 11.5 and 0.025 mg L-1, respectively. The figures
indicate that predicted N and P concentrations are considerably higher in the exaggerated manure application scenario, aside from large storm events, where the rainfall dilution effect becomes important. This scenario can accordingly be rated “high pollution risk”. At manure application according to recommendations, predicted N and P concentrations are lower, but above regulation level for phosphorus. This scenario with adequate manure management practices such as soil incorporation by disk plowing could be rated “medium pollution risk”. Finally, the realistic manure application scenario shows simulated N concentration values far below regulation levels and simulated values for P close to the limit. This scenario could be considered a “low pollution risk”, if satisfactorily managed.
In the studied data-poor environment, it was not possible to fully validate the calculated values for nutrient pollution. Still, simulated values show that water pollution in the catchment can be mainly attributed to improper waste management practices, rather than to the high numbers of animals, as most people in the region and decision makers erroneously suppose (Bacic, 2003). For instance, the model predicts that water pollution from just two single large point sources might exceed the pollution expected from exaggerated manure application, corresponding to 16 times the current manure production in the whole catchment. These findings as well as other scenarios should be used in interactive decision-making in Santa Catarina.
CONCLUSIONS
1. This paper deals with the applicability of a data-intensive watershed erosion and water quality model in a relatively data-poor environment. It demonstrates that with a limited observation dataset, it is possible to apply a distributed environmental model such as AgNPS, for relative ranking of environmental management scenarios in a comparative way.
2. Comparison of rainfall data collected at the Ariranhazinho catchment outlet with data of a nearby meteorological station in combination with expert knowledge provided the necessary confidence to use the rainfall records in further regional analysis.
3. The pragmatic sensitivity analysis proved helpful, as it allowed identification of sensitive input parameters of the AgNPS model under the local conditions.
4. The strategy adopted for calibration of rainfall runoff and erosion sediment components of the model showed that the use of a limited measurement dataset in combination with expert knowledge of the area and literature information partly compensates for limited data. This strategy can be useful in many areas of the world where data and financial or human resources for detailed model calibration are lacking. Direct application of models without careful parameter estimation and calibration usually leads to high uncertainties in model results and associated predictions and recommendations. Even if predictions here are not particularly accurate, the simulations can be used for semi-quantitative evaluation of water pollution for the different scenarios. However, for studies requiring accurate quantitative predictions (e.g. regulatory projects), a complete model evaluation, including an accurate detailed dataset for calibration and model validation is required. In addition, the model itself may need modification for environmental conditions not foreseen by the model developers, e.g. for the sediment trapping observed in this study area.
5. The uncertainties related to the time and amount of pollutant releases from the sources (i.e. manure applications to farmland and direct releases from the storage ponds) by the farmers, in combination with only daily gauging and occasional sampling of water quality at the watershed outlet, did not permit a full verification of AgNPS simulations of nonpoint and point source impacts. However, modeling scenarios based on realistic pollutant emissions suggest that the practice of storage pond release to the river system significantly affects downstream water quality and nutrient export.
6. An interactive analysis could be a powerful tool for decision-makers in the area, supporting both farmers and policy makers in planning and decision-making on management practices aimed at reducing pollution problems. For instance, if appropriate management practices and actions are implemented, the number of animals in the catchment might even increase (e.g., a collective plan to transport and spread manure).
ACKNOWLEDGEMENTS
This work was funded by the Coordenação de Aperfeiçoamento de Pessoal de Nível Superior (CAPES), the International Institute for Geo-Information Science and Earth Observation (ITC) and the Empresa de Pesquisa Agropecuária e Extensão Rural de Santa Catarina (EPAGRI). The authors wish to thank Ing. Ivan Tadeu Baldissera, MSc. for the support in field information collection and analysis and Prof. Dr. ir. Arnold K. Bregt for his helpful suggestions and comments.
LITERATURE CITED
BACIC, I.L.Z. Demand-driven land evaluation: With case studies in Santa Catarina, Brazil. Wageningen, Wageningen University and ITC, 2003. 159p. (Tese de Doutorado)
BACIC, I.L.Z.; ROSSITER, D.G. & BREGT, A.K. The use of land evaluation information by land use planners and decision-makers: A case study in Santa Catarina, Brazil. Soil Use Manag., 19: 12-18, 2003.
CLESCERI, L.S.; GREEMBERG, A.E. & EATON, A.D., eds. Standard methods for the examination of water and wastewater. Washington, American Public Health Association, 1998. 1268p.
DARTORA, V.; PERDOMO, C.C. & TUMELERO, I.L. Manejo de dejetos de suínos. Concórdia, Embrapa/ Emater. Bol. Inf., 7:4-33, 1998.
EMPRESA BRASILEIRA DE PESQUISA AGROPECUÁRIA -EMBRAPA. Centro Nacional de Pesquisa de Solos. Sistema brasileiro de classificação de solos. Brasília, Embrapa/Produção de Informação, 1999. 412p.
ENGEL, B.A.; SRINIVASAN, R.; ARNOLD, J.; REWERTS, C. & BROWN, S.J. Nonpoint source (NPS) pollution modeling using models integrated with geographic information systems (GIS). Water Sci. Technol., 28:685-690, 1993.
EMPRESA DE PESQUISA AGROPECUÁRIA E EXTENSÃO RURAL DE SANTA CATARINA - EPAGRI. Pig manure recycling in agriculture. 2002 [Online] (verified February 6).
FORBES, T.R.; ROSSITER, D. & van WAMBEKE, A. Guidelines for evaluating the adequacy of soil resource inventories. New York, Cornell University Department of Agronomy, 1982.51p.
GRUNWALD, S. & NORTON, L.D. Calibration and validation of a non-point source pollution model. Agric. Water Manag., 45:17-39, 2000.
INSTITUTO CEPA/SC. Diagnóstico rural. Florianópolis, 2001. ITC. ILWIS v.3.2. Academic. The Integrated Land & Water
Information System. Enschede, 2002. Software.
LINSLEY, R.K.; KOHLER, M.A. & PAULHUS, J.L.H. Hydrology for engineers New York, McGraw-Hill, 1982. 508p.
MAIDMENT, D.R., ed. Handbook of hydrology. New York, McGraw Hill, 1993. 1424p.
MANNAERTS, C.; DOST, R. & LICHUN, W. GRIPS - Geo-referenced interface package for the AGNPS v. 5.0 watershed model. Enschede, ITC, 2002. Software. MITCHELL, G.; GRIGGS, R.H.; BENSON, V.; WILLIAMS, J.
& DAGITZ, S.W. Suggested values of the curve number CN2 - EPIC appendixes, 1997. [Online]. Available at < h t t p : / / w w w . b r c . t a m u s . e d u / e p i c / a p p e n d i x e s / curvenumber.html>
MITCHELL, J.K.; ENGEL, B.A.; SRINIVASAN, R. & WANG, S.S.Y. Validation of AGNPS for small watersheds using an integrated AGNPS/GIS system. Water Res. Bull., 29:833-842, 1993.
MOSTAGHIMI, S.; PARK, S.W.; COOKE, R.A. & WANG, S.Y. Assessment of management alternatives on a small agricultural watershed. Water Res., 31:1867-1878, 1997. NASH, J.E. & SUTCLIFFE, J.V. River flow forecasting through conceptual models, Part I: A discussion of principles. J. Hydrol., 10:282-290, 1970.
PANUSKA, J.C.; MOORE, I.D. & KRAMER, L.A. Terrain analysis: Integration into the agricultural nonpoint source (AGNPS) pollution model. J. Soil Water Conserv., 46:59-64, 1991.
PEKAROVA, P.; KONICEK, A. & MIKLANEK, P. Testing of AGNPS model application in Slovak microbasins. Phys. Chem. Earth, Part B: Hydrol., Oceans Atmosphere, 24:303-305, 1999.
PRATO, T. & SHI, H. A comparison of erosion and water pollution control strategies for an agricultural watershed. Water Res. Res., 26:199-205, 1990.
PUNDEK, M. Utilização prática da equação universal de perdas de solo para as condições de Santa Catarina. Florianópolis, Empresa de Pesquisa Agropecuária e Extensão Rural de Santa Catarina, 1998. 31p.
RAINIS, R.; ISMAIL, W.R. & SHARIFF, N.M. Estimating sediment yield of a small catchment in a tropical region using the AGNPS model: The Waterfall River catchment, Penang, Malaysia. J. Environ. Hydrol., 10:1-10, 2002. RODE, M. & LINDENSCHMIDT, K. E. Distributed sediment
and phosphorus transport modeling on a medium sized catchment in Central Germany. Phys. Chem. Earth, Part B: Hydrol., Oceans Atmosphere, 26:635–640, 2001. SAUER, T.J.; SREEMATKANDALAM, K.C.; TIM, U.S.;
SILVA, L.C. & BORTOLUZZI, C.A. Mapa geológico do Estado de Santa Catarina escala 1:500.000: texto explicativo. Florianópolis,DNPM - 11o Distrito/Secr. Ciência Tecnologia, Minas e Energia - Coordenadoria de Recursos Minerais, 1987.
STEDINGER, J.R.; VOGEL, R.M. & FOUFOULA-GEORGIOU, E. Frequency analysis of extreme events. In: MAIDMENT, D.R., ed. Handbook of hydrology. New York, McGraw-Hill, 1993. p.18.1-18.66.
TASSINARI, G.; OLIVEIRA, F.T.G. & POLA, A.C. Inventário das terras em microbacias hidrográficas: Rio Ariranhazinho - Seara/SC. Florianópolis, Empresa de Pesquisa Agropecuária e Extensão Rural de Santa Catarina, 1997.
UNITED STATES DEPARTMENT OF AGRICULTURE. Natural Resources Conservation Service - USDA. Urban hydrology for small watersheds. Washington, 1986. (Technical Release, 55)
UNITED STATES DEPARTMENT OF AGRICULTURE. Natural Resources Conservation Service - USDA. Soil taxonomy: A basic system of soil classification for making and interpreting soil surveys. Washington, 1999. 869p. (Agriculture Handbook, 436)
VIEUX, B.E. & NEEDHAM, S. Nonpoint-pollution model sensitivity to grid-cell size. J. Water Res. Planning Manag., 119:141-157, 1993.
WALLING, D.E.; HE, Q. & WHELAN, P.A. Using 137Cs measurements to validate the application of the AGNPS and ANSWERS erosion and sediment yield models in two small Devon catchments. Soil Till. Res., 69:27-43, 2003. WILSON, E.M. Engineering hydrology. London, MacMillan,
1990. 348p.
WISCHMEIER, W.H. & SMITH, D.D. Predicting rainfall erosion losses: A guide to conservation planning. Washington, United States Department of Agriculture, 1978. 58p. (Agriculture Handbook, 537)
YOUNG, R.A.; ONSTAD, C.A.; BOSCH, D.D. & ANDERSON, W.P. AGNPS, agricultural non-point source pollution model: A watershed analysis tool. Washington, United States Department of Agriculture, 1987. 77p. (Conservation Research Report, 35)