Critical-point models to relate yield and disease intensity of the
multiple pathosystem in rice leaf spots disease
Modelos de pontos críticos para relacionar o rendimento de grãos com a intensidade em patossistema múltiplo de manchas foliares em arroz irrigado
Luiz Carlos BordinI Ricardo Trezi CasaII Leandro Luiz MarcuzzoIII Erlei Melo ReisIV
André GhellerV Rômulo Luís ZancanV Maiquiel Diego FingstagV ISSN 0103-8478
ABSTRACT
The occurrence of leaf spots in irrigated rice can reduce the yield and compromise the quality of the grain. However it is unknown the economic damage threshold (EDT) that these spots cause the yield of crop. The objective of this study was to obtain damage functions for models of critical, to relate damage by simultaneous occurrence of blast, brown spot and scald spot with grain yield harvests in 2011/12 and 2012/2013, in Rio do Oeste, Santa Catarina State, Brazil. Gradient of diseases intensity was generated by number of applications and fungicides rates. Design was a randomized block with four replications and six treatments consisting of mixing fungicide applications of triazole (difenoconazole) and strobilurin (azoxystrobin). In 2011/12 and 2012/13 growing season were made two and three tests respectively with the same experiment. Before each application it was determined the incidence and severity of fungal diseases. The critical point models were obtained by linear regression between grain yield and incidence (I) and severity (S). In 2011/12 the functions were not significant at the beginning of tillering and 2012/2013 harvest resulted in R=13.404-92.98I and R=10.685-3.804S. Respectively in each harvest resulted in tillering (R=9.141-103.6I; R=7.605-1.538 and R=8.864-73.91I; R=7.202-77S), panicle initiation (R=9.432-188.5I; R=7.,038-1.466S and R=10.176-87.33I; R=8.258-533.55S), booting (R=7.044-71.78I; R=6.881-1.296S and R=9.993-71.74I; R=8.846-763.83S), flowering (R=7.447-82.29I; R=8.731-1.398S and R=8.347-54.36I; R=7.338-681.52S) and milky grain (R=10.143-80.5I; R=7.522-1.402S and R=8.661-60.063I; R=9.754-1.465S). The generated functions allow getting the damage coefficient for use in the calculation of EDT in multiple pathossystem leaf spots in irrigated rice.
Key words: Oryza sativa, Pyricularia oryzae, Bipolaris oryzae,
Gerlachia oryzae, damage.
RESUMO
A ocorrência de manchas foliares na cultura do arroz irrigado pode reduzir o rendimento e comprometer a qualidade do grão. No entanto, é desconhecido o limiar de dano econômico (LDE) que essas manchas causam no rendimento da cultura. O objetivo deste trabalho foi obter funções de dano, por modelos de ponto crítico, ao relacionar o dano pela ocorrência simultânea da brusone, mancha parda e escaldadura com o rendimento de grãos nas safras de 2011/12 e 2012/2013, em Rio do Oeste, Santa Catarina (SC). O gradiente da intensidade das doenças foi gerado por número de aplicações e doses de fungicidas. O delineamento foi de blocos casualizados, com quatro repetições e seis tratamentos, constituídos de aplicações de mistura de fungicidas triazol (difenoconazole) e estrobilurina (azoxistrobina). Na safra de 2011/12 e 2012/13, foram feitos dois e três ensaios, respectivamente, com o mesmo experimento. Antes de cada aplicação, foi determinada a incidência e a severidade das doenças foliares. Os modelos de ponto crítico foram obtidos por regressão linear entre rendimento de grãos e incidência (I) e severidade (S). Em 2011/12, as funções não foram significativas no início do perfilhamento e, na safra de 2012/2013, resultou em R=13.404-92,98I e R=10.685-3.804S. Respectivamente, em cada safra, resultaram no perfilhamento (R=9.141-103,6I; R=7.605-1.538 e R=8.864-73,91I; R=7.202-77S), iniciação da panícula (9.432-188,5I; R=7.038-1.466S e 10.176-87I; R=8.258-533,55S), emborrachamento (R=7.044-71,78I; 6.881-1.296S e R=9.993-71,74I; R=8.846-763,83S), floração (R=7.447-82,29I; R=8.731-1.398S e R=8.347-54,36I; R=7.338-681,52S) e grão leitoso (R=10.143-80,5I; R=7.522-1.402S e R=8.661-60.063I; R=9.754-1.465S). As funções geradas permitem obter o coeficiente de dano para uso no cálculo do LDE em patossistema múltiplo de manchas foliares, em arroz irrigado.
Palavras-chave: Oryza sativa, Pyricularia oryzae, Bipolaris oryzae, Gerlachia oryzae, dano.
IInstituto Federal Catarinense (IFC), Camboriú, SC, Brasil.
IICentro de Ciências Agroveterinárias (CAV), Universidade do Estado de Santa Catarina (UDESC), Lages, SC, Brasil. IIIIFC, 89163-356, Rio do Sul, SC, Brasil. E-mail: marcuzzo@ifc-riodosul.edu.br. Corresponding author.
IVOR Sementes, Passo Fundo, RS, Brasil.
VCurso de Agronomia, CAV, UDESC, Lages, SC, Brasil.
INTRODUCTION
Rice (Oryza sativa L.) is grown and consumed in all continents, characterized as the main food for more than half of the world’s population, having more importance in developing countries, where, plays a strategic role in economic and social levels (WALTER et al., 2008).
The cultivated area in Brazil in 2014/15 season was approximately 2,333 million hectares, with productivity of 5,209kg ha-1 and production of 12,151.5 million tons. The state of Rio Grande do Sul (RS) stands out as the major national producer, being responsible for about 67.5% of total production in Brazil. The state of Rio Grande do Sul obtained a production of 8,204.4 million tons of rough rice, in an area of 1,123.9 million hectares, with an average yield of 7,300 million kg ha-1 (146 bags ha-1). Santa Catarina State (SC) has an area of 147,9 thousand hectares, producing 1,057.5 million tons and productivity of 7,150kg ha-1 (143 ha-1 bags), corresponding to 8.7% of the national production (CONAB, 2015).
Among the limiting factors of expression of the productive potential of rice crop, are foliar fungal diseases that reduce the leaf area of rice plant and therefore the plant’s ability to do photosynthesis and to
produce photosynthantes, influencing the grain filling
in infected plants (BEDENDO, 1997). According to BALARDIN & BORIN (2001), the occurrence of these diseases account for variable damages between 20 and 50% in productivity. Among the major foliar diseases in rice produced in the states of Rio Grande do Sul and Santa Catarina, can be highlighted the blast [Pyricularia oryzae (Cooke) Saccardo], brown spot [Bipolaris oryzae (Breda Hann) Shoemaker] and scald [Gerlachia oryzae (Hashioka & Yokogi) W. Gams] (SOSBAI, 2012).
The method more practical, efficient,
economical and environmentally sustainable for the control of plant diseases, is the sowing of resistant or tolerant cultivars. However, in practice, the resistance does not usually occur in a single cultivar for all diseases and is not durable for many years. Therefore, chemical control has been one of the most viable ways to ensure productivity (CHAUBE & SINGH, 1991).
Currently, the decision taking for spray chemical in irrigated rice follows subjective criteria,
such as: preventive applications or defined by phenological stage of development. (late flowering
and booting) (SOSBAI, 2012). This control system does not take into account the damages, losses, control
costs and the efficiency of the fungicides. This system
may lead to unnecessary or late applications, when the intensity of the disease has exceeded the economic damage threshold (EDT). According to REIS & CASA (2009), the complexity that involves the decision of apply fungicides, and the doubts about the probable damages of production leads to decisions that can be precipitated, resulting in unnecessary spending or delayed decisions resulting in unrecoverable losses.
The EDT is characterized as scientific criteria for the
use of fungicide on crops such as: some pathosystems in wheat (REIS & CASA, 2007; BOHATCHUCK et al., 2008) mildew and brown spot on barley (Reis et al, 2002; AGOSTINETO et al., 2012) and leaf rust in oat (NERBASS JUNIOR et al., 2010). Through EDT by using the critical point model is possible to identify a certain stage of development, in which the intensity of this disease is correlated with future damage (BERGAMIN FILHO & AMORIM, 1996).
Thereby, the EDT is unknown in the literature for irrigated rice. Thus, the objective of this research was to generate damage function equations to the cultivar of rice ‘SCS 116 Satoru’ for the blast, brown spot and scald considering a multiple pathossystem, relating the intensity of diseases
with grain yield. So, the damage coefficients were
obtained in different phenological stages, to be used to calculate the EDT, as an indicator criterion of time for fungicide application.
MATERIAL AND METHODS
The experiments were conducted in the crop year 2011/12 (10/03/2011 sowing and harvesting on 03/23/2012) and 2012/13 (09/17/2012 seeding and harvesting 03/13/2013) in the same areas, in
commercial fields in the town of Rio do Oeste, in the
county of Alto Vale do Itajaí, Santa Catarina.
The cultivar ‘SCS 116 Satoru’ was used, which characteristics are late cycle (136-159 days from sowing to maturity), with moderate resistance to blast and no information for other foliar diseases (brown spot and scald). Sowing was in pre-germinated system in the density of 150kg ha-1. In the base fertilizer, was applied nitrogen fertilization according to the technical recommendations for rice crop in the south of Brazil. Control of weeds and pests realized follow the technical recommendations for rice cultivation in the south of Brazil as well (SOSBAI, 2012).
constituted of a mixing of triazole (difenoconazole) + strobilurin (azoxystrobin), using the recommended dose by the manufacturer. It was added mineral oil (Nimbus) in the treatments, totaling 24 experimental plot, where one of those was the treatment (control) without fungicide application. The area corresponding to each experimental plot was 5.0x2.5 meters. Fungicides were applied every 15 to 20 days by using a backpack sprayer with a constant pressure generated by CO2 gas, using the volume of 200 liter ha-1.
The applications of fungicides occurred in the initial stages of tillering (V6), tillering (V8),
panicle initiation (R0), booting (R2), flowering
(R4) and soft dough (R6), according to the scale COUNCE et al. (2000), with one application in (V8), two applications in (V8+R0), three applications in (V8+R0+R2), four applications in (V8+R0+R2+R4)
and five applications in (V8+R0+R2+R4+R6), with
the objective of generating disease intensity gradient according to the methodology proposed by SAH & MACKENZIE (1987).
Collection of leaves to evaluated the incidence and severity of rice blast, brown spot and scald was performed before each fungicide application, taking off three expanded leaves from the lower, middle and upper extract, randomly in ten plants from each experimental plot. Two
trained people quantified the severity by using a
diagrammatic scale for blast (AZEVEDO, 1997), brown spot (LENZ, 2010) and scald (IRRI, 1996). The same trained evaluators were used in all evaluations to avoid possible systematic errors.
The rice was harvested manually by collecting 2m2 of the central part of each portion. The track and cleaning were performed in a stationary machine. Rice was dried in a drying oven until it reaches 13% moisture. Later, the rice grains were weighed to determinate the yield per experimental plot and then the yield per hectare.
The data from disease intensity were related to grain yield data in order to obtain the linear equations corresponding to damage functions for later use in the calculation of EDT. The equations of damage function were obtained from the relationship between grain yield (dependent variable) and the intensity of the disease (independent variable) in different growing stages.
For the calculation of EDT it was used the formula created by MUNFORD & NORTON
(1984) and modified by Reis et al. (2000) for foliar
diseases: ID=(Cc / Pp*Cd) * Ec; where ID=intensity of the disease to start the control; Cc=the cost of control per hectare (fungicide, fuel, kneading, hand
labor of the operator, equipment depreciation); Pp=selling price of the product (rice); Cd=damage
coefficient obtained from damage functions and Ec = fungicide control efficiency.
The data were submitted to regression analysis, using the PROC GLM (General Linear Models Procedure) of the statistical program SAS 9.2 (Statistic Analysis System), also obtaining the
significance of the model F test at 5% probability
(P<0.05). The equations were adjusted in damage functions for yield estimated at 1,000kg grain ha-1.
RESULTS AND DISCUSSION
For each season and location of the experiments, there were distinct weather conditions, with favorable environment for the development of foliar spots in irrigated rice. The average temperature was 21.8°C and 21.3°C and rainfall, 594mm and 755mm, respectively, for 2011/12 and 2012/13 season (EPAGRI, 2013).
The equations were adjusted to a ton of rice grains, in order to facilitate its use in the calculation of EDT, according to simple pathossystem (REIS & CASA, 2007) and multiple pathossystem (BOHATCHUK et al., 2008) in wheat; simple pathossystem (REIS et al., 2008) and multiple in oat (NERBASS JUNIOR et al., 2010), and simple pathossystem (REIS et al., 2002) and multiple pathossystem in barley (AGOSTINETO et al., 2012).
In all equations generated in both seasons,
the incidence and severity showed significant,
indicating that there was correlation between the intensity of leaf diseases and the grain yield for the
different growing stages. The values of the coefficients
of determination (R2) was greater than 50%.
In the season 2011/12 the damage equations
based on leaf incidence generated a damage coefficients
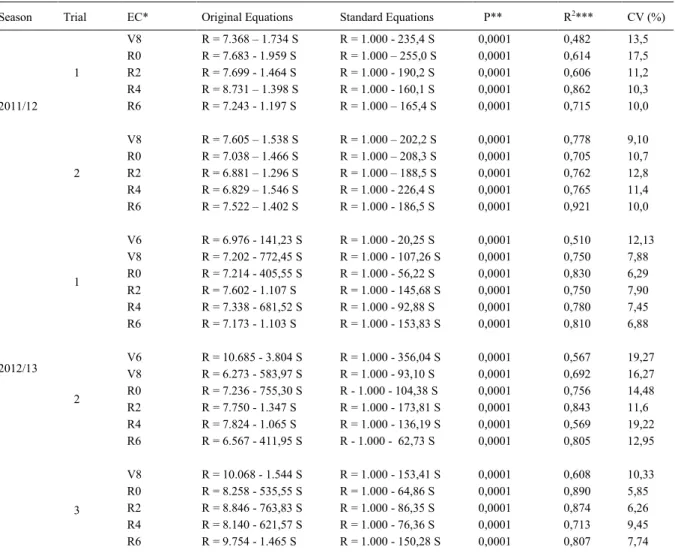
ranging from 7.00kg ha-1 to 24.11kg ha-1 (trial 1) and 7.93kg ha-1 to 11 to 34kg ha-1 (trial 2) in the grain yield for each 1% incidence of leaf considering a yield of 1,000kg ha-1 (Table 1). For foliar severity, the damage coefficients ranged from 160.1kg ha-1 to 255.0kg ha-1 (trial 1) and 186.5kg ha-1 to 226.4kg ha-1 (trial 2) (Table 2).
In the season 2012/13 the damage equations based on leaf incidence generated a damage
considering a yield of 1,000kg ha-1 in trial 1, 2 and 3, respectively (Table 2).
Considering the coefficients of determination,
the variables incidence and severity showed good relationship with the data, while NERBASS JUNIOR et al. (2010), had better relationship with the variable incidence in damage function equations for the culture of oats and AGOSTINETTO et al. (2012) for variable severity in barley crop.
The equations of damage functions generated in this research can be used in the calculation of EDT for each stage of development of rice crop, considering the multiple pathossystem of foliar diseases, that is,
considering the simultaneous occurrence of blast, brown
spot and scald, which really occurs in the fields since
there is no cultivar resistant to these diseases yet. Using the EDT equation of foliar diseases (ID = (Cc / Pp*Cd)*Ec) and adding their values, the cost to control disease in irrigated rice in 2013 was R$ 100.00 ha-1 and the selling price was R$ 620.00 ton-1. (Source: Regional Agricultural Cooperative Vale do Itajaí - CRAVIL / Rio do Sul / SC), fungicide
efficiency, in this case was 70%, and Cd obtained from
the damage function equation in table 1 for the soft dough stage in the season of 2012/13 (trial 1), R=1000 to 4.14 I with P=0.0001 and R2=0.773. In this case, it Table 1 - Equations of the original and standard damage function for multiple pathosystem blast, brown spot and scald, based on leaf
incidence, generated by growth stages on the cultivar ‘SCS 116 Satoru’, Rio do Oeste, SC, in different trials in the season 2011/12 and 2012/13.
Season Trial EC* Original Equations Standard Equations P R2 CV (%)
V8 R = 7.926 - 191,1 I R = 1.000 - 24,11 I 0,0001 0,617 16,1 R0 R = 9.432 - 188,5 I R = 1.000 - 19,99 I 0,0001 0,801 11,6 R2 R = 8.804 - 178,2 I R = 1.000 - 20,24 I 0,0001 0,838 10,4 R4 R = 10.709 - 74,9 I R = 1.000 - 7,00 I 0,0001 0,809 10,5 1
R6 R = 10.666 - 82,9 I R = 1.000 - 7,78 I 0,0001 0,841 9,60
V8 R = 9.141 - 103,6 I R = 1.000 - 11,34 I 0,0001 0,810 10,2 R0 R = 8.094 - 83,15 I R = 1.000 - 10,27 I 0,0001 0,755 11,6 R2 R = 7.044 - 71,78 I R = 1.000 - 10,19 I 0,0001 0,890 7,81 R4 R = 7.447 - 82,29 I R = 1.000 - 11,05 I 0,0001 0,814 10,1 2011/12
2
R6 R = 10.143 - 80,5 I R = 1.000 - 7,93 I 0,0001 0,841 9,30
V6 R = 13.404 - 92,980 I R = 1.000 - 6,90 I 0,0001 0,535 10,78 V8 R = 7.601 - 36,880 I R = 1.000 - 4,85 I 0,0001 0,838 6,33 R0 R = 8.558 - 52,840 I R = 1.000 - 6,17 I 0,0001 0,829 6,52 R2 R = 8.302 - 58,370 I R = 1.000 - 7,03 I 0,0001 0,775 7,49 R4 R = 8.347 - 54,360 I R = 1.000 - 6.51 I 0,0001 0,847 6,18 1
R6 R = 7.479 - 30,970 I R = 1.000 - 4.14 I 0,0001 0,773 7,53
V6 R = 11.056 - 127,880 I R = 1.000 -11,5 I 0,0001 0,522 20,25 V8 R = 8.864 - 73,910 I R = 1.000 - 8,3 I 0,0001 0,937 7,29 R0 R = 10.176 - 87,339 I R = 1.000 - 8,58 I 0,0001 0,837 11,81 R2 R = 9.395 - 110,662 I R = 1.000 -11,7 I 0,0001 0,774 13,94 R4 R = 9.515 - 73,228 I R = 1.000 - 7,70 I 0,0001 0,741 14,93 2
R6 R = 8.661 - 60,063 I R = 1.000 - 6,93 I 0,0001 0,935 7,49
V8 R = 9.288 - 84,231 I R = 1.000 - 9.1 I 0,0001 0,531 15,14 R0 R = 11.922 - 83,557 I R = 1.000 - 7,0 I 0,0001 0,823 7,42 R2 R = 9.993 - 71,738 I R = 1.000 - 7,2 I 0,0001 0,849 6,85 R4 R = 9.134 - 58,300 I R = 1.000 - 6,38 I 0,0001 0,812 7,63 2012/13
3
R6 R = 10.633 - 55,261 I R = 1.000 - 5,20 I 0,0001 0,832 7,23
*Development scale based on Counce et al. (2000): the beginning of tillering (V6), tillering (V8), panicle initiation (R0), booting (R2), flowering (R4) and soft dough (R6); P = probability of error; R2 = coefficient of determination; CV (%) = coefficient of variation; R = Yield;
is assumed that for every 1% of incidence of disease occurs a reduction of 4.14kg ha-1 or 0.00414 ton at
flowering stage for every 1000kg of grain harvested.
If considered a crop that has an estimated yield of 9,000kg ha-1 the calculated Cd will be 37.26kg ha-1 or 0.03726ton. Substituting these values in the equation is obtained a EDT=3.0% of incidence of leaf disease, indicating that the fungicide for the control of rice blast, brown spot, and scald must occur before the incidence reaches 3.0%.
Official recommendation for rice crop in
the states of Rio Grande do Sul and Santa Catarina recommends preventive chemical treatment or in
certain growing stages (late flowering and booting)
(SOSBAI, 2012). However, the value of 3.0%
incidence (EDT) is a scientific criteria and indicator
of time to beginthe chemical control of foliar diseases (multiple pathosystem blast, brown spot and scald) in irrigated rice. This parameter can be used to cultivars with similar reaction to the ‘SCS 116 Satoru’. Use of fungicides should ensure economic and environmental sustainability of agriculture. Therefore, if the disease does not occur and / or if it
is not economical its control, there is no justification
to apply fungicide as it contributes to environmental pollution and increase production cost.
In the absence of research to generate equations of damage in this culture, it was not possible Table 2 - Equations of the original and standard damage function for multiple pathosystem blast, brown spot and scald, based on leaf severety, generated by growth stages on the cultivar ‘SCS 116 Satoru’, Rio do Oeste, SC, in different trials in the season 2011/12 and 2012/13.
Season Trial EC* Original Equations Standard Equations P** R2*** CV (%)
V8 R = 7.368 – 1.734 S R = 1.000 - 235,4 S 0,0001 0,482 13,5 R0 R = 7.683 - 1.959 S R = 1.000 – 255,0 S 0,0001 0,614 17,5 R2 R = 7.699 - 1.464 S R = 1.000 - 190,2 S 0,0001 0,606 11,2 R4 R = 8.731 – 1.398 S R = 1.000 - 160,1 S 0,0001 0,862 10,3 1
R6 R = 7.243 - 1.197 S R = 1.000 – 165,4 S 0,0001 0,715 10,0
V8 R = 7.605 – 1.538 S R = 1.000 – 202,2 S 0,0001 0,778 9,10 R0 R = 7.038 – 1.466 S R = 1.000 – 208,3 S 0,0001 0,705 10,7 2011/12
R2 R = 6.881 – 1.296 S R = 1.000 – 188,5 S 0,0001 0,762 12,8 R4 R = 6.829 – 1.546 S R = 1.000 - 226,4 S 0,0001 0,765 11,4 2
R6 R = 7.522 – 1.402 S R = 1.000 - 186,5 S 0,0001 0,921 10,0
V6 R = 6.976 - 141,23 S R = 1.000 - 20,25 S 0,0001 0,510 12,13 V8 R = 7.202 - 772,45 S R = 1.000 - 107,26 S 0,0001 0,750 7,88 R0 R = 7.214 - 405,55 S R = 1.000 - 56,22 S 0,0001 0,830 6,29 R2 R = 7.602 - 1.107 S R = 1.000 - 145,68 S 0,0001 0,750 7,90 R4 R = 7.338 - 681,52 S R = 1.000 - 92,88 S 0,0001 0,780 7,45 1
R6 R = 7.173 - 1.103 S R = 1.000 - 153,83 S 0,0001 0,810 6,88
V6 R = 10.685 - 3.804 S R = 1.000 - 356,04 S 0,0001 0,567 19,27 V8 R = 6.273 - 583,97 S R = 1.000 - 93,10 S 0,0001 0,692 16,27 R0 R = 7.236 - 755,30 S R - 1.000 - 104,38 S 0,0001 0,756 14,48 R2 R = 7.750 - 1.347 S R = 1.000 - 173,81 S 0,0001 0,843 11,6 R4 R = 7.824 - 1.065 S R = 1.000 - 136,19 S 0,0001 0,569 19,22 2
R6 R = 6.567 - 411,95 S R - 1.000 - 62,73 S 0,0001 0,805 12,95
V8 R = 10.068 - 1.544 S R = 1.000 - 153,41 S 0,0001 0,608 10,33 R0 R = 8.258 - 535,55 S R = 1.000 - 64,86 S 0,0001 0,890 5,85 R2 R = 8.846 - 763,83 S R = 1.000 - 86,35 S 0,0001 0,874 6,26 R4 R = 8.140 - 621,57 S R = 1.000 - 76,36 S 0,0001 0,713 9,45 2012/13
3
R6 R = 9.754 - 1.465 S R = 1.000 - 150,28 S 0,0001 0,807 7,74
*Development scale based on Counce et al. (2000): the beginning of tillering (V6), tillering (V8), panicle initiation (R0), booting (R2), flowering (R4) and soft dough (R6); P = probability of error; R2 = coefficient of determination; CV (%) = coefficient of variation; R = Yield;
to compare these results with other equations for cultivars with the same or different reactions, but the results showed that if is not performed the chemical control of foliar diseases in irrigated rice, it will be
significant reduction in productivity.
CONCLUSION
The methodology used in this study in order to generate the gradient of foliar diseases in rice and grain yield was adequate for t damage functions.
It was possible to obtain the damage functions for multiple pathosystem, blast, brown spot and scald for the cultivar of rice ‘SCS 116 Satoru’,
having variations in damage coefficient values in
function of the phenological stage of the plants. It was found that in the soft dough stage (R6) there is a EDT of 3.0% of incidence of leaf, indicating that the fungicide for the control of rice blast, brown spot, scald must occur before this value is reached.
The equations generated by the damage
coefficients can be used to calculate the EDT
involving multiple pathosystem, blast, brown spot and scald, for different growth stages on the cultivar ‘SCS 116 Satoru’ and cultivars with similar reaction.
REFERENCES
AGOSTINETO, L. et al. Relações lineares entre incidência e severidade foliar da mancha marrom da cevada para determinação de limiares de ação.
Revista de Ciências Agroveterinárias, Lages, v.11, n.3, p.230-237, 2012.
AZEVEDO, L.A.S. Manual de quantificação de doenças de
plantas. São Paulo: Novartis Biociências, 1997. 11p.
BALARDIN, R.S.; BORIN, R.C. Doenças na cultura do arroz
irrigado. Santa Maria: UFSM, 2001. 48p.
BEDENDO, I.P. Doenças do arroz. In: KIMATI, H.; AMORIM, L. Manual de fitopatologia. São Paulo: Agronômica Ceres, 1997. Cap,10, p.85-99.
BERGAMIN FILHO, A.; AMORIM, L. Doenças de plantas
tropicais: epidemiologia e controle econômico. São Paulo: Ceres,1996. 289p.
BOHATCHUCK, D.A. et al. Modelo de ponto crítico para estimar danos de doenças foliares do trigo em patossistema múltiplo. Tropical Plant Pathology, Brasília, v.33, n.5, p.363-369, 2008. Available from: <http://dx.doi.org/10.1590/S1982-56762008000500004>. Accessed: Nov. 25, 2014. doi: 10.1590/ S1982-56762008000500004.
CHAUBE, H.S.; SINGH, U.S. Planta disease management: principles and practices. Boca Raton: CRC, 1991. 319p.
CONAB (COMPANHIA NACIONAL DE ABASTECIMENTO).
Acompanhamento de safra brasileira: grãos, 6o levantamento,
Brasília. Online. Available from: <http://www.conab.gov.br/
OlalaCMS/uploads/arquivos/15_03_11_14_07_48_boletim_graos_ marco_2015.pdf>. Accessed: Apr. 06, 2015.
COUNCE, P. et al. A uniform, objective, and adaptive system for expressing rice development. Crop Science, Madison, v.40, n.2, p.436-443, 2000.
EPAGRI. Atlas climatológico do estado de Santa Catarina, Florianópolis. Online. Available from: <http://ciram.epagri.sc.gov. br/portal/website/>. Accessed: Nov. 23, 2013.
IRRI (INTERNATIONAL RICE RESEARCH INSTITUTE).
Standard evaluation system for rice. 4.ed. Manila, 1996. 52p.
LENZ, G. et al. Escala diagramática para avaliação de severidade de mancha-parda em arroz. Ciência Rural, Santa Maria, v.40, n.4, p.752-758, 2010. Disponível em: <http://dx.doi.org/10.1590/ S0103-84782010005000061>. Accessed: Nov. 26, 2014. doi: 10.1590/S0103-84782010005000061.
MUNFORD, J.D.; NORTON, G.A. Economics of decision making in pest management. Annual Review Entomology, Stanford, v.29, p.157-174, 1984.
NERBASS JUNIOR, J.M. et al. Modelos de pontos críticos para relacionar o rendimento de grãos de aveia branca com a intensidade de doença no patossistemamúltiplo ferrugem da folha –helmintosporiose.
Ciência Rural, Santa Maria, v.40, n.1, p.1-6, 2010. Available from: <http://dx.doi.org/10.1590/S0103-84782009005000228>. Accessed: Nov. 26, 2014. doi: 10.1590/S0103-84782009005000228.
REIS, E.M.; CASA, R.T. Análise crítica dos critérios atuais. In: REIS, E.M. (Org). Critérios indicadores do momento para
aplicação de fungicidas visando ao controle de doenças em soja
e trigo. Passo Fundo: Aldeia Norte, 2009. Cap.12, p.135-147.
REIS E.M. et al. Modelo do ponto crítico para estimar danos causados pelo oídio em cevada. Fitopatologia Brasileira, Brasília, v.27, p.644-646, 2002.
REIS, E.M. et al. Efeito da ferrugem da folha no rendimento de grãos de trigo. Fitopatologia Brasileira, Brasília, v.25, p.67-71, 2000.
REIS, E.M.; CASA, R.T. Doenças dos cereais de inverno: diagnose, epidemiologia e controle. 2 ed. Rev. atual. Lages: Graphel, 2007. 176p.
REIS, E.M. et al. Modelos de ponto crítico para estimar danos causados pela ferrugem da folha da aveia branca. Summa Phytopathologica, Botucatu. v.34, n.3, p.238-241, 2008. Available from: <http://dx.doi. org/10.1590/S0100-54052008000300006>. Accessed: Nov. 27, 2014. doi: 10.1590/S0100-54052008000300006.
SAH, D.N.; MACKENZIE, D.R. Methods of generating different levels of disease epidemics in loss experiments. In: TENG, P.S. (Ed.). Crop loss assessement and pest management. St. Paul, MN: American Phytopathological Society, 1987. p.90-95.
SOSBAI. Arroz irrigado: recomendações técnicas da pesquisa para o Sul do Brasil. In: REUNIÃO TÉCNICA DA CULTURA DO ARROZ IRRIGADO, 29., 2012, Itajaí, SC. Anais... Itajaí: Sociedade Sul-Brasileira de Arroz Irrigado, 2012. 179p.
WALTER, M. et al. Arroz: composição e características nutricionais.