Antônio Salazar P. Brandão3
Abstract – The paper studies the impacts of the elimination of tariffs between the United States and the European Union in the context of negotiations of a free trade agreement. The principal theme of the paper is the impact on Brazil, particularly with respect to agricultural based products. The results show that the effects are small if Brazil does not participate. Nevertheless, if the country fully engag-es in the negotiations significant efficiency gains will take place with the expansion of important sec-tors, such as sugar and meats. The results points out to the fact that the negotiations are not likely to be easy since production and exports of sensitive products will be reduced in the three economies. Keywords: agricultural based sectors, allocative effect, commercial policy, tariff elimination, terms of trade.
Área de livre comércio Estados Unidos/União Europeia:
impactos sobre o Brasil
Resumo – O artigo analisa os impactos da eliminação das tarifas entre os Estados Unidos e a União Europeia no contexto da negociação de uma área de livre comércio. O tema principal são implica-ções para o Brasil e para os produtos de base agropecuária. Conclui-se que a economia brasileira será pouco influenciada se não participar do acordo. Entretanto, caso venha a participar, ganhos alocativos expressivos poderão ser obtidos e setores importantes, como carnes e açúcar, poderão se expandir. A natureza dos resultados indica que as negociações não serão fáceis uma vez que impor-tantes setores das três economias sofrerão reduções em suas produções e exportações.
Palavras-chave: setores de base agropecuária, efeito alocativo, política comercial, eliminação de tarifas, termos de troca.
Free trade area United
States of America/
European Union
Impacts on Brazil
1,2
1 Original recebido em 19/3/2015 e aprovado em 22/5/2015.
2 O autor agradece aos participantes do Seminário da Pós-graduação os comentários a uma versão anterior deste artigo.
3 Professor da Faculdade de Ciências Econômicas da Universidade do Estado do Rio de Janeiro (UERJ). E-mail: abrandao@firjan.org.br
Introduction
In view of the current negotiations of a free trade area between the United States of America
(USA) and the European Union (EU) this article examines the impacts of tariff reduction between the two regions. The interest in the issue stems
from the fact that trade flows between them are very high and, as such, integration is expected to have significant impacts on global economic transactions. Particularly in the case of Brazil the impacts deserve attention from policy makers not only because of the creation of the free trade area itself but also because it can be an oppor-tunity for Brazil to participate in this process of integration.
Negotiations appear to be in a preliminary phase and it is difficult to anticipate how they will evolve and how the final agreement between the parties will look like. Trade between the USA and the EU is mainly composed of manufactured products. On the other hand, Brazil’s exports to the EU have a high component of agricultural products and Brazil’s exports to the USA are mostly minerals and manufactured goods.
The analysis uses the GTAP (Global Trade Analysis Project) computable general equilibrium
model, version 8.14. For the two experiments
presented the sectorial and regional aggregations are as follows:
• Sectors: sugar, meat, soy, cereals, dairy products, other agricultural (other_ag), extraction, other manufactured goods (outros_mnf) and others.
• Regions: United States of America (USA); European Union, 27 countries (EU); Brazil (BRA), other countries of MERCOSUR (RMERCOSUR); China (CHN); Other countries in Asia (Asia), Canada and Mexico (CANMEX), other countries of Latin America (ALATINA); Africa; and other countries (others). The paper is organized as follows: section 2 looks at the implications of tariff elimination between the USA and the EU; section 3 expands the analysis of tariff elimination to include Brazil; section 4 highlights potential policy issues that will be faced by Brazil if the country decides
to engage in the negotiations; and section 4 is summarizes the paper.
Tariff reduction in both regions
and impacts on the Brazil
Experiment one consists in the elimination of tariffs on all sectors in the USA and in the EU, without changing subsidies or export taxes. Table 1 shows applied tariffs in both regions. Extremely low values are observed for wood, extraction, other manufactured goods and other products. On the other hand, besides the fact that tariffs are in general high for agricultural pro-ducts, extremely high values deserve attention. For meat the tariff in the EU is 16.5% and there is a major contrast with the tariff applied by the USA that is only 1.4%. For sugar tariffs are high in both regions, being somewhat smaller in the United States. For milk products tariffs are high, and in the EU the value is two times higher than in the USA. For other_ag and cereals values are slightly lower, with higher levels in the EU.
The impacts on production in the two regions are relatively minor. Meat production in
4 The structure of the model is presented in Hertel (1997). Further information about the model and changes that were made to the model
can be found in the GTAP home page, in particular, at https://www.gtap.agecon.purdue.edu/models/current.asp. For the database and related documentation see Narayanan et al. (2012).
Table 1. Tariffs in the two regions – percent.
EU USA Meat 16.5 1.4 Sugar 11.4 14.0 Dairy 38.0 18.5 Soybean 0.7 1.3 Other_ag 9.7 5.4 Cereals 4.9 3.0 Wood 1.5 0.4 Extraction 0.0 0.0 Other_mnf 2.3 1.1 Other 0.4 0.4
the USA increased 0.7 percent while in the EU production decreased 0.5 percent, these being the largest impacts, in absolute value, observed.
Table 2 shows the impacts on imports in the various regions. Global imports increase by US$ 26 billion, concentrated in the USA, US$ 25 billion, and in the EU, US$ 10 billion. Higher reductions occur in imports by Asia, Canada and Mexico, other countries and China. In the other regions imports decrease, but volumes are low. Global imports in all sectors increase, except for soybeans, cereals and sugar, where trade does not change much.
Among agricultural products, imports of dairy products by the USA increases by US$ 1.2 billion (46 percent). Other products to mention are imports of meat by the EU and imports of other agricultural products by both regions.
Table 3 shows the effects on aggregate ex-ports. At first it is interesting to note that, despite high tariffs for sugar, there will be little change in exports from both regions. The fact that both exports and imports of this product change very little is due to the fact that tariffs are similar in both regions. Also imports are low and come mostly from third regions which are not affected by the elimination of tariffs.
The major increases in USA exports will occur in meat (9 percent), dairy products (38 percent) and other agricultural products (5.5 percent). The EU also increased exports of dairy products (2 percent), but beef exports decrease (1.2 percent) and changes in other products are not very expressive. The effects on agricultural exports from other regions are small too.
The following are specific observations arising from the analysis of commodity trade matrices (not shown in the paper) in agricultural products:
• Exports of beef from the USA to the EU, to the tune of US$ 1.5 billion, is accom-panied by reduction of US$ 880 million in exports of beef inside the EU.
• Exports of dairy products from the USA to the EU, to the tune of US$ 1 billion, is accompanied by a reduction in exports of US$ 560 million within the EU. At the same time the EU increases its exports to the United States by US$ 1.5 billion. • Exports of other agricultural products
by the USA to the EU increase by US$ 2.3 billion; exports of other agricul-tural products inside the EU decrease by US$ 1 billion; but exports of this product to the USA increase by US$ 1.2 billion. The main results, from the macroeconomic point of view, are the following:
• There is an increase in external saving in the United States, which allows the re-gion to increase the deficit in the current account of the balance of payments by US$ 4.8 billion, while external savings in the EU decreases to US$ 168 million. Reductions in external savings are ob-served in the other regions too. In other words, the opportunities generated in the USA economy led the Global Bank of the model to direct a larger share of world savings for that region. The price of capital goods in the USA has increa-sed while in the other regions they have decreased.
• The equivalent variation for the world economy was positive, but small: US$ 400 million. The USA had a gain of US$ of 5.6 billion while all other regions showed losses of well-being. In the case of EU, which experienced a welfare loss of US$ 180 million, this was caused primarily by terms of trade, since the allocative effect was positive in that region. In the USA the allocative and the terms of trade effect contribute to increase welfare.
The impacts of tariff reduction on average import prices in various sectors and regions are small, except for milk products in the USA. The reduction of tariffs in this sector had a significant
Table 2.
V
ariations in imports in US$ million – market prices.
USA EU BRA RMERCOSUR CHN Asia CANMEX ALA TINA AFR Others Total Meat 170 527 -1 0 -16 -28 -43 -9 -2 -19 578 Sugar 18 10 0 0 0 0 -1 -1 0 -1 24 Dairy 1,268 559 0 0 -1 -7 -12 -2 -1 -9 1,794 Soybean 59 6 -1 0 -18 -21 -11 -7 -3 -13 -10 Other_ag 965 932 -4 -1 -14 -59 -85 -18 -8 -56 1,653 Cereals 26 126 -3 0 0 -71 -25 -32 -15 -45 -40 W ood 483 74 -1 0 -2 -9 -34 -7 -3 -22 478 Extraction 984 32 -5 0 -125 -235 -37 1 -2 -60 552 Other_mnf 13,136 6,571 -156 -20 -335 -923 -1,215 -229 -1 16 -782 15,931 Other 7,553 1,381 -143 -28 -204 -1,208 -847 -192 -151 -959 5,201 Total 24,662 10,218 -313 -50 -715 -2,562 -2,312 -496 -302 -1,967 26,162 Source: GT AP 8.1, Experiment 1 (GT AP…, 2012). Table 3. V
ariations in exports in US$ million – fob prices.
USA EU BRA RMERCOSUR CHN Asia CANMEX ALA TINA AFR Outros Total Meat 1,290 -759 -13 -12 -3 -11 39 2 -4 -7 523 Sugar 14 -1 5 0 0 -1 1 2 0 0 20 Dairy 1,001 899 -3 -12 -6 -44 -60 -11 -5 -276 1,482 Soybean -1 16 45 27 19 1 16 -2 5 2 6 2 Other_ag 2,007 11 5 -27 -14 -50 -108 -103 -108 -60 -1 15 1,537 Cereals 81 -138 -16 2 9 12 18 2 0 15 -13 W ood 52 9 19 3 106 48 139 15 9 29 429 Extraction -122 -19 9 1 6 13 190 49 40 424 592 Other_mnf 15,544 5,861 7 1 -981 -1,623 -1,603 -159 -86 -1,382 15,579 Other -4,526 4,175 160 40 1,000 2,167 852 197 11 2 1,187 5,363 Total 15,225 10,188 169 28 81 468 -529 -7 8 -1 18 25,513 Fonte: GT AP 8.1, Experiment 1 (GT AP…, 2012).
impact on imports from the EU and, in conse-quence, the average price of imports decreased 10 percent.
Tariff reduction in the
two regions and in Brazil
The previous experiment showed that tariff liberalization between the United States and the European Union has small impacts on Brazil, particularly on agricultural sectors. Nevertheless, if Brazil becomes part of the negotiations, tariff reduction among the three partners can bring substantial regional gains but also the efficiency of the world economy as a whole will increase, as the results of the next experiment reveal.
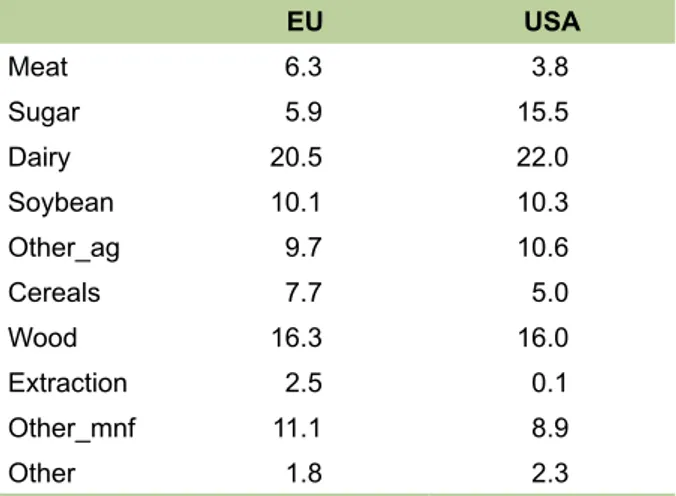
Experiment two consists in the elimination of tariffs on all sectors in trade among BRA, USA and EU. Table 4 shows applied tariffs in the EU and in the USA with respect to imports from Brazil. Applied tariffs for agricultural goods are high in both regions, particularly in the EU. On the other hand, as shown in Table 5, the highest applied rates in Brazil fall on industrialized products. The tariff practiced by Brazil for dairy products is also quite high.
This experiment indicates significant varia-tions in production of some products, mainly in
the European Union and Brazil (Table 6). Impor-tant reallocation occurs in world production of meat and sugar and some relocation also takes place in the production of the soybean sector. In Brazil meat production increases 38 percent and sugar production increases 24 percent. At the same time reductions in production of soybeans (8 percent), wood (5 percent), extraction (3 per-cent) and other manufactured goods (6 perper-cent) are observed. Note also the expansion of 2 percent in the production of other agricultural products which includes two important export
Table 4. Applied tariffs in relation to Brazil –
percent. EU USA Meat 49.9 1.2 Sugar 135.5 34.9 Dairy 8.5 21.8 Soybean 0.2 0.8 Other_ag 6.3 10.0 Cereals 2.8 0.6 Wood 2.1 0.8 Extraction 0.0 0.0 Other_mnf 1.2 0.7 Other 0.9 1.2
Source: GTAP 8.1 (GTAP…, 2012).
Table 5. Tariffs applied by Brazil – percent.
EU USA Meat 6.3 3.8 Sugar 5.9 15.5 Dairy 20.5 22.0 Soybean 10.1 10.3 Other_ag 9.7 10.6 Cereals 7.7 5.0 Wood 16.3 16.0 Extraction 2.5 0.1 Other_mnf 11.1 8.9 Other 1.8 2.3
Source: GTAP 8.1 (GTAP…, 2012).
Table 6. Percentage change in production.
USA EU BRA Meat 0.4 -8.3 38.0 Sugar -1.3 -20.3 24.4 Dairy -0.1 0.2 -1.2 Soybean 0.2 1.5 -8.0 Other_ag 0.3 -0.4 2.3 Cereals 0.2 -1.6 0.1 Wood -0.1 0.2 -5.1 Extraction -0.1 0.1 -3.3 Other_mnf 0.3 0.4 -6.0 Other 0.0 0.1 -0.5
products for Brazil: coffee and orange juice. In the EU meat and sugar production decrease 8 and 20 percent respectively. The USA sugar pro-duction decreases by 1 percent.
Production in most other regions and in most sectors, not shown in the Table 6, does not change significantly. However, sugar production in Africa and in other countries of Latin America decrease 3 and 2 percent respectively. Meat pro-duction in other Mercosur countries decreases by approximately 2 percent. Soybean produc-tion increases 1.5 percent in other Mercosur countries.
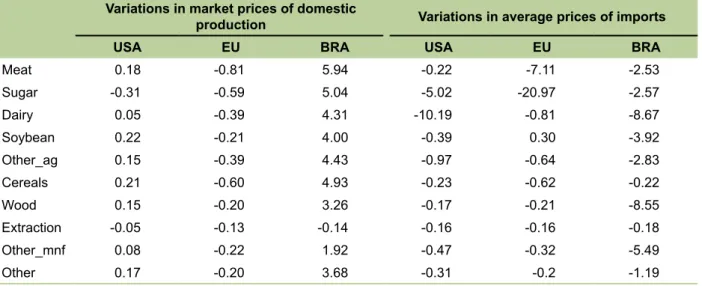
Significant variations in prices, as shown in Table 7, will take place. Market prices of all pro-ducts in Brazil increase; the only exception being the extractive industry where there is a slight ne-gative variation. The increase in domestic prices of manufactured products is inferior to that of other products. This is a consequence of the fact that the removal of high tariffs in Brazil caused reduction of about 5 percent in average prices of imports, resulting in substitution of domestic production by imports both in consumption and in use by other sectors.
The average import price shows a large reduction in both the USA and the EU. In the
latter there is also a high reduction in the pri-ce of imported meat. In Brazil dairy products, wood and manufactured goods experience large reductions.
Table 8 shows increases in imports in all three regions included in the agreement. The increase in Brazil is of the order of 14 percent; there is a small increase in imports by the USA compared to experiment one; and imports by the EU increase by 150 percent compared to Experiment one. Imports of regions that do not participate in the agreement are reduced, but world imports increase by US$ 60 billion or 130 percent when compared to Experiment one.
Table 9 shows that exports increase in all three regions involved in the deal but also in Asia and in China. The increases in Brazil will be concentrated in meats (157 percent) and sugar (91 percent), while reductions occur in all other products, except other agricultural products where the variation is practically zero. The main destination of Brazilian agricultural exports is the EU.
Table 10, shows that the increase in ex-ports of meat from Brazil to the European Union will be of the order of $ 20 billion, while EU exports to the EU itself will decrease by about
Table 7. Percent variation in prices.
Variations in market prices of domestic
production Variations in average prices of imports USA EU BRA USA EU BRA
Meat 0.18 -0.81 5.94 -0.22 -7.11 -2.53 Sugar -0.31 -0.59 5.04 -5.02 -20.97 -2.57 Dairy 0.05 -0.39 4.31 -10.19 -0.81 -8.67 Soybean 0.22 -0.21 4.00 -0.39 0.30 -3.92 Other_ag 0.15 -0.39 4.43 -0.97 -0.64 -2.83 Cereals 0.21 -0.60 4.93 -0.23 -0.62 -0.22 Wood 0.15 -0.20 3.26 -0.17 -0.21 -8.55 Extraction -0.05 -0.13 -0.14 -0.16 -0.16 -0.18 Other_mnf 0.08 -0.22 1.92 -0.47 -0.32 -5.49 Other 0.17 -0.20 3.68 -0.31 -0.2 -1.19
Table 8.
V
ariations in imports in US$ million – market prices.
USA EU BRA RMERCOSUR CHN Asia CANMEX ALA TINA AFR Others Total Meat 142 10,364 124 -20 -38 -178 -55 -109 -73 -719 9,437 Sugar 166 4,1 10 1 -2 -1 -43 -21 -41 -106 -364 3,698 Dairy 1,304 502 140 -2 1 2 -9 -17 -6 8 1,923 Soybean 68 -256 122 4 -269 -1 12 0 -25 -27 -102 -596 Other_ag 1,307 4 473 -46 -42 -147 -120 -71 -31 -65 1,263 Cereals 27 -318 312 -2 0 -103 -30 -53 -34 -93 -294 W ood 497 101 207 -18 -14 -22 -45 -40 -15 -29 623 Extraction 1,452 1,554 -727 -47 -257 -398 -30 9 9 -97 1,467 Other_mnf 14,584 9,498 16,058 -698 -534 -1,479 -1,542 -780 -333 -1,127 33,647 Other 8,760 151 6,271 -347 -353 -1,766 -1,078 -61 1 -334 -1,382 9,310 Total 28,308 25,710 22,981 -1,178 -1,508 -4,246 -2,930 -1,738 -949 -3,971 60,478 Source: GT AP 8.1, Experiment 2 (GT AP…, 2012). Table 9. V
ariations in exports in US$ million – fob prices.
USA EU BRA RMERCOSUR CHN Asia CANMEX ALA TINA AFR Outros Total Meat 795 -13,072 17,720 -216 -121 -201 49 -50 -64 -592 4,248 Sugar 9 -1,941 4,585 -5 -1 21 -56 -240 -316 -209 1,848 Dairy 998 1,106 -53 -23 -8 -49 -62 -9 -5 -312 1,583 Soybean 84 567 -1,848 276 16 311 61 25 24 130 -356 Other_ag 2,028 168 70 25 -102 -224 -210 -173 -128 -306 1,149 Cereals 69 -120 -387 157 13 4 24 3 0 18 -217 W ood 74 412 -524 -1 193 89 211 39 26 53 572 Extraction -159 -46 -57 132 21 62 222 11 6 93 1,086 1,470 Other_mnf 20,181 27,744 -6,423 -1,226 -1,677 -2,574 -1,646 -474 7 -2,206 31,705 Other -4,776 13,01 1 -7,447 375 1,876 4,046 1,099 539 276 1,988 10,987 Total 19,305 27,829 5,637 -506 210 1,485 -308 -225 -87 -350 52,989 Source: GT AP 8.2, Experiment 2 (GT AP…, 2012).
$ 14 billion. The USA also increases exports to the EU by about US$ 800 million, representing more than twice the value of exports before the reduction of tariffs.
Table 11 shows that Brazilian exports of sugar to the EU increase by about US$ 5 billion while exports of sugar within the EU decrease US$ 2 billion.
In the case of meat and sugar, the effects on exports from Brazil are very high. These demand stimuli explain, to a large extent, the significant increases in production of these sectors shown in Table 6, as well as explain the reductions in production of other sectors. Larger quantities of land, labor and capital are employed in these sectors and, as a result of the resource constraint of the economy, reduction in the use of these factors takes place in other sectors.
The following are comments on the ma-croeconomic effects of this tariff liberalization:
• In the USA and Brazil foreign savings increase, leading to an increase in the current account deficit of the balance of payments of US$ 3 billion and US$ 10 billion respectively. In all other regions foreign savings are reduced. The price of capital goods increases approximately 2 percent in Brazil and virtually no change takes place in the USA. In other regions there are reductions on the order of 0.2 percent in prices of capital goods. • The equivalent variation for the world
economy was around US$ 8 billion, indicating that the entry of Brazil in the agreement contributes greatly to global economic efficiency. In the USA the equivalent variation was US$ 6.6 billion; in the EU it was US$ 3.5 billion and in Brazil it was US$ 5.9 billion. With the entry of Brazil in the agreement the equivalent variation in the EU becomes positive, a fact that does not occur in the previous experiment where only the two regions eliminate tariffs. The EU gain is entirely based on allocative effect once
Table 10.
V
ariations in world meat exports/imports in US$ million – fob prices.
USA EU BRA RMERCOSUR CHN Asia CANMEX ALA TINA AFR Others Total USA 0 816 22 1 -25 -38 -49 14 2 52 794 EU 147 -14,049 58 4 36 178 8 9 49 509 -13,051 BRA -1 15 20,281 0 -32 -64 -516 -20 -187 -154 -1,471 17,720 RMERCOSUR 10 -357 25 3 4 4 2 29 7 58 -216 CHN 6 -186 3 1 0 37 0 1 2 15 -121 Asia 2 -287 1 0 1 31 1 0 6 44 -201 CANMEX 59 -79 0 0 2 28 3 6 2 26 49 ALA TINA 3 -1 18 2 2 1 10 4 42 0 5 -50 AFR 1 -1 17 1 0 1 3 0 0 22 24 -64 Others 27 -923 2 1 9 78 6 3 6 198 -593 Total 139 4,983 11 4 -19 -36 -186 -45 -83 -58 -540 4,268 Source: GT AP 8.1, Experiment 2 (GT AP…, 2012).
the terms of trade moves against the region.
Implications for the
Brazilian trade strategy
The analysis of the results of experiments performed above gives indications that may con-tribute to the Brazilian trade policy formulation.
Firstly it is clear that Brazil should attempt to integrate the free trade area USA / EU. The negotiations between the parties appear to be in an initial stage and it is difficult to foresee what will be in the final agreement. Nevertheless, the potential for expanding trade and income is ex-pressive and shouldn’t be ignored.
But Mercosur can be a major barrier sin-ce the existensin-ce of the common external tariff prevents member states to conclude agreements individually. A possibility that should be explo-red with the other members is to abandon the idea of a Customs Union in the region, keeping only the free trade area. Thus member countries would be free to negotiate individual agreements with other countries or regions.
The results also show that the negotiations will continue to be difficult. In the two experi-ments a reduction in trade in certain agricultural basic products within the EU will take place. In Experiment one meat exports in the EU decrea-sed by around US$ 900 million, which indicates that there may be resistance to the reduction of tariffs in this sector on the part of some EU member countries. Exports of dairy products and other agricultural products within the EU will also be reduced. In all cases increases in USA exports will be higher than the reductions in trade within the EU. In Experiment two the same type of adjustment for meats and sugar take place, but the reductions in exports within the EU will be in higher volumes: US$ 14 billion for meats and US$ 2 billion for dairy products, values that correspond to 27 percent and 55 per-cent respectively of the initial volume. The main supplier of these products will be Brazil.
Table 1
1.
V
ariations in world sugar exports/imports in US$ million – fob prices.
USA EU BRA RMERCOSUR CHN Asia CANMEX ALA TINA AFR Others Total USA 0 -5 0 0 0 0 9 1 0 3 9 EU 9 -2,023 0 0 0 1 1 1 10 136 -1,864 BRA 267 5,103 0 -3 -4 -80 -38 -50 -143 -468 4,585 RMERCOSUR -6 -7 0 1 0 0 0 2 1 4 -5 CHN 0 -2 0 0 0 0 0 0 0 1 -1 Asia -14 -62 0 0 1 20 0 0 13 63 21 CANMEX -40 -18 0 0 0 0 0 0 0 1 -56 ALA TINA -62 -219 0 0 2 3 6 17 1 11 -240 AFR -6 -355 0 0 0 4 0 0 36 5 -316 Others -13 -290 0 0 0 12 0 0 11 70 -209 Total 136 2,122 1 -1 -1 -39 -20 -28 -71 -175 1,924 Source: GT AP 8.1, Experiment 2 (GT AP…, 2012).
Resistance is also likely to be found in the USA. Production of sugar is reduced by 1.3 percent and imports of dairy products, other agricultural products, extraction and wood are relatively large and interested parties may resist tariff reduction.
The difficulties in the negotiations for the Brazil will also be significant. The elimination of tariffs will lead to increases in production and exports of meat and sugar. However, soybean, manufacture, wood and extractive producers will likely resist to the agreement as significant reductions in production will take place.
Summary and limitations
The article examined the impacts of tariff liberalization between the United States and the European Union, with special attention to the consequences on Brazil and on agricultural commodities. The repercussions on Brazil were not significant. However, if Brazil becomes part of the agreement, eliminating tariffs and with tariff-free access to the markets of those regions, there are effects of greater significance to Brazil and to the other members of the agreement.
Despite the favorable effects, one can foresee difficulties in negotiations in all three regions since several sectors will be affected negatively both in relation to production and to exports. In Brazil the main resistances are likely to be in manufactured goods which have higher tariffs than the other two regions. But reductions in production and exports of soybeans, wood and extractive industry are likely to induce op-position from interested parties in Brazil. In the
European Union there will be a reduction in trade among member countries, mainly in meat and in sugar. In the United States there will be reduction of sugar and dairy production and imports will increase.
Many uncertainties still surround the negotiations between the USA and the EU and one can’t predict how this will evolve, but the scenario of complete elimination of tariffs will not come true. Many other aspects that are on the negotiating table between the parties, as are the cases of export subsidies, domestic support measures and non-tariff barriers were not con-sidered in the analysis. Nevertheless, the results here may be useful for Brazilian policy makers as they formulate and negotiate with the private sector the country´s offers.
One message to be highlighted is that the country should strive to be part of a possible agreement between the European Union and the United States, even if this means that the clauses that make the Mercosur a Customs Union must be reviewed.
References
GTAP data bases: GTAP 8. [2012]. Available at: <https:// www.gtap.agecon.purdue.edu/databases/default.asp>.
Access: July 30th 2013.
HERTEL, T. W. (Ed.). Global trade analysis: modeling and applications. New York: Cambridge University, 1997. NARAYANAN, G.; BADRI, A. A.; MCDOUGALL, R. (Ed.).
Global trade, assistance, and production: the GTAP 8
data base. West Lafayette: Purdue University, Center for Global Trade Analysis, 2012. Available at: <https://www. gtap.agecon.purdue.edu/databases/v8/v8_doco.asp>.