UNIVERSIDADE DE LISBOA
FACULDADE DE FARMÁCIA
Mechanism-Based Approach to the
Economic Evaluation of Pharmaceuticals
Nazira Suleman
Dissertation supervised by Professor Nuno Elvas Silva and
co-supervised by Professor Dragana Lakić
Masters of Biopharmaceutical Sciences
Resumo
A farmacoeconomia é uma disciplina que avalia o uso de medicamentos em termos de recursos na maximização da saúde da população. Dado que os recursos para os cuidados de saúde são finitos, a avaliação económica envolve a estimativa do custo de oportunidade, i.e., os benefícios marginais perdidos como resultado do deslocamento de tratamentos ou serviços existentes para financiar novos medicamentos.
A farmacocinética é a ciência que visa o estudo do movimento de fármacos no organismo, o que inclui a absorção, distribuição, metabolismo e eliminação destes e seus metabolitos. Com o advento da química analítica e métodos de quantificação sofisticados, bem como de um aumento do poder de computação, a farmacocinética como ciência tem tido um desenvolvimento exponencial. Uma das áreas da farmacocinética que se tem desenvolvido mais é a farmacocinética populacional: apesar da farmacocinética de um fármaco poder ser estudada individualmente em cada indivíduo, a abordagem populacional é benéfica para o estudo de grupos de pacientes que são difíceis de investigar, como a população de bebés prematuros, pacientes com insuficiência hepática ou renal.
Na farmacocinética populacional, cada indivíduo é avaliado simultaneamente com o modelo de efeitos mistos não-lineares (parametrização). Não linear significa que a variável dependente dessa concentração está relacionada não linearmente à associação de variáveis independentes e parâmetros do modelo. Efeitos fixos refere-se aos parâmetros que não se alteram em indivíduos, enquanto o efeito aleatório se refere àqueles parâmetros que se alteram através dos indivíduos.
O principal objetivo das estimativas de modelação farmacocinética populacional é o de procurar os parâmetros de farmacocinética populacional e fonte de variabilidade. Os objetivos restantes consistem em concentrações observadas da dose administrada pela deteção das covariáveis preditivas na população avaliada. Em farmacocinética populacional, os indivíduos poderão apenas fornecer dados de concentração plasmática escassos.
As cinco principais partes fundamentais para a construção de um modelo farmacocinético populacional incluem: dados, modelo estrutural, modelo estatístico, modelo de covariáveis e software de modelação. Os modelos estruturais definem o perfil de concentração plasmática ao longo do tempo nos indivíduos. Os modelos estatísticos descrevem a variabilidade aleatória na população que não é explicável (como a variabilidade entre as ocasiões), entre a variabilidade do indivíduo ou a variabilidade residual. Os modelos de covariável demonstram a variabilidade estimada pelas características da população, como covariáveis. O software de modelação, como o software de modelação de efeitos mistos não linear, permite a combinação de dados e modelos e aplica o método de estimativa para avaliar parâmetros para os modelos estatísticos, estruturais e de covariáveis que definem os dados.
Na modelação farmacocinética populacional, o software possui um algoritmo de minimização do valor da função objetivo, praticando a estimativa de máxima verossimilhança. No momento da adaptação dos dados populacionais, a concentração estimada para cada indivíduo é influenciada pela variância dos parâmetros populacionais e de cada parâmetro individual, e
pela variação em cada valor das concentrações previstas e observadas. A avaliação da probabilidade marginal depende dos parâmetros de efeito aleatório (η) e efeito fixo da população. Não há existência de solução analítica para verossimilhança marginal. Enquanto buscava a máxima verossimilhança, inúmeras abordagens foram aplicadas para a aproximação da verossimilhança marginal. O FOCE e o LAPLACE são as abordagens mais antigas que estimam a verdadeira verossimilhança com uma função adicional simplificada.
O trabalho de dissertação no âmbito do Mestrado em Ciências Biofarmacêuticas teve por objetivo o estabelecimento de ferramentas baseadas em simulação de dados com base em modelos farmacocinéticos populacionais para uma posterior análise farmacoeconómica. Neste trabalho utilizou-se a informação disponível para a combinação fixa de Glecaprevir e Pibrentasvir (Mavyret®), medicamento usado no tratamento do vírus da hepatite C crónica. As simulações foram realizadas utilizando o software R e seu pacote Shiny. O R é uma linguagem para análise de dados de computação estatística e gráfica.
A população simulada no modelo foi agrupada de acordo com as covariáveis similares, sendo simulados 1000 indivíduos por cenário. O relatório de submissão da FDA do Mavyret® foi usado como referência na modelação farmacocinética populacional. Neste relatório encontra-se descrito o modelo farmacocinético populacional deencontra-senvolvido, com baencontra-se nos estudos clínicos realizados para o medicamento. No modelo descrito, foram identificadas diferentes covariáveis. O modelo descrito foi então implementado no software R e o impacto das covariáveis foi estudado com a aplicação Shiny. A população observada foi categorizada em diferentes grupos, tais como doentes tratados com Glecaprevir / Pibrentasvir com compromisso renal e doentes com compromisso renal e cirrose. Foram criados modelos individuais para cada um dos grupos e a comparação entre cada grupo e seus perfis de concentração-tempo foi realizada pelo uso do navegador R e Shiny, onde a atualização nos resultados pode ser vista automaticamente com a alteração em qualquer da covariável ou da variável.
Para os diferentes modelos finais incorporados no software e para a população simulada, foram calculados os parâmetros farmacocinéticos AUC e Cmax para posterior análise estatística descritiva.
Apesar da implementação dos modelos farmacocinéticos populacionais ter sido realizada em R e Shiny, e os dados terem sido simulados para os diferentes cenários populacionais, a aplicação de metodologias farmacoeconómicas não foram realizadas.
Palavras-chave
Farmacoeconomia, Farmacocinética, Farmacocinética Populacional, R Modelação, Shiny aplicação, Estatística Farmacocinética.
Abstract
Pharmacoeconomics is the discipline concerned with optimal allocation of resources to maximize population health from the use of medicines. Given that resources for health care are finite, economic evaluation involves estimation of the opportunity cost, that is, the marginal benefits forgone as a result of displacing existing treatments or services to fund new medicines.
The purpose of this study is to use tools in pharmacoeconomic analysis for the examination of the positive and adverse impact of the fixed dose combination of Glecaprevir and Pibrentasvir (Mavyret®), used to treat chronic hepatitis C virus. In order to examine the effects in pharmacoeconomics analysis, a population pharmacokinetic model was developed using R software and its package Shiny, where R is a language for data analysis of statistical computing and graphics.
The population simulated in the model was grouped according to the similar covariates with the number (n) of 1000. FDA submission report for Mavyret® was used as reference regarding population pharmacokinetics modelling, developed based on the clinical studies performed for the drug product. In the described model, different covariates were identified. The described model was implemented in the R software and the impact of covariates wwas studied with Shiny application. The population observed was categorized in different groups such as patients treated with Glecaprevir/Pibrentasvir having renal impairment and patients with renal impairment and Cirrhosis. Individual models were created for each of the groups and the comparison between each group and their concentration-time profiles was observed that was made easier by the use of R and Shiny web browser where the update in results can be seen spontaneously with the change in any of the covariate or the variable.
Different final models were produced and for the simulated population, the pharmacokinetic parameters AUC and Cmax were calculated for descriptive statistical analysis.
Despite the implementation of population pharmacokinetics models has been accomplished in R and Shiny, and data has been simulated for different population scenarios, pharmacoeconomic modelling and application of pharmacoeconomic methodologies was not practised.
Keywords
Pharmacoeconomics, Pharmacokinetics, Population Pharmacokinetics, R Modelling, Shiny Application, Pharmacokinetic Statistics.
Acknowledgement
It is my foremost duty to express my sincere thanks and deep regards to my supervisor Professor Nuno Elvas Silva for his able guidance and support in finalising my thesis and I pay my gratitude to him for cooperating at every step of progression. Unfortunately, I was not able to work with my co-supervisor Professor Dragana Lakić, with whom I once had a chance to meet, due to the shortage of time and lengthy learning or the R modelling.
I would also like to extend my gratitude and convey my heartfelt thanks to Helder Duarte who assisted me with an appropriate guidance and collaboration and provided me all the supervision as a co-supervisor, which was required throughout my project.
Without their help and proper supervision, my thesis might not have completed and I could not be able to undertake the whole project of learning.
In addition, I would convey special thanks to Professor Cecilia Rodrigues for the encouragement and support during the learning of my whole master programme.
Contents
I. Introduction ... 1
1. Population Pharmacokinetics... 1
2. Pharmacokinetic Modelling ... 2
2.1. Kinds of pharmacokinetic models ... 3
2.2. Meta-models ... 5
2.3. Bayesian model ... 5
2.4. Pharmacokinetic and pharmacodynamics models ... 5
2.5. Population model gears ... 6
3. Population methods ... 6
4. Application of population pharmacokinetic models ... 7
5. Population pharmacokinetics modelling methodology ... 8
5.1. DATABASES ... 8 5.2. Structural model ... 9 5.3. Statistical model ... 11 5.4. Covariate model ... 11 5.5. Modelling software ... 12 6. Pharmacoeconomic model ... 18 6.1. Methods of pharmacoeconomics ... 19
II. Materials and Methods... 22
7. Modelling in R and Shiny ... 22
7.1. Basic code for plotting and PK parameters caculations ... 22
7.2. Model with Ordinary Differential Equation (ODE) in Shiny ... 22
7.3. Model with ETA in Shiny ... 22
7.4. Model with Confidence Interval (CI) ... 23
7.5. Model with Slide bars ... 23
7.6. Modelling with the two compartmental models ... 23
8. Final modelling ... 24
8.1. Glecaprevir (GLE) modelling ... 24
8.2. Pibrentasvir (PIB) modelling ... 25
8.3. GLE and PIB modelling (with Shiny) ... 26
8.4. GLE and PIB modelling (without Shiny) ... 29
9. Pharmacokinetics parameters calculations ... 31
III. Results and Conclusions... 32
10. Modelling in R and Shiny ... 32
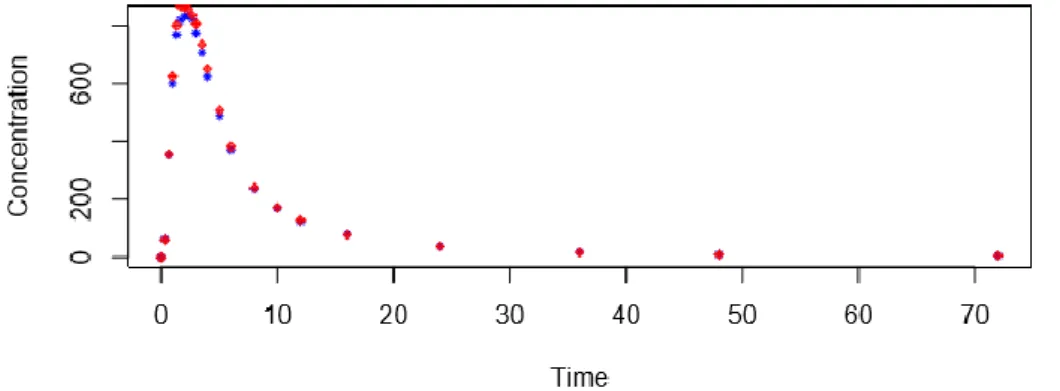
10.1. Basic code for plotting and PK parameters caculations ... 32
10.2. Model with Ordinary Differential Equation (ODE) in Shiny ... 33
10.4. Model with Confidence Interval (CI) ... 34
10.5. Model with Slide bars ... 35
10.6. Modelling with the two compartmental models (Attachment 9,10) ... 36
11. Final modelling ... 36
11.1. Glecaprevir (GLE) modelling (Attachment 11) ... 36
11.2. Pibrentasvir (PIB) modelling (Attachment 12) ... 37
11.3. GLE and PIB modelling (with Shiny) (Attachment 13) ... 38
11.4. GLE and PIB modelling (without Shiny) ... 38
IV. Conclusion ... 50
V. Bibliography ... 51
1
I. Introduction
The macroeconomic factors are progressively affecting the budgets of healthcare. The limitations of these budgets can help in the measures of cost suppression in health care area. In health economics and outcome research, pharmacotherapy is also extensively involved. The relationship of pharmacoeconomic and pharmacokinetic has a significant role in the efficiency of pharmaceutical use. An appropriate pharmacokinetics is the basis of producing the cost-effective drugs aimed by the research and development investments. An appropriate monitoring of drug can aid in the adequate use of drugs with the cost-effective results. Thus, biopharmaceutics and pharmacokinetics assist in providing prospects for the proper use of novel or existing drugs and for balancing of adequate market share.
Hence, pharmacokinetics can provide substantial economic benefits that are the normal outcome of their design as constrained drug input and prevention of high plasma concentrations resulting in toxic effect can be controlled by the diagnosis and treatment of adverse effects. The rational monitoring and improvements can eradicate the requirement of expensive re-examination of the drugs.
1. Population Pharmacokinetics
Pharmacokinetics is the science related to drug movement in the body that includes the absorption, distribution, metabolism and elimination of drugs and its metabolites [1]. It has been profited enormously from the developed analytical chemistry and computer science. Despite the pharmacokinetics of a drug can be studied individually in each subject, a population approach is beneficial for studying patient groups that are challenging to investigate, like premature infants, hepatic or renal impairment patients, etc. [2].
Population pharmacokinetics, also referred as population PK or popPK, is the study that is defined when standard dosage is administered in patient population and the sources of variability in plasma drug concentrations is monitored between them. Measuring the variability between their characteristics such as age, weight, sex, race, renal function and drug interactions can support to modify pharmacotherapy [3]. Observing the population allows the exploration of the variability in pharmacokinetics that exists between the patients, for instance a patient taking a drug with renal impairment shows variations in drug concentration that is excreted in the urine [2], [4].
The population pharmacokinetics methodology assisted the achievement of better prescribing by the examination of drug concentration time data that is gained from scheduled therapeutic analysis. Pharmacokinetic parameters derived from population pharmacokinetics study such as clearance could assist in prescribing patients individually [2], [5].
Traditional pharmacokinetic is typically related to healthy volunteers where several samples are taken at specific times while population pharmacokinetic involve patients being treated
2
with different doses and obtaining blood samples at different intervals. The muddled blood sampling and dosing regimens result in sparse data of 3-4 samples from each patient [2], [3].
2. Pharmacokinetic Modelling
Modelling and simulation are significant tools for incorporating data, information, and mechanisms to assist in reaching at sensible conclusions concerning drug development and its use. Figure 1 demonstrates a summary during the drug development procedure where modelling and simulation are frequently engaged. Building proper models can aid to analyse the time duration of exposure and response for multiple dosing routines [6]. An extensive implementation of population modelling methods can offer an outline for quantitating and monitoring variability in drug exposure and response.
The term population pharmacokinetics denotes to mixed-effects modelling that is a combination of random effects (variance model) and fixed effects (structural model). Random effects parameters comprise of inter-subject variability and unexplained variability when the model is fitted to the data. On the other hand, fixed effects are parameters that include clearance and those factors that expressively effect clearance such as age and weight.
Figure 1: Modelling and simulation during drug development [1]
Models are the basic tool for understanding and explaining the time duration of drug exposure and response when multiple formulations or doses of a drug are administered to the subjects. It is also a mean of assessment of linked parameters such as volume of distribution and clearance. Population models could be comprised of a small number of observations from every individual and can be compared to the subsequent parameter observation that helps to define the consistency between populations or observations. It can also give the comparison between other drugs that are in associated therapeutic category to develop the possibility of new therapeutic drug. Thus, it can be concluded that the main aim of assessing population
3
modelling is to create a mathematical method which defines drug’s pharmacologic time course in the variety of doses assessed in clinical trials.
Between-subject variability (BSV) in exposure and response is revealed in all drugs and the aim of their development is to identify and quantify this variability. For the improved safety and efficacy or appropriate controlling of variability in drug exposure it is important to understand the effect of factors that include weight, genotype, age, renal and hepatic function on exposure and response of drug [1].
Population modelling is a mean of identification and explanation of the association between the observed drug exposure and response and physiologic characteristics of individuals. Population pharmacokinetic modelling was first introduced in 1972 by Sheiner et al [5]. At the beginning, this method was introduced to work with the sparse pharmacokinetic data that was collected during the analysis of therapeutic drug but shortly it was widened to embrace models relating drug concentration to response such as pharmacodynamics [7], [8]. Subsequently, modelling is now significant measure in the development of drug.
Population parameters were initially predicted by two approaches that include naive pooled approach in which the data of all subjects is fitted collectively by ignoring their differences, and two stage approach in which the data of each subject is fitted independently, and parameter estimated of each individual is combined to calculate mean population parameters. Both of these approaches carry intrinsic difficulties that get worse when deficiencies and errors are present such as missing samples or dosing compliance which eventually cause biased parameter estimates [9]. The Sheiner et al. method solved the problems related to the previous approaches and allowed the combination of sparse data of numerous individuals to evaluate between subject variability (BSV), population mean parameters and the covariate influence that identify and quantify variability in drug response and exposure. This methodology also generated SE which permitted a degree of parameter accuracy.
The significance of each subject in population models is emphasized by estimation of variability, by recognizing the fluctuations in drug exposure with the variation of each covariate of the individual such as age or weight or consequent estimation of subject’s characteristics. The practice of pharmacometrics can expand the observation of the linear and saturable metabolism mechanism, notify to test the primary variety of doses, improve the dosage selection for subpopulations of subjects, and assess the study design precision [3].
2.1. Kinds of pharmacokinetic models
Pharmacokinetic models define the concentration and time association. Compartment is the primary concept of all PK models that is defined by the body area in which the drug is kinetically homogenous and fully blends. Compartments are recognised as the universal and essential component of PK models but the models are described by the difference of how the compartments are linked. In different tissues, the equilibrium between the drug concentrations does not appear instantly. Therefore, the hypothesis of one-compartment model often becomes void. After the administration of few drugs, mammillary model is sometimes
4
essential to define the plasma concentration data mathematically [10]. Mammillary models usually comprise of central compartment that demonstrate plasma with some peripheral compartments interrelated to the central compartment by constant rates such as K12 or K21 [11]. Often mammillary models have compartments that can be actual physiologic region e.g. extravascular fluid and blood but is not represented by any specific area of the body.
Physiological based models have one or more than one compartments that demonstrate a distinct organ in the body with those organs that are linked with the blood flow [12]. Physiological based models usually require tissue and plasma concentrations and the parameters should resemble the literature values. However, mammillary PK models can be represented by blood or plasma concentrations only. Consequently, the application of physiological based models to clinical data is complex but it gives the understanding of the disease and physiologic effects in drug nature. It can also provide an opportunity to render preclinical outcomes to clinical surroundings. The simple mammillary open model is a two-compartment model where the drug is introduced in both, central and peripheral compartments Figure 2.
Figure 2: Two-compartment model. K12, K21 and K10 are first-order rate constants: K12 = rate of transfer from central to peripheral compartment; K21 = rate of transfer from peripheral to central compartment; ka = rate of absorption and k10 = rate of elimination from central compartment.
One-compartment model
In one-compartment model, the central compartment (X1) consisting plasma or serum of blood that is used for sampling. The body represents kinetically homogenous division after the administration of the drug which means that the drug is distributed instantly all over the body and the drug rapidly equilibrates between tissues being highly perfused with blood such as heart, kidneys, lungs, brain and liver [13].
Two-compartment model
In two-compartment model, the peripheral compartment (X2) consisting organs and tissues, the body is resolved into both central and peripheral compartments. It involves tissues that are not well perfused with blood such as fat, skin and muscle. After the administration of drug into central compartment, the drug is distributed in central and peripheral compartment but
5
the distribution is not instantaneous due to less perfusion of tissues [13]. Inter-compartmental distribution follows a first order process.
Multi-compartment model
In multi-compartment model, the distribution of drug is into more than one compartment [13].
2.2. Meta-models
Meta-analyses mean “the analysis of analyses” [14]. These analyses from numerous subject studies are potentially strategic analyses of collective results such as mean to incorporate outcomes and create summarised calculations. Meta models play vital role in the comparison of the efficacy and safety of novel therapeutics with those treatments that are missing individual data e.g. to compare the treatments with the products that are in competition [15]. They are also useful for the re-examination of the data from the studies that has mixed results [16]. Meta models can define the progression of disease or pharmacodynamics and are currently used commonly in the drug development to make the success or failure decisions [17]. However, for the meta-analysis few steps should be taken into consideration such as:
a) Before commencing the work, the aims and objectives of the studies must be outlined. b) The data to be used should be comprehensive, unbiased and compatible. Only the
successful trials data should not be included.
c) Between treatment arms variability and between subject’s variability must be defined. d) The aggregate data and individual data should merge sensibly like the method of
combining the data should depend on the model [18].
The ambiguity of model is overlooked by the practice of choosing one model from a sequence of projected models and producing interpretations on the base of particular model. This could result in spoiled analytical presentation and ignore the better structures of other models.
2.3. Bayesian model
Bayesian model averaging is the practice of combining models and notifying the ambiguity of the model [19]. The Bayesian method is usually used in places where the drug has many models in the literature and the decision of choosing the appropriate model is not certain to evaluate novel study. The estimates of the accessible models can be definitely fitted and a particular model can be established which integrates many models. Consequently, the Bayesian model averaging approach permits the contribution of all the models for the simulation with the pre stated principles for the input to be decided according to the worth of the model or data and many other features [19].
2.4. Pharmacokinetic and pharmacodynamics models
Pharmacokinetic and pharmacodynamics models are significant for associating pharmacokinetic information to clinical settings and involve drug effect [20]. Continuous pharmacodynamics metrics in models usually appear as a continuous function with
6
concentration effect bond. The concentration in pharmacodynamics model can be defined as direct drug concentration in central compartment or as indirect in which the response of pharmacodynamics lags after the drug concentration in plasma. The discrete effect of pharmacodynamics models uses logistic equations frequently to transform the influence to a probability in individuals that can be linked to pharmacokinetic model. These discrete pharmacodynamics effects include treatment, success or failure and the adverse effects. The class of pharmacokinetic and pharmacodynamics models are exposure response models in which instead of time, a metric that defines steady state drug exposure is an independent variable such as maximum plasma concentration (Cmax), area under the curve (AUC) and dose.
2.5. Population model gears
Population modelling demands precise information of covariates, dosing and measurements. These models include number of components such as stochastic models, covariate models and structural models. Stochastic models demonstrate the random effects or variability in the data evaluated [21]. Covariate models define the effect of factors like time course of response in a disease or demographics of individual while structural models are demonstrated as differential or algebraic equations and define the measured response time course.
Advantages Disadvantages
Pharmacokinetic analysis generally include individuals taking drugs
Comparatively large number of patient is involved ( more than 40)
Can deal flexible study designs that take place during treatment
Difficult pharmaco-statistical analyses
Few samples are required from each patient involved in the study
Compilation, collection and verification of large amount of data is required
Opportunistic sampling could be cost-effective
Building model could be tiresome, time consuming and labour intensive
Quantification and screening of covariates for determining variability is needed
The diagnostics of models can be complex and time consuming
Inter-individual and intra-individual variability can be differentiated
Problems with controlling missing data such as all covariates in every patient
Modelling software is easily accessible such as NONMEM and R
Table 1: Advantages and Disadvantages of population pharmacokinetics modelling
3. Population methods
Population pharmacokinetic modelling approach is practiced in groups that are comprised of more than 40 individuals. In this study, instead of individuals, population is evaluated. Patients taking different doses on different timings are sampled. Population pharmacokinetics can predict oral bioavailability and the drug clearance. The most repeated value (mode) is usually used as a parameter which helps to achieve mean of population with the increase of
7
patients. Therefore, in population observation, the information gained by each individual is used to evaluate their potential value of parameter. The accuracy of these parameters depends on extent of data estimated from each individual and on the difference between their predicted values and standard population value.
Population pharmacokinetic approach is not a substitute method for the existence of sparse data or model building with many covariates because there are limitations in dealing with observed sparse data in population method. For instance, more than one data point should be available from each patient else there will be mystified inter individual variability. It is claimed in clinical perspective that a covariate should be included in a model only if it sufficiently decreases the pharmacokinetic variability to alter the prescribing. For instance, in the modelling gentamicin pharmacokinetics, renal function must be involved. When there are more than two covariates present in a model such as age and sex, the problem of masking rise in defining the source of variability and ultimately these complex models increase the errors in prescribing and are difficult to practice clinically.
4. Application of population pharmacokinetic models
Population pharmacokinetic modelling is labour extensive, time consuming and a complex method [22]. Population pharmacokinetic model gives the appropriate prediction of unknown but accurate values of pharmacokinetic parameters like all mathematical models. Plasma concentrations estimated in the model are uncertain up to some extent due to the ambiguity involved in the true value of the evaluated parameter from a data in which model is fitted. According to a saying it can be said that ‘all models are wrong, but some are useful’.
Population evaluations have several beneficial clinical applications like in those subjects for whom traditional pharmacokinetic analyses is hard due to difficulty in recruiting, such as patients under intensive care or infants.
Population pharmacokinetics is enormously practiced in Australia and has the possibility of better-quality clinical results by prescribing individually [23]. For instance, population pharmacokinetics approach is used to create a dosage nomogram for caffeine treating infants affected by apnoea of prematurity [24].
Population pharmacokinetic approach is a developing and significant measure of drug development, clinical and pre-clinical studies, and for investigation of post marketing. The pharmaceutical industry reveals outstanding reviews [25] and regulatory perspectives [26], and web based guidelines generated by regulatory agencies [27], [28]. However, these studies are playing great role in clinical application and research in an extensive range of patients and situations such as clotting disorders [29], serious infections [30], diabetes [31], pregnancy [32], malignancy [33], organ transplantation, arthritis, self-poisoning [34] and apnoea of prematurity [24], [35].
Many aspects should be taken into consideration for the pharmacokinetic model evaluation. The parameter estimation usually differentiates models that are at initial stages of
8
development and eradicates inadequate models. For further stages, simulation based approaches like visual predictive check (VPC) are beneficial when models with limited subjects are evaluated in final model [36]. For model diagnostics, Karlsson and Savic have given tremendous evaluation [37]. Model evaluations must be opted for the satisfaction and surety of the suitable model for proposed use.
5. Population pharmacokinetics modelling methodology
Population pharmacokinetics is the study of population where each individual is assessed simultaneously with nonlinear mixed effects model refers to the parameterization. Nonlinear mean that the variable which is dependant such a concentration, is related to the associated to independent variables and model parameters nonlinearly. Fixed effects refer to the parameters that do not change in individuals while random effect refers to those parameters that change through individuals.
The main aim of population pharmacokinetic modelling estimations is to look for the parameters of population pharmacokinetic and source of variability. The rest aims consist of observed concentrations of the dose administered by detecting the predictive covariates in evaluated population. Like single subject analysis, population pharmacokinetic approach does not demand scheduled time for sampling nor many observations from each individual. Therefore, few observations from each subject or sparse data and combination can be analysed.
The main five key parts for building a pharmacokinetic model include; data, structural model, statistical model, covariate model and modelling software. Structural models define the concentration time course in the subjects. Statistical models describe random variability in population that not explainable such as between occasion variability, between subject variability or residual variability. Covariate models demonstrate variability that is estimated by the characteristics of the population such as covariates. Modelling software such as nonlinear mixed effects modelling software combine data and models and apply the method of estimation to evaluate parameters for the statistical, structural and covariate models which define the data [38], [39].
5.1. DATABASES
Population analysis requires appropriate production of databases that is the most critical and time consuming part of the analysis [1]. To ensure the accuracy of the data, it should be well inspected. Before modelling, the graphical examination of data can detect possible errors and problems. Data records could reveal errors during the beginning of model evaluation or during data cleaning such as temporary or rapid fall of concentration which can be observed if they warrant an error that could harm the development of model.
Every evaluation consists of a lower concentration limit, in which the concentration could not be calculated appropriately if it is below that limit. On the calibration curve, the lower limit of quantification (LLOQ) is considered as the lowest standard which is 80-120% accurate and
9
20% precise [40]. The data below the limit of quantification (BLQ) is the data that is below the lower limit of quantification. If there are any samples in the data that are below the limit of quantification then the data detected close to the lower limit of quantification is normally censored. The effect of censoring can be observed by adding the line lower limit of quantification horizontally on plot of concentration vs. time. However, many studies show that the influence of censored data changes according to the circumstances when dealing with the below the limit of quantification data in population modelling [41]–[44]. Censoring could interpret variations in the outcomes when practised on the same data as population modelling approaches have more strong impact of censoring by lower limit or quantification than the methods of non-compartmental studies.
5.2. Structural model
Structural models have allegations for the selection of covariates [39]. Hence, evaluation of structural models should be cautiously done. The structural model is equivalent to an absorption model that defines the distribution of drug in blood for extravascular dosing and systemic model that defines kinetics after intravenous dosing. Mammillary compartment models take superior place in the literature, although pharmacokinetic models based on physiology play vital and developing role [12], [45].
Concentrations generally display one, two or three exponential phases when a particular part of the body gives data, which ultimately can be presented by systemic model with one, two, or three compartments respectively. By the plot of log concentration vs. time, the understanding of suitable compartment could be accomplished. When log concentrations decrease or increase with steady state in constant rate infusion, every distinct linear phase will require personal compartment.
Models with fewer compartments do not define the data accurately and ultimately illustrate bias in residuals vs. time plots while models with excess compartments display slight parameter estimation enhancement for increasing the number of compartments. Thus, the selection of number of compartments should be sensibly done. For extra peripheral compartment, parameters will meet the plasma concentration values that have slight influence such as low inter-compartment clearance CL and high volume or vice versa; or the parameters could be evaluated inappropriately. A significant attention should be paid to the accurate prediction of first order elimination. The rate of elimination in first order system is proportionate to concentration whereas clearance is constant.
The law of superposition illustrate the concept of increase in concentration with the increase of dose [6]. On the contrary, the rate of elimination is not dependant on concentration for zero order systems. Concentrations will rise by more than two folds when dose is doubled, as clearance in dependant on dose. With the rise of concentration, elimination progressively transfers to zero order state from first order state and saturate the elimination passages. To measure saturable elimination, pharmacokinetic data gathered from the population received single dose of drug is hardly enough, hence comparatively high range of doses is required. If steady state kinetics is not able to be estimated from single dose data then multi and single
10
dose studies both show saturable elimination. Indication of nonlinearity could be revealed by non-compartmental or graphical studies like, normalized AUC dependant on dose, dose-normalized concentrations that cannot be superimposed, multi-dose Css or AUCτ which is greater than estimated by single dose clearance and area under the curve.
For one compartment model and described rate of dose, saturable elimination is typically depicted by Michaelis–Menten equation [6].
𝐶 =𝐴 𝑉 dA dt = dose rate − ( Vmax ∗ C Km + C )
where dA/dt show rate of change in the amount of drug, Vmax is represented as the maximum rate of elimination and Km depicts the concentration related to semi Vmax. When C is less than Km, the rate converts to Vmax/Km*C in which Vmax/Km is inferred as the apparent first order clearance but when C in greater than Km, the rate comes to be Vmax in which it is interpreted as apparent zero order clearance. The extensive interrelation of Vmax and Km can make the estimation challenging for both as random effects parameters such as the segment of between subject variability. Generally Vmax is assumed as a function of accessible amount of elimination enzymes or transporters while Km is assumed as a function of the structure of the eliminating enzyme or transporters and drug.
The saturable elimination involvement into plasma concentrations must be analysed prudently in the areas of drug elimination, framework of drug and in the route of administration. As example, saturation in active tubular reabsorption drugs increases renal clearance and lower concentrations under the anticipated values from superposition whereas saturation in active renal tubular secretion lowers renal clearance but rise concentrations above the predicted value from superposition.
The bioavailability (F) is defined by the fraction of the dose that is administered by extravascular routes and goes into blood stream. The drug that is not absorbed by the body does not influence blood concentrations and consequently the resultant concentration appears lower due to the absorption of fraction of actual dose (F). The amount of drug absorption is dependent on the route of administration. However, it also can be influenced by the absence of physical entrance of drug in body for instance the residual of per os dose in gastrointestinal tract, during absorption transformation to a metabolite like drug cleared hepatically, accumulation or precipitation at injection area or a slow absorption component that is identified during study plan such as subcutaneous administration to lymphatic uptake of compounds.
Absolute bioavailability is referred as complete availability of dose such as from intravenous administration where F will be 100%. It can be predicted only with the simultaneous existence of intravenous and extravascular data.
11 5.3. Statistical model
The statistical model defines variability in the structural model. In pharmacokinetic model, the basic sources of variability are between-subject variability (BSV) and residual variability. The BSV shows variation of parameter in the subjects while the residual variability (RUV) is the variability that is not described when other sources of variability are monitored. Between-occasion variability is also expected by some studies in which the administration of drug in each individual takes place on more than two occasions that could be divided by adequate interval for the variation of fundamental kinetics in between the occasions. It is significant to build a proper statistical model for covariate estimations, simulations, appropriate use of models and to demonstrate the extent of residual variability in the data [6].
Residual variability results from numerous sources such as the model misspecification, assay variability, and miscalculations of sample time collection. As between-subject variability, residual variability model is selected on the basis of the nature of data to be estimated.
5.4. Covariate model
In pharmacokinetics calculations, it is important to identify the covariates that can predict the variability of pharmacokinetic. The potential covariates are generally selected by the class of drug, physiology or the identified properties of drug. For instance, drugs that are extremely metabolized contain the covariates commonly like genotype, weight or liver enzyme. The covariates should also go through the preliminary evaluation as the extensive run time could create a problem. Thus, the number of covariates in the model must be limited. Covariate screening can decrease the amount of evaluations using comprehensive additive models, techniques dependant on regression, or by correlation analysis that estimates the significance of covariates selected. Covariates are distinctly verified without covariate screening and all covariates are involved which are according to the required measures. The covariates identified in screening are individually evaluated with screening and the related covariates are all incorporated. The selection of covariates for nested models depends on the parameter estimation and likelihood ratio test (LRT). Hence, the specified levels in advance such as P < 0.01 or greater are set before the model based evaluations and the statistical significance can be caused by covariate effects. Then covariates are deleted backwards and fluctuations are analysed by LRT at tough criteria of parameter estimation. This method ends after the testation of all covariates and additional simplification of final model.
The inclusion of just statistically significant models in the model can create selection bias by practising stepwise method in model building. These models can result in exaggeration of significance of selected covariates. Multiple covariates evaluation with the extreme or moderate correlation such as weight and creatinine clearance can also cause selection bias that ultimately halts the true covariates discovery.
If values are continuous in sequence, extent and substance, covariates will also be continuous. On the other hand, if values are not connected and distinct or establish different classes,
12
covariates will also appear distinctly which should be dealt differently. Both data should guarantee the physiological results by the parameterization of covariates.
5.5. Modelling software
There are number of available population modelling software. The selection of the appropriate package should be taken into attention considering the support for package, awareness of users with the package and the extent of package reputation with the regulatory reviewers. Many pharmacometricians are experienced in few packages (just one or two). The idea of parameter estimation is implied by most packages in order to reduce an objective function value (OFV) by practicing maximum likelihood estimation [6]. The calculation of the likelihood is much complex in population modelling than only fixed effect models [6]. At the time of population data fitting, the concentration estimated for each individual is influenced by the variance in population parameters and each individual parameters, and the variance in each values of predicted and observed concentrations. The evaluation of marginal likelihood depends on the random effect (η) and fixed effect population parameters. There is no existence of analytical solution for marginal likelihood. While looking for maximum likelihood, numerous approaches were applied for the approximation of marginal likelihood. FOCE and LAPLACE are the older approaches that estimate the true likelihood with additional simplified function [46].
Recent approaches such as SAEM contain stochastic elimination and filtering approximations partly by iteration of trial and error. Every approach of estimation comprise of pros and cons such as stability in over parameterized models and accuracy of parameters and complexity of primary parameter predictions [47], [48]. In nonlinear mixed effect model, the estimation method of original first order is of concern that results with biased estimations of random effects. The estimation methods and the difference in their approaches are often considerable. However, it is sensible to apply two or more methods in the early phases of model building such as, by estimating goodness of fit with stimulated or predicted data.
Modelling with R
R is open source software environment and data analysis language for statistical computing and graphics. It can be run on diversity of Windows, MacOS and UNIX platforms. It can be downloaded from http://www.r-project.org. Multiple online learning sources of R are available. R software provides the combined collection of facilities to calculate, manipulate and display data graphically. It also offers the facility of:
Data storage and handling it effectively
Numerous operatives to evaluate groups, particularly matrices
An integrated and rational suite of tools that aid in effective data analysis
Service of graphical data analysis that can be displayed on the computer directly or can be provided as a hardcopy.
Offers a programming language (“S”) which is an effective and well-built to deal loops, user defined recursive roles, facilities of input and output and conditionals.
13
R is a mean of novel emerging approaches of interactive data analysis and its rapid development has been expanded by a huge list of packages. Nevertheless, programs in R are temporarily written that are for only one study of data analysis.
Population models play an essential part in the regulation, development and appropriate use of pharmaceuticals [6], [49]. Nonetheless, the methods are really time-consuming to make predictions from population models and left the enthusiastic pharmacometricians with the use of special software that concise it’s broader implication [50]. The flexible and sophisticated model output and data plotting are conceivable by the latest developments like ggplot2 package [51], [52] for the statistical language [53] and R data analysis. The models are required the process of re simulation and manual update to inspect different values for model parameters.
Advances in R and its packages specifically Shiny package have given an opportunity to R operators to display the output to web browsers for R [54]. Shiny, established by Rstudio is a package for R that can be installed in R or Rstudio. The installation of packages in R has numerous ways and the installation depends on the R interface and user’s operating system. RStudio that is an integrated development atmosphere for R can be installed from http://www.rstudio.com/. To install packages, Tools and install package can be used. Further dependencies of the package will be installed automatically by RStudio.
The broad spectrum nature of R language has allowed the programming of interactive pharmaco-metric models with the package of Shiny that ultimately creates a web- browser interface which is accessible by internet access on the any computer. Some tools developed by Shiny package and R comprising R code can be seen without the installation of R software. These include such applications that are meant to educate students at high school or a tool related to the population model simulation along with simulated variability. To operate R and Shiny package, just prior knowledge of R language is needed which is more complicated in other methods of web page designing. Berkeley Madonna’s software gives an access to substitute method that enables the models to specify as differential equations and the by the usage of sliders and radio buttons, simulated results for different parameters are presented [55]. This main objective of Berkeley Madonna is continued by R and Shiny that gives reactive update of output with the change in input by the help of widgets. Due to the blend of extended packages and flexibility in R language, the pharmacometricians are able to regulate the coding every component of a population model, attained output and the look of the user interface for the application. However, learning R and Shiny simultaneously is not suggested.
Shiny Application
Building of Shiny applications require two R scripts that have an interaction in between them;
A server script that is named as server.R (can be renamed as required) that integrates commands for the data processing, user input and output with the means of R language and from installed packages functions
14
A user-interface script is named as ui.R that regulates layout and appearance of the application.
For the learning of Shiny applications, RStudio has introduced tutorials and exercises on the website of Shiny [56]. These tutorials are supported by the articles defining Shiny skills, the pages of references for Shiny functions and a list of examples containing code. RStudio has also referred eleven built in examples in Shiny package. It is compulsory to install Shiny package and its dependencies to run the Shiny applications in RStudio or in R and the required R scripts (ui.R and server.R) must be present in the same directory. To present the application from RStudio, ui.R and server.R scripts are needed to open on RStudio and the function of ‘RunApp’ present in the top right corner should be clicked. To launch the applications from R, working directory is required to set at the place of application folder and at the end RunApp option is required to use. Ultimately, a Web browser window will be open by Shiny where everything will be displayed.
User-interface (ui.R)
There is number of built-in widgets and modifiable layouts for applications in Shiny which enables the effortless and easier building of user-interface. Creators can choose any of the existing options of layouts that are adjustable to the sizes of different browsers of devices such as computer, phone and tablet. The tabs or sidebars can also be included that distinguish the input and output. Any alteration can also be made on the displayed layout after meeting particular conditions of input. The ui.R scripts include the code that instruct the layout of application, its appearance, widgets of input such as sliders, check boxes, buttons, selection boxes and so on, and the output. The basic components that define the user-interface of the application are;
fluidPage(fluidRow( h2(“Heading”),
plotOutput(“plotCONC”),
sliderInput(“Title”, “Covariate:”, min = ‘value’, max = ‘value’, value = ‘value’, step = ‘value’),
align = “center”))
In the layout function, all code required for the user-interface contents should be in the brackets. The functions of layout (as stated above) like fluidPage is required to make a canvas for the interface and fluidRow is used to position the widgets of the user-input such as sliderInput is used to generate a slider and plotOutput function is needed to plot an object. Every function of layout possess its outline for placing elements while other functions such as fixedPage and navbarPage depending on their functions are capable of creating pages with different designs. Nevertheless, each function follows the similar classified structure in which the functions like sliderInput or widgets are placed in a layout function of fluidPage and in a positioning function of fluidRow. The same level functions are placed in sequence that are separated by “,” within their higher level function.
15
If there is any error from Shiny or R packages, the message of an error will prevail at the time of opening the application in the Web browser and after closing the application it will be seen in the R console. The evaluation of the appropriate opening and closing of the brackets prior to initiation of the application can aid to avoid error messages. After getting a detailed ui.R, functions written at the beginning in the script become more complicated to detect. For this problem free source code editor software or RStudio can help at the time of writing code as they highlight any error made such as unclosed brackets. The minor errors can be detected by these functions but if there is an existence of a major error with a non-functional application, a Web browser page will be displayed with the grey colour. Generally, other messages relating to error give a number of the line where the code is written or provide the name of function in question. While evaluating the pharmacometric model coding, it is sensible to write a generic R script to confirm its successful working before integrating the model in Shiny application.
The arrangement of server.R code has a critical impact on illustrating commands for the application whereas it enhances the speed or application and reduces unnecessary computation. The ShinyServer function needs input and output object from ui.R. Objects that are influenced by the input widgets present in ui.R e.g input$KA, are called “reactive”. Whenever there is change in input from a widget, reactive object also changes its value accordingly. To process and describe the reactive objects, the related expressions should be written in a render* function in order to get a reactive output to ui. The term (*) represents the description of the output object such as a text, plot or a table. By the render* function, a reactive expression used to deal with a list of reactive data frames which could be directed to user-interface.
The function of renderPlot that comprise of input objects such as (KA and V), calculation expressions for concentration and ggplot2 [52] to plot concentration vs time (plotobj), will update to reflect the change of every widget and the updated plot object will be saved for the output object as plotCONC. It is recommended to enclose code within ShinyServer and render* functions to avoid the sluggish speed of the application due to detailed code. At the start of the script, code is run just one time when the application is commenced, it does not require running every time with the change of widgets. Thus, it is considered an ideal area to load libraries, datasets, define constant expressions or source code. All of the functions and libraries could also be saved in another script that is named as ‘global.R’.
The code written in ui.R script is called in sequence by Shiny (from left to right and from top to bottom). The layout function arranges the elements in sequence and the user-interface show the elements accordingly.
fixedPage(fixedRow(
16
Above is the example of code that defines the layouts. A fixedPage layout aligns elements in a fixed width and in rows and columns such as widgets and output text or plot. FixedRow command show the elements in a same line and the column command allows the space horizontally and the elements are ordered in a wide grid of 12 units. However, fluidPage and fliudRow organize the page layout according to the browser dimensions in which the application in open. Each element is given a width and a column. If there are more elements to be added, they should be written under the heading with a new row by using fixedRow and column similarly as above while the dimensions can be defined according to the requirement of the content. The layout fixedPage is not restricted to fixedRow function, similarly fluidPage and fluidRow act in a same way. The utilization of sidebarLayout in the application forms a sidebar that appears as a bordered part in a user-interface along with a background. sidebarLayout can arrange the elements to the sidebar with the function of sidebarPanel or by mainPanel function to an unformatted area, instead to assigning elements into columns. There are other functions for layout such as tabsetPanel and navlistPanel which make the sections of the user-interface e.g. tabs on the navigation list divided for different tables and plot that can be mixed-up if not separated [56].
The widgets are elements that are interactive and give the users an opportunity of exploration of different categories or values of variables or parameters. The selected values are stored by the widgets and called by the server.R, render* functions or reactive function process them for output which ultimately are directed to the user-interface for the presentation. Hence, if a widget is changed, the value called by server.R will also change followed by the change in the output. There are plenty of prebuilt widgets combining R functions and an analytical thread of arguments in Shiny package.
The help can be acquired by writing in R the symbol “?” and then writing the name of input function of a widget (e.g. ?fixedPage). Each function of widget is named in order to be called by server.R from ui.R that is not visible to the users while a label argument that is also important to write, is visible to the user. To complete the function, other arguments required depend on the type of widgets such as selections for selection boxes and for sliders min, max, value and step values. Some widgets have advantage over others that they confirm users can select only possible values by limiting the biological possibilities or by restricting the code in server.R. The example of the widget code in ui.R for the selection box for dose frequency in sidebarPanel is presented below:
sidebarPanel(selectInput(“FREQ”, “Drug Frequency:”,
choices = list(“Once a day” = 1, “Twice a day” = 2, selected = 1)),
This code will create a selection box by the selectInput function. “FREQ” is the name of widget that will be called by the server.R as input$FREQ. the user-interface label here will be “Drug Frequency”. An argument is also needed for choices such as a list of labels assigned to the numbers. It is modifiable and ‘selected’ can be included which is the allocated number to value from choices to be displayed on initiation of application. It can also allot the box width in pixels and give option for multiple choices. On the other hand, a slider widget can also
17
provide these limitations in which the user can only slide the bar to the available values such as 1 = once a day, 2 = twice a day and so on. The example of code required for the slider is as follows:
sliderInput(“FREQ”, “Drug Frequency:”, min = 1, max = 2, value = 1, step = 1),
Rather than a slider, a selection box can give a precise classification by the help of text. Widget selection should be made on the basis of user audience concern, capability of communicating the aim and kind of variables to which it will attach such as categorical vs. continuous. The variety of widgets can mess the user-interface easily, thus it is recommended to limit the free availability of widgets by the user. For this purpose, an option provided by Shiny can be used that has an ability of concealing or displaying elements of widgets for particular situations with the usage of renderUI in server.R and conditionalPanel in ui.R. The example of conditionalPanel in checkboxes is as follows:
conditionalPanel(condition = “input.FREQ == 2”, checkboxInput(“Drug1”, “Missed on 2nd Day:”, value = FALSE), checkboxInput(“Drug2”, “Drug Doubled on 3rd Day:”, value = FALSE)),
The conditionalPanel has a condition argument that is assessed frequently to decide the display of the following elements. However, these two conditionalPanel checkboxes will be displayed only when the selection box widget (Drug Frequency) will be selected as 2. The checkbox widget doesn’t have numbers, thus the value argument relating to the first input is only dealt by TRUE and FALSE, if it is TRUE, the output will be affected while FALSE doesn’t influence the output anyway.
The other types of widgets include radio buttons (radioButtons) that are most used in pharmacometrics, downloadbuttons (downloadButtons), and slider ranges in which two values can be selected on the ends of slider (sliderInput).
Heading (h) are the functions in Shiny used to define the heading and like widgets, they are coded in layouts in a fixedRow (positioning function). The heading can be made in variety of sizes and the code used for the size is h1, h6 and p. The first level of heading is largest (h1), the sixth level header is the smallest (h6) and text paragraph is generated by (p). The align argument is used to set the alignment of heading as illustrated below:
h2(“Title”, align = “center”)
Breaks coded as br() and lines coded as hr() are used in the application to make a partition of the heading and the functional elements. They both can adopt the level of positioning functions (fixedRow) or similar to widgets.
*Output functions in Shiny call from server.R the objects that are reactive to the user interface. (*) in *Output describes an object i.e. table, text or a plot. In the user interface, they are constructed in an order similar to widgets by writing the function *Output in the user
18
interface script in a positioning function. Following is a ui.R code where a reactive plot is included in the mainPanle by the use of plotOutput which accordingly updates with a widget change:
mainPanel(plotOutput(“Output argument”, height = ‘value’, width = ‘value’))
The reactive object should be named to identify each *Output function when called by server.R. Labels cannot be assigned to *Output functions and output objects names are not visible to the users. Thus, in server.R, for the reactive object titles or headings are required in the expressions while in ui.R heading element is needed to build. Every *Output function can possess a particular argument due to its individuality such as plotOutput the arguments of height and width for specifying the plot dimensions. Other *Output functions own the names that define their goal such as imageOutput, tableOutput, uiOutput, htmlOutput and textOutput.
6. Pharmacoeconomic model
Pharmacoeconomics is related to the scientific authority where the value of drug therapy or pharmaceutical drugs is compared [57], [58]. The study of pharmacoeconimcs assesses the pharmaceutical products in terms of finance by its cost, effects, or efficacy. This study assists in leading scientifically towards the means of ideal allotment healthcare. Pharmacoeconomics emphasis on the pharmaceutical evaluation economically by practicing cost benefit analysis (CBA), cost utility analysis (CUA), cost minimization analysis (CMA) and cost effectiveness analysis (CEA) [59]. The quality adjusted life year (QALY) is a main health outcome of importance in pharmacoecomics evaluations that involves quantity and quality of life. Cost per QALY analysis is practiced by many studies. Economic evaluations of pharmaceuticals are progressively practiced and are executed in conjunction with the randomized controlled trials and decision analytic modelling approaches. The healthcare deciders focus and recognize the money value from healthcare interferences.
Pharmacoeconomics method plays a vital role in the economic assessment of several treatment decisions. The main complication associated to economics is scarcity that means it limits the choices for the allotment of healthcare funds. If the expenses in one region of healthcare are high, it will definitely affect the expenses to be made in other region with the limit amount. The economists use the method of prediction for the advantages by opportunity cost. Pharmacoeconomic evaluation method gives a prospect of defining the treatment options by estimating the amount of income to attain highest health benefit by money spent per unit, which can be gained by accessing opportunity cost of apportioning resources to a specific option of treatment.
With the development and licensing of costly pharmaceuticals, pharmacoeconomic evaluation prove to be extremely beneficial particularly for the developing countries where scarcity obstacles the resources for the implementing the ideologies of pharmacoeconomics for different treatment options and drugs. It is imperative in order to gain lowest cost with the maximum progression in the quality of healthcare and life [60].
![Figure 1: Modelling and simulation during drug development [1]](https://thumb-eu.123doks.com/thumbv2/123dok_br/19291714.993219/9.892.179.710.556.896/figure-modelling-simulation-drug-development.webp)
![Table 2 : Parameter estimates for the final Glecaprevir model [71]. IIV = inter-individual variability, SEE = Standard Error of Estimate, % RSE = (Relative Standard Error),](https://thumb-eu.123doks.com/thumbv2/123dok_br/19291714.993219/32.892.135.759.124.501/parameter-estimates-glecaprevir-individual-variability-standard-estimate-relative.webp)
![Table 3: Parameter estimates for the final Pibrentasvir model [71]. IIV = inter-individual variability, SEE = Standard Error of Estimate, % RSE = (Relative Standard Error),](https://thumb-eu.123doks.com/thumbv2/123dok_br/19291714.993219/33.892.155.746.126.552/parameter-estimates-pibrentasvir-individual-variability-standard-estimate-relative.webp)
![Table 4: Average ages of Phase 2 clinical studies made in FDA submission report for Mavyret ® [71], accessed in clinical trial website [74]](https://thumb-eu.123doks.com/thumbv2/123dok_br/19291714.993219/36.892.100.795.908.1061/average-clinical-studies-submission-mavyret-accessed-clinical-website.webp)
![Table 5: Average ages of Phase 3 clinical studies made in FDA submission report for Mavyret ® [71], accessed in clinical trial website [74]](https://thumb-eu.123doks.com/thumbv2/123dok_br/19291714.993219/37.892.112.794.292.468/average-clinical-studies-submission-mavyret-accessed-clinical-website.webp)