Table 1 – Demographic Characteristics and nosological of attendance for children and adolescents with mental
and behavioral disorders by use of psychoactive substances performed in Psychosocial Care Centers,
Brazil, 2008-2012
Variables
Year
Total
2008 2009 2010 2011 2012
n % n % n % n % n % n %
Sex
Female 3,941 19.4 4,131 17.5 5,490 17.8 6,755 18.1 8,081 20.7 28,398 18.8
Male 16,501 80.7 19,531 82.5 25,412 82.2 30,580 81.9 30,908 79.3 122,932 81.2
Age group (in years)
5-9 256 1.2 201 0.8 219 0.7 298 0.8 213 0.5 1,187 0.8
10-14 3,540 17.3 3,879 16.5 4,783 15.5 5,200 13.9 5,608 14.5 23,010 15.3
15-19 16,646 81.4 19,582 2.8 25,900 83.8 31,837 85.3 33,168 5.1 127,133 4.0
Ethnicity/skin color
White 6,835 33.4 7,105 30.0 8,083 26.2 10,434 27.9 11,584 29.7 44,041 29.1
Black 1,136 5.6 1,145 4.8 1,482 4.8 1,741 4.7 1,828 4.7 7,332 4.8
Brown 4,245 20.8 4,353 18.4 5,373 17.4 7,381 19.8 8,268 21.2 29,620 19.6
Asian 274 1.3 284 1.2 264 0.8 261 0.7 448 1.1 1,531 1.0
Indigenous 9 0.0 5 0.0 3 0.0 22 0.1 30 0.1 69 0.0
No information 7,943 38.9 10,770 45.5 15,697 50.8 17,496 46.9 16,831 43.2 68,737 45.4
Cause of attendance
F10 a (alcohol) 2,242 11.0 2,620 11.1 2,699 8.7 2,849 7.6 3,207 8.2 13,617 9.0
F11 b (opioid) 80 0.4 76 0.3 86 0.3 123 0.3 182 0.5 547 0.4
F12 c (cannabinoids) 2,924 14.3 3,600 15.2 4,455 14.4 5,870 15.7 6,729 17.2 23,578 15.6
F13 d (sedatives) 62 0.3 51 0.2 92 0.3 120 0.3 53 0.1 378 0.2
F14 e (cocaine) 2,511 12.3 3,284 13.9 5,145 16.6 6,721 18.0 6,026 15.5 23,687 15.6
F15 f (stimulants) 150 0.7 49 0.2 71 0.2 151 0.4 181 0.5 602 0.4
F16 g (hallucinogens) 29 0.1 50 0.2 51 0.2 226 0.6 70 0.2 426 0.3
F17 h (tobacco) 258 1.3 186 0.8 262 0.8 312 0.8 321 0.8 1,339 0.9
F18 i (solvents) 470 2.3 294 1.2 255 0.8 197 0.5 161 0.4 1,377 0.9
F19 j (multiples SPAk) 11,716 57.3 13,452 56.8 17,786 57.6 20,766 55.6 22,059 56.6 85,779 56.7
Total 20,442 13.5 23,662 15.6 30,902 20.4 37,335 24.7 39,119 25.8 151,330 100.0
a) F10: Mental and behavioral disorders due to use of alcohol. b) F11: Mental and behavioural disorders due to use of opioids. c) F12: Mental and behavioral disorders due to use of cannabinoids. d) F13: Mental and behavioral disorders due to the use of sedatives and hypnotics. e) F14: Mental and behavioral disorders due to use of cocaine.
f) F15: Mental and behavioral disorders due to use of other stimulants, including caffeine. g) F16: Mental and behavioral disorders due to the use of hallucinogens.
h) F17: Mental and behavioral disorders due to use of tobacco. i) F18: Mental and behavioral disorders due to use of volatile solvents.
j) F19: Mental and behavioral disorders due to use of multiple drugs and the use of other psychoactive substances. k) SPA: Psychoactive Substances.
Sources: Authorization for outpatient procedures (APAC); International Statistical Classification of Diseases and Related Health Problems, 10th Revision (ICD-10).
1
Table 2 – Distribution of records of attendance due to mental and behavioral disorders by use of psychoactive
substances, according to type of Psychosocial Care Center and great national region, Brazil, 2008-2012
Type of CAPS
Region
Total
North Northeast Southeast South Midwest
n % n % n (63,165) % n % n % n %
CAPS Ia 210 5.7 2,098 7.4 981 1.5 2,416 5.3 307 2.8 6,012 4.0
CAPS IIb 98 2.7 417 1.5 4,645 7.3 215 0.5 7 0.1 5,382 3.6
CAPS IIIc 6 0.2 176 0.6 222 0.3 17 0.0 95 0.9 516 0.3
CAPSid 39 1.7 2,664 9.4 6,380 10.1 6,482 14.3 129 1.2 15,694 10.4
CAPS ADe / CAPS AD IIIf 3,322 90.4 22,973 81.1 50,937 80.6 36,245 79.9 10,249 95.0 123,726 81.8
Total 3,975 100.0 28,328 100.0 63,165 100.0 45,375 100.0 10,787 100.0 151,330 100.0
a) CAPS I: Psychosocial Care Center type I. b) CAPS II: Psychosocial Care Center type II. c) CAPS III: Psychosocial Care Center type III. d) CAPSi: Psychosocial Care Center for Childhood and Youth. e) CAPS AD: Psychosocial Care Center for Alcohol and other Drugs. f) CAPS AD III: Psychosocial Care Center for Alcohol and other Drugs 24 Hours.
3
Variables
Year
Total
2008 2009 2010 2011 2012
n % n % n % n % n % n %
Sex
Female 3,941 19.3 4,131 17.5 5,490 17.8 6,755 18.1 8,081 20.7 28,398 18.8
Male 16,501 80.7 19,531 82.5 25,412 82.2 30,580 81.9 30,908 79.3 122,932 81.2
Age group (in years)
5-9 256 1.3 201 0.8 219 0.7 298 0.8 213 0.5 1,187 0.8
10-14 3,540 17.3 3,879 16.5 4,783 15.5 5,200 13.9 5,608 14.5 23,010 15.2
15-19 16,646 81.4 19,582 82.7 25,900 83.8 31,837 85.3 33,168 85.0 127,133 84.0
Ethnicity/skin color
White 6,835 33.4 7,105 30.0 8,083 26.2 10,434 27.9 11,584 29.7 44,041 29.1
Black 1,136 5.6 1,145 4.8 1,482 4.8 1,741 4.7 1,828 4.7 7,332 4.9
Brown 4,245 20.8 4,353 18.4 5,373 17.4 7,381 19.8 8,268 21.2 29,620 19.6
Asian 274 1.3 284 1.2 264 0.8 261 0.7 448 1.1 1,531 1.0
Indigenous 9 0.0 5 0.0 3 0.0 22 0.1 30 0.1 69 0.0
No information 7,943 38.9 10,770 45.6 15,697 50.8 17,496 46.8 16,831 43.2 68,737 45.4
Cause of attendance
F10 a (alcohol) 2,242 11.0 2,620 11.1 2,699 8.7 2,849 7.6 3,207 8.2 13,617 9.0
F11 b (opioid) 80 0.4 76 0.3 86 0.3 123 0.3 182 0.5 547 0.4
F12 c (cannabinoids) 2,924 14.3 3,600 15.2 4,455 14.4 5,870 15.7 6,729 17.2 23,578 15.6
F13 d (sedatives) 62 0.3 51 0.2 92 0.3 120 0.3 53 0.1 378 0.2
F14 e (cocaine) 2,511 12.3 3,284 13.9 5,145 16.6 6,721 18.0 6,026 15.5 23,687 15.6
F15 f (stimulants) 150 0.7 49 0.2 71 0.2 151 0.4 181 0.5 602 0.4
F16 g (hallucinogens) 29 0.1 50 0.2 51 0.2 226 0.6 70 0.2 426 0.3
F17 h (tobacco) 258 1.3 186 0.8 262 0.9 312 0.9 321 0.9 1,339 0.9
F18 i (solvents) 470 2.3 294 1.2 255 0.8 197 0.6 161 0.4 1,377 0.9
F19 j (multiples SPAk) 11,716 57.3 13,452 56.9 17,786 57.6 20,766 55.6 22,059 56.6 85,779 56.7
Total 20,442 13.5 23,662 15.6 30,902 20.4 37,335 24.7 39,119 25.8 151,330 100.0
a) F10: Mental and behavioral disorders due to use of alcohol. b) F11: Mental and behavioural disorders due to use of opioids. c) F12: Mental and behavioral disorders due to use of cannabinoids. d) F13: Mental and behavioral disorders due to the use of sedatives and hypnotics. e) F14: Mental and behavioral disorders due to use of cocaine.
f) F15: Mental and behavioral disorders due to use of other stimulants, including caffeine. g) F16: Mental and behavioral disorders due to the use of hallucinogens.
h) F17: Mental and behavioral disorders due to use of tobacco. i) F18: Mental and behavioral disorders due to use of volatile solvents.
j) F19: Mental and behavioral disorders due to use of multiple drugs and the use of other psychoactive substances. k) SPA: Psychoactive Substances.
Sources: Authorization for outpatient procedures (APAC); International Statistical Classification of Diseases and Related Health Problems, 10th Revision (ICD-10).
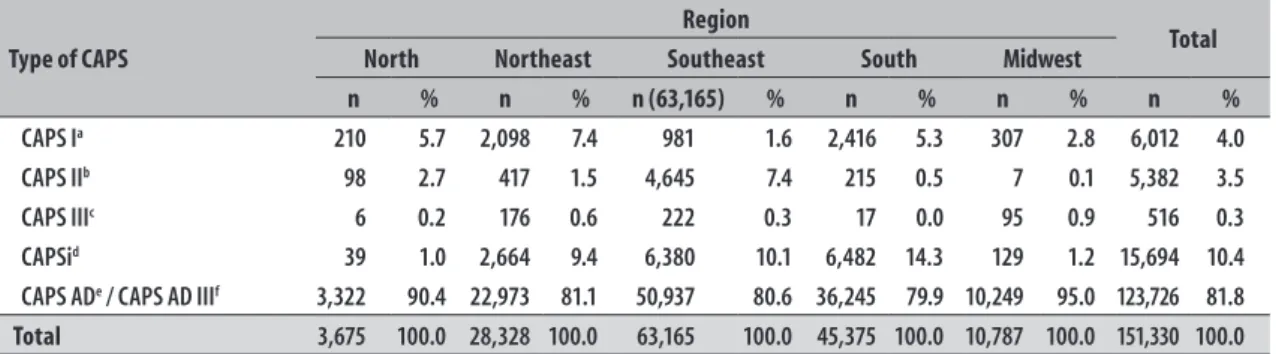
Table 2 – Distribution of records of attendance due to mental and behavioral disorders by use of psychoactive
substances, according to type of Psychosocial Care Center and great national region, Brazil, 2008-2012
Type of CAPS
Region
Total
North Northeast Southeast South Midwest
n % n % n (63,165) % n % n % n %
CAPS Ia 210 5.7 2,098 7.4 981 1.6 2,416 5.3 307 2.8 6,012 4.0
CAPS IIb 98 2.7 417 1.5 4,645 7.4 215 0.5 7 0.1 5,382 3.5
CAPS IIIc 6 0.2 176 0.6 222 0.3 17 0.0 95 0.9 516 0.3
CAPSid 39 1.0 2,664 9.4 6,380 10.1 6,482 14.3 129 1.2 15,694 10.4
CAPS ADe / CAPS AD IIIf 3,322 90.4 22,973 81.1 50,937 80.6 36,245 79.9 10,249 95.0 123,726 81.8
Total 3,675 100.0 28,328 100.0 63,165 100.0 45,375 100.0 10,787 100.0 151,330 100.0
a) CAPS I: Psychosocial Care Center type I. b) CAPS II: Psychosocial Care Center type II. c) CAPS III: Psychosocial Care Center type III. d) CAPSi: Psychosocial Care Center for Childhood and Youth. e) CAPS AD: Psychosocial Care Center for Alcohol and other Drugs. f) CAPS AD III: Psychosocial Care Center for Alcohol and other Drugs 24 Hours.
5
Epidemiol. Serv. Saude, Brasília, 27(2):e2018227, 2018
Figure 2 presents the prevalences of medical visits found in the 18 studies,
17-25, 27, 29-34, 36, 37N.B.: The following references should be taken to have one number less than the number shown, i.e. consult the
reference immediately prior to the reference cited.
Original text: Corrected text:
45 44
46 45
47 46
48 47
49 48
50 49
51 50
52 51
53 52
54 53
55 54
56 55
57 56
58 57
59 58
60 59
61 60
62 61
63 62
64 63
65 64
66 65
67 66
68 67
69 68
70 69
71 70
72 71
73 72
74 73