Food Science and Technology
DO:
D https://doi.org/10.1590/fst.03717
OSSN 1678-457X (Dnline)
1 Introduction
Caja tree is native to tropical America and belongs to the Anacardiaceae family, Spondias genus, and produces a fruit known as caja-manga (Spondias mombin L), with your pulp, peel, and seeds, very appreciated in Brazil, and utilized of natural form or in of beverages, candies, ice creams, and jellies (Mattietto et al., 2010; Carvalho et al., 2008; Franquin et al., 2005; Miller & Schaal, 2005).
Fruit growth is characterized by rapid division and cell elongation, with an irreversible increase in weight, diameter, and length, which are influenced by genetic and environmental factors such as temperature, solar radiation, and precipitation (Berilli et al., 2007). The ripening stage leads to physiological maturity, defined as the stage where the fruit will continue developing even detached (Watada et al., 1984), when considering the climacteric fruits.
At the end of maturation, ripening starts with changes in nutritional and sensory characteristics, such as changes in color, texture, flavor, and aroma, transforming them into acceptable and commercially attractive products (Chitarra & Chitarra, 2005). At the end of ripening, there is a reduction of the synthesis and a predominance of degradation processes, that characterize the senescence stage. The main physiological changes that occur at this stage are loss of sensory and nutritional characteristics
(Dms-Dliu et al., 2011). Fruit development happens according to the physiological processes from plant forming until death, including growth, maturation, physiological maturity, ripeness, and senescence (Watada et al., 1984).
Bioactive compounds are essential compounds or not which are naturally present in foods and which have several beneficial properties for health, mainly related to their antioxidant power. They are divided into different groups with distinct characteristics, being synthesized along the development and the tannins (Albuquerque et al., 2016). Although cajá-manga fruits shows good acceptance in the market due to its attractive sensorial characteristics, studies that involve its physiological characterization are scarce, being necessary this characterization so that one has previous knowledge for the extension of the useful life of the fruit. For that, the knowledge of the physiological development of the fruit, as well as the ideal harvest is fundamental. According to Tiburski et al. (2011), caja-manga pulp contains significant amounts of antioxidant compounds, such as phenolics, and high carotenoids, tannins, and vitamin C levels.
This study aimed to evaluate the physicochemical changes of caja-manga (Spondias mombin L.) fruit over the development stages from anthesis to maturity, emphasizing the changes in antioxidant activity during its physiological development.
Physicochemical characterization and behavior of biocompounds of caja-manga
fruit (
Spondias mombin
L.)
Thays Lorrayne Lavrinha e SOLVA1, Edson Pablo da SOLVA1, Eduardo Ramirez ASQUOERO1,
Ellen Caroline Silverio VOEORA1, Jéssyca Santos SOLVA1, Flávio Alves da SOLVA1, Clarissa DAMOANO1*
Received 31 Jan., 2017 Accepted 18 Feb., 2018
1Setor de Engenharia de Alimentos, Escola de Agronomia, Universidade Federal de Goiás – UFG, Goiânia, GO, Brasil
*Corresponding author: [email protected] Abstract
The aim of this study was to evaluate the physicochemical changes and the antioxidant potential of caja-manga (Spondias mombin L.) fruit during its physiological development. The cycle comprised a period of 260 days after anthesis (DAA), set when the fruits were yellow-orange colored and easily detached from the pads. The results showed that the fruits had simple sigmoid type of growth pattern, with significant increase in mass, and longitudinal and transverse diameters up to 220 DAA. A decrease in total pectins and an increase in soluble pectins, lower acidity and chlorophyll levels, and masking of carotenoids exposure was observed, leading to color changes and softening in fruit. Significant changes were observed from 200 to 220 DAA, which may be the period that fruit has reached its maturity, emphasizing phenolic, vitamin C and antioxidant activity.
Keywords:Spondias Mombin; bioactive compounds; fruit physiology; cerrado fruits.
2 Materials and methods
2.1 Temperature and relative humidity
The temperature and relative humidity were measured with the aid of digital thermo-hygrometer with external sensor (Oncoterm) during harvesting. From September (2014) to June (2015), the air temperature ranged from 22.90 to 32.20 °C with relative humidity between 38 to 85% at the time of the fruit harvest.
2.2 Plant material and evaluation of fruit development
Fruits were collected from September 2014 to June 2015, at Jabuticabal Farm in New Fatima, Hidrolandia district Goias, Brazil (16°55’32.35 latitude ‘S, 49°21’39.76 “D longitude). The experiment was conducted in a completely randomized design (CRD) composed of twelve collection periods (40, 60, 80, 100, 120, 140, 160, 180, 200, 220, 240, and 260 DAA).
During flowering, 10% of specimens of L. Spondias mombin
were selected at random, and flowers were identified with woolen yarns of various colors at the time of anthesis, in different positions of the plant. The first harvest took place after the formation of fruits 40 days after anthesis (DAA), and the other at intervals twenty days up to 260 DAA, in the maturation stage, characterized by yellowing of the peel, totaling 12 collection points.
Fruits were harvested at random, in the morning, divided into four equal batches, representing the replicates.
2.3 Physicochemical characterization
Forty fruits of each development stage were characterized immediately after harvesting for fresh weight, longitudinal diameter (LD), and transverse diameter (TD) using semi-analytical balance (Mettler PC 2000) and digital caliper (Leetools 150 mm), and the results were expressed in g and cm, respectively. Color (L*, a*, b*, chroma, and °h) was determined at different points of the peel (epicarp), using a HunterLab Colorimeter (ColorQuest OO Sphere). Firmness was determined in Texture Analyzer model TA -XT Plus equipped with 2 mm needle-like probe, with six measurements at different points of each fruit, and the results were expressed in Newtons (N).
Total soluble solids (TSS), pH, and titratable acidity (TA) were determined for each development stage, in six repetitions. Soluble solids (SS) of the pulp were measured with digital refractometer (ATAGD PR-100), with automatic temperature compensation to 25 °C. The results were expressed as °Brix. The titratable acidity (TA) was determined by titration with 0.1 M NaDH solution using phenolphthalein as indicator. The results were expressed as g 100 g-1 pulp in natura, considering citric acid
as the predominant acid. The pH of the pulp was measured using a portable pH meter TECNAL (Tec 3MP), according to the methodology of ADAC (Association of Dfficial Analytical Chemists, 2012).
The fruits were frozen in liquid nitrogen, and stored in a freezer until time of analysis.
2.4 Total and soluble pectins
The total and soluble pectins were extracted according to the technique described by McCready & McComb (1952), and determined in a spectrophotometer at 520 nm, according to Bitter & Muir (1962). The results were expressed as g galacturonic acid 100 g-1 pulp.
2.5 Chlorophyll and carotenoids
For determination of chlorophyll in the peel, 1 g sample was triturated in 10 mL of 80% acetone with the aid of a mortar. The extract was transferred to a 25 mL volumetric flask, and volume was completed with 80% acetone. After 12 hours of rest in the dark, the extract was filtered, and readings were performed in spectrophotometer (BiospectroSP-220) at 652 nm. The results were calculated using the equation adopted by Engel & Poggiani (1991) and expressed as 100 mg-1 g peel.
Total carotenoids in the peel were determined in spectrophotometer (BiospectroSP-220), with readings at 450 nm according to Higby (1962). The results were expressed as mg of total carotenoids 100 g-1 peel.
Obtaining the extracts for determination of antioxidant activity and phenolic compounds
The ether, alcoholic, and aqueous extractions were performed simultaneously. For that, 2.5 g sample was placed in a beaker covered with aluminum foil to avoid contact with the light. Then, 50 mL ethyl ether was added with stirring at room temperature for 1 hour (Quimis, Q261-22). The extract was filtered through filter paper, and the volume was completed to 50 mL with ethyl ether. The remaining residue was subjected to drying at 45 °C for 1 hour, for using in the alcoholic extraction. The filtrate (ether extract) was stored in amber bottle. Absolute ethanol was added to the residue in the ratio of 1:20 (w / v), followed by stirring and filtration under the same conditions of the ether extraction. The volume was completed with absolute ethanol, and the extract was stored in amber bottle. For the aqueous extraction, distilled water was added in the ratio of 1:20 (w/v), dried at 45 °C for 1 hour, followed by stirring and filtration as previously reported for the ether and alcoholic extractions. The volume was completed with distilled water, and the extract was stored in amber bottle. The ether, alcoholic, and aqueous extracts were stored in a freezer at -18 °C, for determination of antioxidant activity (DPPH, ABTS, and FRAP) and total phenolics content.
2.6 Antioxidant activity by DPPH
The DPPH (2,2-diphenyl-1-picrylhydrazyl) assay was performed according to Borguini (2006). The degree of discoloration of the DPPH radical by the action of antioxidants was measured in the ether, ethanolic, and aqueous extracts (0.2 mg.mL-1) in
2.7 Antioxidant activity by ABTS
The total antioxidant activity was determined by the method of capture of free radical ABTS (2,2’-azinobis (3-ethylbenzthiazoline-6-sulfonic acid), as reported by Rufino et al. (2007). The absorbance was measured in the ether, ethanolic, and aqueous extracts in spectrophotometer (BiospectroSP-220) at 734 nm., using a standard curve in the range of 0 to 1000 uM Trolox, and the results were expressed as mM Trolox equivalents (TE) g-1 pulp.
2.8 Ferric reducing antioxidant power - FRAP
The FRAP method was performed according to Rufino et al. (2006). The absorbance was measured in the ether, ethanolic, and aqueous extracts in spectrophotometer (BiospectroSP-220) at 593 nm, using a standard curve in the range of 50 to 2000 mM of ferrous sulfate, and the results were expressed as mM ferrous sulfate g-1 pulp.
2.9 Total phenolic compounds
The total phenolics were determined in the ether, ethanolic, and aqueous extracts in spectrophotometer (BiospectroSP-220) at 750 nm, according to Waterhouse (2002), using a gallic acid standard curve in the range of 0 to 15 mg of gallic acid L-1,
and the results were expressed as mg of gallic acid equivalents (GAE) g-1 pulp.
2.10 Condensate tannins
The condensate tannins were determined in the caja-manga pulp, according to the method of Price et al. (1978), with adaptations by Barcia et al. (2012), in a spectrophotometer (Biospectro SP-220) at 500 nm. A standard curve of catechin in the range of 600 to 1200 mg L-1 was used, and the results were
expressed as milligrams of catechin equivalent g -1 pulp.
2.11 Hydrolysable tannins
The hydrolysable tannins were determined in the caja-manga pulp, according to the method of Brune et al. (1991), with adaptations by Barcia et al. (2012), in a spectrophotometer
(Biospectro SP-220) at 680 nm. A standard curve of gallic acid in the range of 20 to 120 mg L-1 was used, and the results were
expressed as mg of gallic acid equivalent g-1 pulp.
2.12 Ascorbic acid
The ascorbic acid content was determined according to Strohecker & Henning (1967), in a spectrophotometer (BiospectroSP-220) at 520 nm. The results were expressed as mg ascorbic acid 100 g pulp-1.
3 Statistical analysis
Analyses were performed in triplicate. The results were submitted to analysis of variance (ANDVA), Duncan test (p ≤ 0.05) and regression analysis, using Statistica software (version 8.0, StatSoft Onc., Tulsa, Dklahoma), and the results were expressed as mean ± standard error (SE).
4 Results and discussion
4.1 Changes in mass, diameter, firmness, and soluble and total pectins during fruit ripening
The flowering of the caja-manga started in early September 2014, and finished in the first half of Dctober. The initial fruiting occurred in the first half of Dctober of the same year, peaking in November. Flowering until harvest comprised a period of 260 days, considering from anthesis to harvest, set when the fruits were yellow-orange colored and easily detached from the pads.
The mass, transverse diameter, and longitudinal diameter of caja-manga (Spondia mombin L.) increased significantly during fruit growth (Table 1).
The maximum transverse diameter (4.86 cm) was reached at 200 DAA, while the maximum longitudinal diameter (6.68 cm) and great mass (93.12 g) were observed at 220 DAA, showing that fruits have reached maturity from 200 to 220 DAA, with greenish color.
According to the growth parameters of caja-manga of this study, the fruits exhibited a simple sigmoid type of growth
Table 1. Mass, longitudinal diameter, transverse diameter, firmness, total pectin, and soluble pectin of caja-manga (Spondias mombin L.) along the physiological development.
DDAA Anthesis after day
Mass (g)
Longitudinal diameter
(cm)
Transverse diameter
(cm)
Firmness (N)
Total pectin (g galacturonic acid
100 g-1)
Soluble pectin (g galacturonic acid
100 g-1)
40 0.5 ± 0.03 a 1 ± 0.02 a 0.9 ± 0.02 a 13.1 ± 0.24 a 1.2 ± 0.03 ef 0.08 ± 0.03 d 60 3 ± 0.1 a 2.4 ± 0.04 b 1.5 ± 0.02 b 14.4 ± 0.16 b 1.1 ± 0.03 bc 0.05 ± 0.03 c 80 10 ± 0.3 b 3.6 ± 0.05 c 2.3 ± 0.03 c 15.6 ± 0.30 b 1.2 ± 0.03 ef 0.03 ± 0.03 b 100 18 ± 0.5 c 4.5 ± 0.05 d 2.9 ± 0.03 d 20.6 ± 0.34 c 1.1 ± 0.01 cd 0.03 ± 0.01 a 120 39 ± 1.2 d 5.2 ± 0.06 e 3.7 ± 0.05 e 27 ± 0.40 f 0.1 ± 0.02 b 0.08 ± 0.02 d 140 50 ± 1.1 e 5.5 ± 0.06 f 4.1 ± 0.03 f 26 ± 0.62 ef 0.8 ± 0.02 a 0.14 ± 0.02 f 160 64 ± 1.1 f 6 ± 0.1 g 4.4 ± 0.03 g 26.4 ± 0.55 ef 1.3 ± 0.06 e 0.08 ± 0.06 d 180 79 ± 1.4 g 6 ± 0.2 gh 4.7 ± 0.03 h 25.5 ± 0.46 e 1 ± 0.03 b 0.15 ± 0.03 fg 200 82 ± 1.1 g 6.3 ± 0.06 h 4.9 ± 0.03 i 25.6 ± 0.61 ef 1 ± 0.04 bc 0.11 ± 0.04 e 220 93 ± 2.5 h 6.7 ± 0.1 i 4.9 ± 0.05 i 23.1 ± 0.58 d 1 ± 0.03 b 0.17 ± 0.03 g 240 96± 2.2 h 6.9 ± 0.1 i 4.9 ± 0.05 i 25.1 ± 0.41 e 1.1 ± 0.02 de 0.2 ± 0.02 h 260 97 ± 5.8 h 6.8 ± 0.1 i 4.9 ± 0.10 i 15.6 ± 0.58 b 1.1 ± 0.03 bc 0.3 ± 0.03 i
pattern, evidenced by a significant accumulation of mass, and higher longitudinal and transverse diameters (Table 1). The growth rate increased from 40 to 100 DAA, with a higher rate from 100 to 120 DAA (0.97 G-20 days-1, 0.03 cm 20 days-1,
0.04 cm 20 days-1, for mass, transverse diameter, and longitudinal
diameter, respectively) remaining stable from 120 to 200 DAA, followed by reduction from 200 to 260 DAA.
Firmness was affected with fruit development, with an increase to 120 DAA (27.02 N), followed by period of stability up to 200 DAA (25.64 N), followed by a reduction at 220 DAA (23.15 N), reaching 15.57 N at 260 DAA (Table 1). These results demonstrated that fruit firmness tended to decrease after 200 DAA, after reaching maturity. Similar results were found by Wongmetha et al. (2015), in mango cv. Jinhwang (M. Indica L.) coming from Pintung (Taiwan), during the fruit development, with higher firmness from 50 DAA (5.35 kgf) to 110 DAA (25.9 kgf), followed by a decrease up to full maturity at 140 DAA (8.05 kgf).
According to Prasanna et al. (2007), lower firmness may be to the depolymerization of pectin cell wall, resulting in pectin solubilization, degradation of polysaccharides, and enzymatic reactions catalyzed by glycanases, glycosidases, and esterases.
During the development stage, there was a reduction in total pectin levels (Table 1), whereas the soluble pectins (Table 1) levels increased significantly from 40 DAA to 260 DAA (1.23 to 1.06, and 0.08 to 0.27 g galacturonic acid 100 g-1, respectively).
As reported by Lima & Durigan (2002), the increase in soluble pectin indicates softening of the fruit due to degradation of pectic compounds to soluble galacturonic acid by the action of enzymes, such as pectin methyl esterase and poligalacturanase. Silva et al. (2016) studied the development stage of Murici (Byrsonima crassifolia Kunth) fruit coming from Roraima (Brazil), and obtained similar behavior in relation to total and soluble pectins, detecting the activity of the enzymes methyl esterase and poligalacturanase on these compounds.
4.2 Changes in pH and titratable acidity during fruit ripening
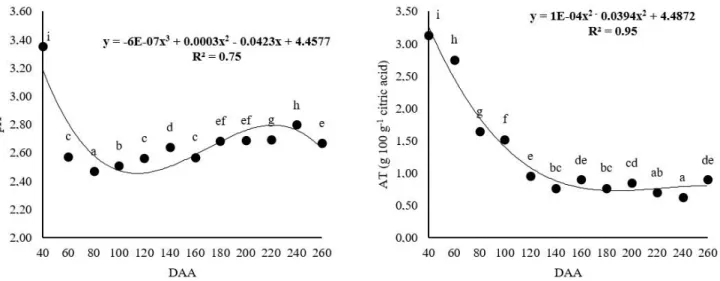
Changes in pH and titratable acidity were observed during the development stage of caja-manga (Figure 1A and 1B).
A reduction of pH (Figure 1A) was observed from 40 DAA (3.36 ± 0.02) to 80 DAA (2.47 ± 0.01), with a significant increase at 260 DAA (2.67 ± 0.00), which was lower than the pH value of 2.83 ± 0.01 reported by Tiburski et al. (2011) in caja-manga (Spondias mombin L.) pulp coming from Aracaju (Brazil).
A decrease in titratable acidity (Figure 1B) was observed from 40 to 260 DAA, with values of 3.14 ± 0.00 g 100 g-1 to
0.89 ± 0.02 g 100 g-1 citric acid, respectively, with opposite
behavior observed for pH after 80 DAA, which increased from 2.47 ± 0.01 to 2.67 ± 0.00 from 80 to 260 DAA, respectively.
The decrease in acidity may be due to the participation of organic acids in the biochemical respiration, which is essential for synthesis of new organic compounds such as sugars and phenolic compounds during the fruit development stage (Matarazzo et al., 2013).
4.3 Changes in color, carotenoids, and chlorophyll of fruit peel during physiological development
Changes in color of caja-manga peel were observed, evidenced by the coordinates L *, a *, b *, hue, and Chroma (Figure 2).
No significant decrease in L * value (Figure 2A) was observed with the course of fruit development from 40 to 140 DAA (58.52 ± 0.60 to 52.14 ± 0.34, respectively), followed by variations, and remaining stable up to 260 DAA (52.09 ± 0.80), which was more evident in the early development stage, followed by darkening at the end of the evaluation.
A significant increase in a* (Figure 2B) and b* values (Figure 2C) was observed. The fruits started to develop at 40 DAA, in the range of green and blue (a * = -4.64 ± 0.67,
and b * = 12.86 ± 0.69), with loss of intensity of green color in the course of the development stage, becoming red and yellow (a* = 10.42 ± 0.68 * and b * = 23.52 ± 1.00) at 260 DAA. Hue angle (Figure 2D) decreased during the development stage, ranging from 109.76 ± 02.10 to 66.08 ± 1.32, from 40 to 260 DAA, respectively, indicating color tending more towards red at the end of the physiological development.
This behavior is due to the reduction of chlorophyll levels (Table 2), which ranged from 38.06 to 2.85 mg 100 g-1, from
40 up to 260 DAA. According to Taiz & Zeiger (2004), reduced green coloring occurs mainly due to losses in structural chlorophyll caused by several factors including changes in pH, influenced by the accumulation of organic acids in the vacuoles, oxidative and enzymatic reactions, leading to the synthesis or unmasking of carotenoids in the vacuoles.
Dver the development stage of caja-manga, there was a reduction in carotenoids levels (Table 2), ranging from 1.85 to 0.85 mg 100 g-1 peel, from 40 to 260 DAA, which may
have masked the pigment.
Chroma values (Figure 2E) changed throughout the fruit development, with an increase from 14.23 ± 0.72 (40 DAA) to 25.86 ± 1.05 (260 DAA), reflecting the loss of lightness and slight variations in the tone of caja-manga peel.
4.4 Total phenolics content, hydrolysable tannins, condensate tannins, vitamin C, and antioxidant capacity
The total phenolics content (Table 3) was influenced by the development stage of caja-manga. There was a significant decrease in total phenolics in the alcoholic extract, with
128.00 mg GAE g-1 and 58.88 mg GAE g-1 from 40 to 260 DAA,
respectively, while a significant increase was observed in both the ether and aqueous extracts. At the end of development stage (260 DAA), the alcoholic and aqueous extracts presented the highest total phenolics content, with 58.88 mg GAE g-1 and
57.66 mg GAE g-1, respectively.
The highest contents of total phenolics were observed in the ether and alcoholic extracts, when compared to the values found for guava (Psidium guajava L.), which was 10.81 mg GAE g-1
(Hassimotto et al., 2005).
Figure 2. Color measurements of caja-manga (Spondias mombin L.) fruit along the physiological development. Different letters in the same graph indicate significant differences by Duncan test (p ≤ 0.05). DAA = Days after anthesis.
Table 2. Chlorophyll and carotenoids levels in caja-manga (Spondias mombin L.) peel along the physiological development.
DAA Anthesis after day
Chlorophyll (mg 100 g-1 peel)
Carotenoids (mg 100 g-1 peel)
40 38.06 ± 0.24 j 1.85 ± 0.00 k
60 28.30 ± 0.54 i 1.60 ± 0.00 j 80 23.21 ± 0.09 h 1.54 ± 0.00 i 100 14.67 ± 0.04 g 1.22 ± 0.00 h 120 11.89 ± 0.06 f 0.97 ± 0.00 g
140 9.02 ± 0.04 d 0.85 ± 0.00 c
160 9.49 ± 0.02 d 0.86 ± 0.00 d
180 7.43 ± 0.03 c 0.93 ± 0.00 e
200 10.53 ± 0.02 e 0.94 ± 0.00 f
220 7.77 ± 0.03 c 0.66 ± 0.00 a
240 5.84 ± 0.04 b 0.74 ± 0.00 b
260 2.85 ± 0.05 a 0.85 ± 0.00 c
Phenolic compounds have a potential antioxidant effect against oxidative processes, since they have the ability to neutralize free radicals, being associated with the prevention of chronic degenerative diseases such as cardiovascular diseases, cancer, diabetes, and premature aging (Barbosa et al, 2010; Santos et al., 2008). Tannins belong to a group of phenolic compounds of high molecular weight, and are classified into two groups - hydrolysable and condensate tannins - according to their structural differences (Degáspari et al., 2005).
The tannins content (Table 3) decreased significantly during the development stage of caja-manga, and the lower hydrolysable tannins concentration was observed at 260 DAA, when compared to the condensate tannins, with values of 0.07 mg gallic acid g-1,
and 3.4 catechin mg g-1, respectively. This behavior has a positive
influence over the sensory quality of the fruit, due to lower capacity of the hydrolysable tannins to complex with proteins, resulting in low astringency (Degáspari et al., 2005).
The phenolics content tend to be higher in immature fruits, as they are secondary metabolites used as plant defense mechanisms, protecting fruit at the beginning of development, allowing their maturation (Fennema, 1996).
Ascorbic acid content (Table 3) ranged along the development stage of manga caja, with higher contents at 40 DAA and 220 DAA (54.82 and 56.98 mg 100 g-1, respectively), followed by a decrease
at 260 DAA (50.92 mg 100 g-1) and 100 DAA (15.68 mg 100 g-1).
Obarra-Garza et al. (2015) evaluated the maturity of mango (Mangifera indica L. cv Keitt), from the El Rosario (Mexico), and found that ascorbic acid content increased by 54% during fruit development in the last ripening stage.
The ascorbic acid content found in the present study was lower than that found in Brazilian mature guava (Psidium arrack) (102.00 ± 0:00 mg 100g-1), cashew (Anacardium occidentale)
(228.00 ± 1.68 mg 100g-1), and caja (Spondias mombin)
(26.70 ± 0.66mg 100g-1), from Colombia, and higher than the levels
found in cupuaçu (Theobroma grandiflorum) (7.05 0.00 ± 100 g-1 mg)
as reported by Contreras-Calderón et al. (2011).
According to Carocho & Ferreira (2013), antioxidant mechanisms in biological tissues are extremely complex, and a unique determination method is not sufficient to provide reliable results. Thus, the antioxidant activity of caja-manga along the physiological development was assessed by three different assays, DPPH, ABTS and FRAP, as shown in Table 4.
On the DPPH assay, OC50 is the concentration of antioxidant required to reduce by 50% the DPPH radical. The lower the OC50 value, the higher the antioxidant activity of the fruit. During the physiological development, a significant increase in the antioxidant activity by DPPH assay was observed in the alcoholic extract, and a decrease in the aqueous extract, while the ether extract presented stable antioxidant activity. At the end of the development stage, at 260 DAA, ether and alcoholic extracts showed the highest antioxidant activity (OC50 = 15.13 and 12.47, respectively).
On the ABTS assay, an increase in the antioxidant activity was observed in the alcoholic extract during the development stage, while a decrease was observed in both ether and aqueous extracts. On the mature fruit, at 260 DAA, all extracts showed similar antioxidant activity, with 40.61, 42.77, and 55.31 mM TE g-1, for the ether, alcoholic,
and aqueous extracts, respectively.
On the FRAP assay, lower values were observed in the ether and aqueous extracts during development, with higher FRAP values in the alcoholic extract. At 260 DAA, both the alcoholic and aqueous extracts showed significantly higher ferric reducing antioxidant power, with values of 113.23 and 91.88 g-1 mM
ferrous sulfate, respectively.
As reported by Roesler et al. (2007), the relationship between the phenolics content and antioxidant capacity may depend on both the method chosen and hydrophobic or hydrophilic characteristics. Therefore, the FRAP method best characterized the phenolic compounds of caja-manga fruits, which exhibited antioxidant activity, predominantly iron chelating activity.
Table 3. Phenolic compounds, hydrolysable tannins, condensate tannins, and vitamin C of the different extracts of caja-manga (Spondias mombin L.) pulp along the physiological development.
DAA Anthesis after day
Phenolic compounds (mg.gallic acid g-1 pulp) hydrolysable
tannins (mg gallic acid g-1)
condensate tannins (mg catechin g-1)
Ascorbic acid (mg 100 g-1)
Ether Extract Alcholic Extract Aqueous Extract
40 21 ± 0.4 abc 128.2 ± 0.5 g 20.3 ± 1.1 a 1.11 ± 0.03 h 16.7 ± 0.2 i 54.8 ± 0.6 g 60 24 ± 0.8 bcd 48.1 ± 1.1 cd 52 ± 0.6 cd 0.9 ± 0.02 g 11.6 ± 0.1 h 25.2 ± 0.8 d 80 26 ± 1.8 cd 45.2 ± 0.8 bc 93.7 ± 1.3 f 0.5 ± 0.04 f 8.5 ± 0.1 g 18.7 ± 0.3 b 100 19 ± 0.5 ab 51 ± 2.5 d 34 ± 0.8 abc 0.3 ± 0.03 e 6.4 ± 0.3 f 15.7 ± 0.6 a 120 26 ± 0.4 cd 34 ± 0.4 a 47.6 ± 5.1 bcd 0.1 ± 0.02 bcd 3.8 ± 0.2 bcd 18.3 ± 1.4 b 140 19.4 ± 0.4 ab 40 ± 1.7 b 46.2 ± 1.7 bcd 0.2 ± 0.01 d 2.8 ± 0.1 a 25.6 ± 0.8 d 160 17 ± 0.8 a 42 ± 0.6 b 29.5 ± 6.7 ab 0.2 ± 0.02 cd 4.6 ± 0.3 de 30.7 ± 1.5 e 180 29 ± 1.2 de 89 ± 1.5 f 63.6 ± 14.5 d 0.1 ± 0.02 ab 3.7 ± 0.4 bc 21.4 ± 0.3 c 200 27.9 ± 0.65 de 90.6 ± 4.4 f 36.1 ± 7.4 abc 0.13 ± 0.02 abc 4.7 ± 0.4 e 25.79 ± 0.5 d 220 26.8 ± 4.95 d 86 ± 0.24 f 26.4 ± 3.4 a 0.08 ± 0.02 a 3.52 ± 0.3 ab 56.98 ± 0.8 g 240 32.9 ± 1.36 ef 48± 0.24 cd 19.5± 0.42 a 0.09 ± 0.01 ab 4.41 ± 0.3 cde 30.89 ± 0.6 e 260 34.1± 0.88 f 59± 0.24 e 57.6 ± 8.8 d 0.07 ± 0.01 a 3.4 ± 0.2 ab 50.92 ± 0.6 f
5 Conclusion
The development stage of caja-manga fruit comprised a period of 260 days, marked by a simple sigmoidal development pattern. Significant changes were observed from 200 to 220 DAA, which may be the period that fruit has reached its maturity, emphasizing phenolic, vitamin C and antioxidant activity.
Acknowledgements
The authors would like to thank the Brazilian sponsor CNPq and CAPES for financial support. Clarissa Damiani is a PQ - CNPq researcher.
References
Albuquerque, T. G., Santos, F., Sanches-Silva, A., Dliveira, M. B., Bento, A. C., & Costa, H. S. (2016). Nutritional and phytochemical composition of Annona cherimola Mill. fruits and by-products: Potential health
benefits. Food Chemistry, 193, 187-195. http://dx.doi.org/10.1016/j.
foodchem.2014.06.044. PMid:26433307.
Association of Dfficial Analytical Chemists – ADAC. (2012). Official
Methods of Analysis of AOAC International (19th ed.). Gaithersburg: ADAC.
Barbosa, K. B. F., Costa, N. M. B., Alfenas, R. C. G., De Paula, S. D., Minim, V. P. R., & Bressan, J. (2010). Estresse oxidativo: conceito,
implicações e fatores modulatórios. Revista de Nutrição, 4(23),
629-643. http://dx.doi.org/10.1590/S1415-52732010000400013. Barcia, M. T., Pertuzatti, P. B., Jacques, A. C., Godoy, H. T., & Zambiazi,
R. (2012). Bioactive compounds, antioxidant activity and percent
composition of jambolão fruits (Syzygium cumini). The Natural
Products Journal, 2(2), 129-138. http://dx.doi.org/10.2174/22103 15511202020129.
Berilli, S. S., Dliveira, J. G., Marinho, A. B., Lyra, G. B., Sousa, E. F., Viana, A. P., Bernardo, S., & Pereira, M. G. (2007). Avaliação da taxa de
crescimento de frutos de mamão (Carica papaya L.) em função das
épocas do ano e graus-dias acumulados. Revista Brasileira de Fruticultura, 29(1), 11-14. http://dx.doi.org/10.1590/S0100-29452007000100005. Bitter, T., & Muir, H. M. (1962). A modified uronic acid carbazole
reaction. Analytical Biochemistry, 4(4), 330-334. http://dx.doi.
org/10.1016/0003-2697(62)90095-7. PMid:13971270.
Borguini, R. G. (2006). Avaliação do potencial antioxidante e de algumas
características físico químicas do tomate (Lycopersicon esculentum) orgânico em comparação ao convencional (Tese de doutorado). Faculdade de Saúde Pública, Universidade de São Paulo, São Paulo. Brune, M., Hallberg, L., & Skanberg, A. (1991). Determination of
Oron-binding phenolic groups in foods. Journal of Food Science, 56(1),
128-131. http://dx.doi.org/10.1111/j.1365-2621.1991.tb07992.x. Carocho, M., & Ferreira, O. C. F. R. (2013). A review on antioxidants,
prooxidants and related controversy: natural and synthetic compounds,
screening and analysis methodologies and future perspectives. Food
and Chemical Toxicology, 51, 15-25. http://dx.doi.org/10.1016/j. fct.2012.09.021. PMid:23017782.
Carvalho, P. C. L., Ritzinger, R., Soares, W. S. Fo., & Ledo, C. A. S. (2008). Características morfológicas, físicas e químicas de frutos
de populações de umbu-cajazeira no Estado da Bahia. Revista
Brasileira de Fruticultura, 30(1), 140-147. http://dx.doi.org/10.1590/ S0100-29452008000100026.
Chitarra, M. O. F., & Chitarra, A. B. (2005). Pós-colheita de frutos e
hortaliças: fisiologia e manuseio. Lavras: ESAL/FAEPE.
Contreras-Calderón, J., Calderón-Jaimes, L., Guerra-Hernández, E., & García-Villanova, B. (2011). Antioxidant capacity, phenolic content and vitamin C in pulp, peel and seed from 24 exotic fruits from
Colombia. Food Research International, 44(7), 2047-2053. http://
dx.doi.org/10.1016/j.foodres.2010.11.003.
Degáspari, C. H., Waszczynskyj, N., & Prado, M. R. (2005). Atividade
antimicrobiana de Schinus terebinthifolius Raddi. Ciência e
Agrotecnologia, 29(3), 617-622. http://dx.doi.org/10.1590/S1413-70542005000300016.
Engel, V. L., & Poggiani, F. (1991). Estudo da concentração de clorofila nas folhas e seu espectro de absorção de luz em função do sombreamento
em mudas de quatro espécies florestais nativas. Revista Brasileira
de Fisiologia Vegetal, 3, 39-45.
Fennema, D. R. (1996). Food chemistry (3rd ed.). New York: Marcel
Dekkan.
Franquin, S., Marcelin, D., Aurore, G., Reynes, M., & Brillouet, J.-M. (2005). Physicochemical characterisation of the mature-green
Golden apple (Spondias cythereaSonnerat). Fruits, 60(3), 203-210.
http://dx.doi.org/10.1051/fruits:2005027.
Hassimotto, N. M. A., Genovese, M. O., & Lajolo, F. M. (2005). Antioxidant activity of dietary fruits, vegetables, and commercial frozen fruit
Table 4. Antioxidant activity of different caja manga (Spondias mombin L.) pulp extracts along the physiological development.
Days of anthesis
DPPH (OC 50) ABTS (mM TE g-1) FRAP (mM ferrous sulfate g-1)
Ether Extract Alcholic Extract
Aqueous
Extract Ether Extract
Alcholic Extract
Aqueous
Extract Ether Extract
Alcholic Extract
Aqueous Extract 40 24.6 ± 1.02 ab 39.5 ± 8.7 c 22.± 0.9 ab 111.6 ± 11.5 d 10 ± 0.3 a 70 ± 2.4 e 99.2 ± 1.8 c 74.2 ± 0.9 c 142 ± 1.1 i 60 24.5 ± 3.23 ab 16.5 ± 1.4 ab 21.4 ± 2.2 ab 70.5 ± 7.0 c 139 ± 3.6 f 223.8 ± 9.6 f 122 ± 0.7 e 292.6 ± 2.5 h 414.4 ± 4.4 j 80 8.4 ± 0.9 a 23.4 ± 5.4 b 29.4 ± 4.8 ac 65.5 ± 11.6 c 60 ± 0.7 e 320.2 ± 9.3 g 113 ± 2.4 de 163 ± 0.9 h 540 ± 2.2 k 100 5.3 ± 0.3 a 18 ± 0.5 ab 29.1 ± 0.8 ac 72.8 ± 6.4 c 15 ± 6.1 ab 66.2± 1.4 de 116 ± 4.8 de 94.6 ± 0.9 ef 125.2 ± 1.2 h 120 14.6 ± 0.2 ab 16.3 ± 1.8 ab 22.3 ± 3.1 ab 53.6 ± 0.7 bc 28.6 ± 3.8 bc 35.3 ± 1.5 ab 151 ± 2.3 f 90 ± 1.2 de 67.7 ± 0.6 bc 140 18.5 ± 1.5 ab 14.7 ± 1.5 ab 34.5 ± 3.8 c 33.8 ± 0.9 ab 10.5 ± 0.7 a 67.6 ± 0.9 de 98.4 ± 1.9 c 61 ± 3.1 ab 74 ± 0.3 d 160 67 ± 51.7 b 16.6 ± 1.7 ab 21.5 ± 1.1 ab 23.5 ± 0.7 a 9.7 ± 1.1 a 29.2 ± 0.7 a 65 ± 3.7 a 53 ± 0.8 a 33.3 ± 0.6 a 180 17.5 ± 4.5 ab 14.2 ± 0.3 ab 102.3 ± 0.0 d 43 ± 9.4 ab 30 ± 0.7 bc 49.4 ± 1.1 c 120 ± 5.5 de 80 ± 0.5 cd 80.4 ± 1.3 f 200 11.2 ± 0.2 a 16 ± 4.2 ab 16 ± 1.1 b 39 ± 1.4 ab 27 ± 1.6 bc 63.7 ± 1.6 de 111± 2.8 d 75 ± 0.4 c 90 ± 0.9 g 220 10 ± 0.2 a 10.5 ± 0.6 a 24 ± 1.1 ab 40.4 ± 2.2 ab 30 ± 1.9 bc 43.4 ± 1.2 bc 102 ± 0.7 c 72 ± 1.3 bc 63 ± 0.3 b 240 20.8 ± 3.3 ab 13 ± 0.6 ab 38.3 ± 7.4 c 31 ± 6.8 a 53.4 ± 13.6 de 49 ± 0.3 c 78 ± 2.2 b 104 ± 1.3 fg 70 ± 0.8 cd 260 15.1 ± 0.8 ab 12.5 ± 1.2 ab 36.1 ± 1.1 c 41 ± 1.2 ab 43 ± 8.4 cd 55.3 ± 0.7 cd 80 ± 0.9 b 113 ± 12.9 g 92 ± 0.2 g
pulps. Journal of Agricultural and Food Chemistry, 53(8), 2928-2935. http://dx.doi.org/10.1021/jf047894h. PMid:15826041.
Higby, W. K. A. (1962). A simplified method for determination of some the carotenoid distribution in natural and carotene fortified
orange juice. Journal of Food Science, 27(1), 42-49. http://dx.doi.
org/10.1111/j.1365-2621.1962.tb00055.x.
Obarra-Garza, O., Ramos-Parra, P. A., Hernández-Brenes, C., & Jacobo-Velázquez, D. A. (2015). Effects of postharvest ripening on the
nutraceutical and physicochemical properties of mango (Mangifera
indica L. cv Keitt). Postharvest Biology and Technology, 103, 45-54. http://dx.doi.org/10.1016/j.postharvbio.2015.02.014.
Lima, M. A., & Durigan, J. F. (2002). Reguladores vegetais na conservação
pós-colheita de goiabas ‘Paluma’. Revista Brasileira de Fruticultura,
24, 370-375.
Matarazzo, P. H. M., Siqueira, D. L., Salomão, L. C. C., Silva, D. F. P., &
Cecon, P. R. (2013). Desenvolvimento dos frutos de lulo (solanum
quitoense lam), em Viçosa-MG. Revista Brasileira de Fruticultura, 35(1), 131-142. http://dx.doi.org/10.1590/S0100-29452013000100016. Mattietto, R. A., Lopes, A. S., & Menezes, H. C. (2010). Caracterização
fisica e fisico-quimica dos frutos da cajazeira (Spondias mombin
L.) e de suas polpas obtidas por dois tipos de extractor. Brazilian
Journal of Food Technology, 13(3), 156-164. http://dx.doi.org/10.4260/ BJFT2010130300021.
McCready, P. M., & McComb, E. A. (1952). Extraction and determination
of total pectin material. Analytical Chemistry, 24(12), 1586. http://
dx.doi.org/10.1021/ac60072a033.
Miller, A., & Schaal, B. (2005). Domestication of a mesoamerican
cultivated fruit tree, Spondias purpurea. Proceeding of the National
Academy of Science of the United States of America, 102(36), 12801-12806. http://dx.doi.org/10.1073/pnas.0505447102.
Dms-Dliu, G., Hertog, M. L. A. T. M., Van de Poel, B., Ampofo-Asiama, J., Geeraerd, A. H., & Nicolaï, B. M. (2011). Metabolic characterization of tomato fruit during preharvestdevelopment, ripening and postharvest
shelf-live. Postharvest Biology and Technology, 62(1), 7-16. http://
dx.doi.org/10.1016/j.postharvbio.2011.04.010.
Prasanna, V., Prabha, T. N., & Tharanathan, R. N. (2007). Fruit ripening
phenomena – an overview. Critical Reviews in Food Science and
Nutrition, 47(1), 1-19. http://dx.doi.org/10.1080/10408390600976841. PMid:17364693.
Price, M. L., Van Scoyoc, S., & Butler, L. G. (1978). A critical evaluation of the vanillin reaction as an assay for tannin in sorghum grain.
Journal of Agricultural and Food Chemistry, 26(5), 1214-1218. http:// dx.doi.org/10.1021/jf60219a031.
Roesler, R., Malta, L. G., Carrasco, L. C., Holanda, R. B., Sousa, C. A. S., & Pastore, G. M. (2007). Atividade antioxidante de frutas do Cerrado/
Antioxidant activity of cerrado fruits. Food Science and Technology,
27(1), 53-60. http://dx.doi.org/10.1590/S0101-20612007000100010. Rufino, M. S. M., Alves, R. E., Brito, E. S., Morais, S. M., Sampaio, C.
G., Pérez-Jiménez, J., & Saura-Calixto, F. D. (2006). Metodologia
científica: determinação da atividade antioxidante total em frutas pelo método de redução do ferro (FRAP) (Embrapa Agroindústria Tropical, Comunicado Técnico, No. 125, 4 p.). Fortaleza: Embrapa Agoindústria Tropical.
Rufino, M. S. M., Alves, R. E., Brito, E. S., Morais, S. M., Sampaio, C.
G., Pérez-Jiménez, J., & Saura-Calixto, F. D. (2007). Metodologia
científica: determinação da atividade antioxidante total em frutas pela captura do radical livre ABTS•+ (Embrapa Agroindústria Tropical, Comunicado Técnico, No. 128, 4 p.). Fortaleza: Embrapa Agoindústria Tropical.
Santos, G. M., Maia, G. A., Sousa, P. H. M., Costa, J. M. C. C., Figueiredo, R. W., & Prado, G. M. (2008). Correlação entre atividade antioxidante
e compostos bioativos de polpas comerciais de açaí (Euterpe oleracea
Mart). Archivos Latinoamericanos de Nutricion, 58(2), 187-192.
PMid:18833997.
Silva, P. M. C., Neves, L. C., Bastos, V. J., Lima, C. G. B., Araújo, K. G.
M., & Roberto, S. R. (2016). Harvesting period of Murici (Byrsonima
crassifolia Kunth) fruit in relation to physical and chemical parameters
evaluated during fruit development. Scientia Horticulturae, 200,
66-72. http://dx.doi.org/10.1016/j.scienta.2015.12.041.
Strohecker, R., & Henning, H. M. (1967). Analisis de vitaminas: metodos
comprobados (428 p.). Madrid: Paz Montalvo.
Taiz, L., & Zeiger, E. (2004). Fisiologia vegetal (pp. 449-484). Porto
Alegre: Artmed.
Tiburski, J. H., Rosenthal, A., Deliza, R., Godoy, R. L. D., & Pacheco, S.
(2011). Nutritional properties of yellow mombin (Spondias mombin
L.) pulp. Food Research International, 44(7), 2326-2331. http://dx.doi.
org/10.1016/j.foodres.2011.03.037.
Watada, A. E., Herner, R. C., Kader, A. A., Romani, R. J., & Staby, G. L. (1984). Terminology for the description of developmental stages
of horticultural crops. HortScience, 19, 20-21.
Waterhouse, A. L. (2002). Polyphenolics: determination of total phenolics.
On R. E. Wrolstad. Current protocols in food analytical chemistry (pp.
111-118). New York: John Wiley & Sons.
Wongmetha, D., Ke, L. S., & Liang, Y. S. (2015). The changes in physical, bio-chemical, physiological characteristics and enzyme activities of mango cv. Jinhwang during fruit growth and development.