DIGITAL MARKETING PERFORMANCE
MEASUREMENT: HOW GOOD MARKETING
PERFORMANCE MEASUREMENT PRACTICES CAN
INCREASE FIRM’S PERFORMANCE
THE CASE OF FORALL PHONES
Rodrigo Vieira Castilho
Project submitted as partial requirement for the conferral of Master in Marketing
Supervisor:
Prof. Hélia Maria Gonçalves Pereira, Prof. Auxiliar, ISCTE Business School, Departamento de Marketing, Operações e Gestão Geral
Co-Supervisor:
Prof. Nuno Alexandre Guerreiro Pedro, Prof. Convidado, ISCTE Business School, Departamento de Marketing, Operações e Gestão Geral
“What cannot be measured cannot be managed” – Peter Drucker “Measure what is measurable, and make measurable what is not so” – Galileu Galilei
ACKNOWLEDGMENTS
The realization of this project has become a constant and demanding challenge, as all the points were being developed. All this work would not be possible alone. From the support and help from the supervisors, the information and receptiveness of Forall Phones, as well as the emotional support from those we love most: family, girlfriend, and friends, who have made this process much easier to overcome. Having said this, I would like to thank all who, directly or indirectly, contributed positively to this thesis.
To prof. Hélia Pereira and to prof. Nuno Pedro, I would like to thank them for all the tips and help shown from the beginning to the end of this project. Their help was essential not only for the development of the thesis and its contents, but also for the encouragement and suggestions for continuous improvement.
To my family, especially to my parents and my brother, to my girlfriend and to my friends, I want to thank them for the unconditional support they gave me during all these months. Writing this thesis was a difficult long process, with good and bad moments, and the motivational words, as well as the encouragement to overcome this process, are due, above all, to them.
To Miguel Santos, my instructor in the Analytics Expert course, from Goobec Portugal, for all the given support and sharing of know-how and, especially, for being so helpful in every subject of interest, always in the attempt to raise the content of my thesis to a higher level.
Lastly, I would like to express my deepest appreciations to Forall Phones, mainly to my friend Bernardo Carreiro, Financial Controller and to José Alves, Head of Performance, for all the work and time invested in this project. I want to thank them all for the internal information provided, as well as all efforts in the attempt to increase the credibility of my thesis, making it richer and insightful. To them, I am grateful for all the knowledge sharing, much valuable for the topic development.
ABSTRACT
The main purpose of this case study is to analyse the impact of good marketing performance practices on firm’s results, by using financial metrics.
With digital improvement, it has become easier to measure marketing efforts. Hence, this project is focused on Forall Phones’ digital marketing performance measurement process, on how performance indicators are chosen, communicated and used to lead to strategic decisions, and if this department is creating value for the company.
The measurement process used is one of the firm’s competitive advantages, with a constant monitoring of the trade-off between costs and benefits, in order to provide a clear vision of what is most profitable for the department. There is a clear focus on what is highly quantifiable and measurable and the establishment of objectives and target audiences, and their constant monitoring, allowing a more effective way of channelling efforts in this direction.
Despite the high investment in marketing and, since the professionalization of the department, the considerable increase of the results at the level of sales and revenue, there is not enough data to clearly highlight it from the rest. One possible justification is that the department does not make a forecast of ROI with its respective monitoring, which would allow knowing all the profitability of the marketing, as well as perceive gaps and its causes, which would provide a more effective budget management, through a better resources’ allocation.
Keywords: digital marketing, marketing metrics, marketing performance measurement,
ROI marketing
JEL Classification System: L25 Firm Performance: Size, Diversification, and Scope
M13 Start-ups M31 Marketing
RESUMO
O presente caso de estudo tem como principal propósito analisar o impacto de boas práticas de medição da performance do marketing nos resultados da empresa, usando métricas financeiras.
Com o avanço do digital, tornou-se mais fácil medir os esforços de marketing. Assim, este projeto está focado no processo de medição de performance de marketing digital da Forall Phones, na maneira como os indicadores de performance são escolhidos, comunicados e usados para tomar decisões estratégicas, e se o departamento de marketing está ou não a criar valor para a empresa.
O processo de medição usado tem sido uma das vantagens competitivas da empresa, havendo uma constante monitorização de custos relativamente aos benefícios, de modo a proporcionar uma leitura clara do que é mais rentável para o departamento. Existe um foco claro nas métricas altamente quantificáveis e mensuráveis e o estabelecimento de objetivos e de públicos-alvo, e sua monitorização, permite um foco mais claro daquilo que se pretende, canalizando os esforços nesse sentido.
Apesar do elevado investimento em marketing e de, desde a profissionalização do departamento, os resultados ao nível de vendas e receita terem aumentado consideravelmente, não existem dados suficientes para o destacar, claramente, dos restantes. Uma possível justificação é o facto de o departamento não fazer uma previsão de ROI com uma monitorização do mesmo, o que permitiria saber toda a rentabilidade do marketing, bem como perceber desvios e causas dos mesmos, proporcionando uma gestão do budget mais eficaz, através de uma melhor alocação de recursos.
Palavras-Chave: marketing digital, métricas de marketing, medição de performance,
marketing ROI
JEL Classification System: L25 Firm Performance: Size, Diversification, and Scope
M13 Start-ups M31 Marketing
I
INDEX
1. CASE STUDY CONTEXT ... 1
1.1. THE PROBLEM ... 1
1.2. MACROECONOMIC OVERVIEW ... 2
1.3. MARKET ANALYSIS - EXTERNAL ANALYSIS ... 3
1.3.1. SMARTPHONES MARKET IN PORTUGAL ... 3
1.3.2. EXTERNAL ANALYSIS - SMARTPHONES INDUSTRY – THE GROWING SEGMENT OF REFURBISHED ... 4
1.3.3. THE COMPETITIVE SITUATION ... 7
1.4. FORALL PHONES – INTERNAL ANALYSIS ... 10
1.4.1. BUSINESS IDEA AND HISTORY... 10
1.4.2. OPERATING MODEL AND PRODUCTS ... 11
1.4.3. TARGET MARKET ... 12
1.5. MARKETING AT FORALL PHONES ... 13
1.5.1. E-COMMERCE VS PHYSICAL STORES ... 13
... 17
1.5.2. FORALL FAMILY ... 17
1.5.3. IMPORTANCE OF THE MARKETING DEPARTMENT AT FORALL ... 18
1.6. DIGITAL MARKETING PERFORMANCE MEASUREMENT ... 21
1.6.1. BEST PRACTICES IN DIGITAL MARKETING PERFORMANCE MEASUREMENT ... 21
1.6.1.1. THE IMPORTANCE OF MEASUREMENT ... 21
1.6.1.2. THE “RIGHT” METRICS ... 22
1.6.1.3. ROI MARKETING ... 26
1.6.2. FORALL PHONES DIGITAL MARKETING PERFORMANCE ... 28
1.6.2.1. FORALL PHONES’ DIGITAL MARKETING PERFORMANCE MEASUREMENT ... 29
1.6.2.1.1. GOALS ESTABLISHMENT ... 30
1.6.2.1.2. DATA GATHERING – PLATFORMS OPERATIONALIZATION AND REPORTING ... 31
1.6.2.1.3. DATA ANALYSIS ... 32
1.6.2.1.4. THE FEEDBACK FOR STRATEGIC DECISIONS ... 34
1.6.2.1.5. REPORTING AND COMMUNICATING ... 35
1.6.2.2. THE BLACK FRIDAY CAMPAIGN – ILLUSTRATIVE EXAMPLE OF PERFORMANCE MEASUREMENT ... 36
II
2. QUESTIONS ... 40
3. APPENDICES ... 41
APPENDIX 1. MAP OF THE PERCENTAGE OF PEOPLE LIVING WITH THE MINIMUM WAGE IN EUROPE ... 41
APPENDIX 2. LEVEL OF MINIMUM WAGE IN THE 28 EU MEMBER STATES ... 41
APPENDIX 3. MEDIUM AVERAGE SALARY (€) IN THE 28 EU MEMBERS ... 42
APPENDIX 4. TAX BURDEN CONTRIBUTION TO GDP (IN %) IN PORTUGAL FROM 1995-2017 ... 42
APPENDIX 5. TAX BURDEN CONTRIBUTION TO GDP IN THE 28 MEMBER STATES (2017) ... 43
APPENDIX 6. EVOLUTION OF THE UNEMPLOYMENT RATE (%) IN PORTUGAL (1983-2017) ... 43
APPENDIX 7. UNEMPLOYMENT RATE IN THE EUROPE COUNTRIES (2018) ... 44
APPENDIX 8. MOBILE PHONE PENETRATION RATE (%) IN PORTUGAL (2004-2018) ... 44
APPENDIX 9. NUMBER OF SMARTPHONES SOLD TO END USERS WORLDWIDE 2007 TO 2017 (IN MILLION UNITS) ... 44
APPENDIX 10. GLOBAL SMARTPHONE SHIPMENTS RANKING (MILLION UNITS) AND YOY% GROWTH (2016-2017) ... 45
APPENDIX 11. REFURBISHED SMARTPHONES VS NEW SMARTPHONE SHIPMENTS YOY GROWTH (%) IN EMERGING REFURBISHED MARKETS ... 45
APPENDIX 12. REGIONAL ANNUAL GROWTH COMPARISON IN THE GLOBAL SMARTPHONE MARKET ... 45
APPENDIX 13. BIGGEST SMARTPHONE PLAYERS SHIPMENT VOLUMES (MILLION UNITS) AND MARKET SHARE VARIATION (%) (2017-2018) ... 46
APPENDIX 14. PRICING BENCHMARKING ANALYSIS IPHONE 8 64G & IPHONE X 64 G ... 46
APPENDIX 15. FORALL PHONES PRODUCT OVERVIEW ... 46
APPENDIX 16. PAYMENT, RETURNS & WARRANTY ... 47
APPENDIX 17. FORALL PHONES STORES LOCATION ... 47
APPENDIX 18. PERCENTAGE OF PEOPLE BETWEEN 16-74 YEARS OLD WHO USED ELECTRONIC COMMERCE IN PORTUGAL (2010-2017) ... 47
APPENDIX 19. EVOLUTION OF INTERNET PENETRATION IN PORTUGAL (1997-2017) ... 48
APPENDIX 20. FORALL PHONES’ SALES BY CHANNEL (%) AND TOTAL SMARTPHONE SALES UNITS (SEP-DEC 2018) ... 48
APPENDIX 21. FORALL PHONES ONLINE MARKETING TOOLS & PLATFORMS .. 49
APPENDIX 22. METRICS SYSTEM SUMMARY TABLE (DIGITAL SOFT METRICS) 50 APPENDIX 23. METRICS SYSTEM SUMMARY TABLE (DIGITAL HARD METRICS) ... 51
III
APPENDIX 24. BLACK FRIDAY CAMPAIGN COMMUNICATION POSTED ON
FACEBOOK ... 52
4. TEACHING NOTES ... 53
4.1. CASE STUDY TARGET ... 53
4.2. PEDAGOGICAL OBJECTIVES ... 53
4.3. LITERATURE REVIEW ... 54
4.3.1. MARKETING PERFORMANCE MEASUREMENT ... 54
4.3.2. DIGITAL MARKETING AND DATA GATHERING ... 59
4.3.3. DIGITAL MARKETING PERFORMANCE MEASUREMENT ... 62
4.3.3.1. ALIGNMENT AND ACCOUNTABILITY – INTEGRATING FINANCIAL INDICATORS ... 66
4.3.3.1.1. THE ROI MARKETING METHODOLOGY ... 69
4.3.3.2. MONITORING AND COMMUNICATING THROUGH ACTIONABLE DASHBOARDS ... 71
4.4. ANALYTICAL FRAMEWORK PRESENTATION ... 73
4.5. ACTION PLAN ... 75
4.6. ANIMATION QUESTIONS ... 76
4.7. CASE STUDY RESOLUTION PROPOSAL ... 76
4.8. CASE STUDY RESOLUTION SLIDES ... 92
5. MANAGEMENT LESSONS AND MAIN CONCLUSIONS ... 98
6. BIBLIOGRAPHY ... 102
INDEX OF TABLES
TABLE 1. PRICING POSITIONING ANALYSIS ... 8TABLE 2. FORALL PHONE’S MARKETING INVESTMENT BY CHANNEL AND COST PER ACQUISITION BY SALE (€) (SEP-DEC 2018) ... 20
TABLE 3. THE RIGHT METRICS SUMMARY ... 24
TABLE 4. BASIC ROI CALCULATION ... 27
IV
INDEX OF FIGURES
FIGURE 1. SMARTPHONE PENETRATION IN PORTUGAL (%) (2012-JUL2018) ... 4
FIGURE 2. MARKET SHARE OF USED SMARTPHONES (%) WORLDWIDE FROM 2015 TO 2020 ... 6
FIGURE 3. PERCENTAGE OF PEOPLE BETWEEN 16-74 YEARS OLD WHO USED ELECTRONIC COMMERCE IN PORTUGAL (2010-2017) ... 14
FIGURE 4. ONLINE AND STORE SMARTPHONE SALES UNITS (SEP-DEC 2018) ... 17
FIGURE 5. FORALL PHONE’S MARKETING DEPARTMENT CHART ... 18
FIGURE 6. FORALL PHONE’S DIGITAL MARKETING ECOSYSTEM ... 19
FIGURE 7. VEM MARKETING’S FRAMEWORK OF METRICS ... 23
FIGURE 8. DIGITAL MARKETING METRICS DIVIDED INTO CATEGORIES (ACQUISITION, BEHAVIOUR, CONVERSION AND INVOLVEMENT) ... 25
FIGURE 9. FORALL PHONES’ PERFORMANCE ANALYSIS FILE ... 33
FIGURE 10. FORALL PHONES’ PERFORMANCE ANALYSIS DASHBOARD ... 36
INDEX OF TABLES TEACHING NOTES (TN)
TN TABLE 1. STEEL’S WEB ANALYTICS METRICS FOR THE DIFFERENT STAGS OF CUSTOMERS’ PATH TO PURCHASE ... 65TN TABLE 2. TYPE OF ADVERTISING CONTRACTING MODEL ... 65
TN TABLE 3. ACTION PLAN ... 75
TN TABLE 4. DIGITAL MEASUREMENT PLAN OF FORALL PHONES - RESOLUTION PROPOSAL ... 91
INDEX OF FIGURES TEACHING NOTES (TN)
TN FIGURE 1. THE CHAIN OF MARKETING PRODUCTIVITY ... 56TN FIGURE 2. THE MARKETING-PERFORMANCE OUTCOME CHAIN AND EXAMPLE MEASURES ... 56
TN FIGURE 3. TYPES OF RETURN ON MARKETING ACTIVITIES ... 68
TN FIGURE 4. THE ROI MARKETING PROCESS MODEL ... 71
TN FIGURE 5. STEEL’S DIGITAL MARKETING PERFORMANCE MEASUREMENT PROCESS AND TOOLS IN USE ... 72
TN FIGURE 6. INDICATORS THAT MAY HAVE LED TO THE CREATION OF FORALL PHONES ... 78
TN FIGURE 7. DIGITAL MARKETING PERFORMANCE MEASUREMENT PROCESS ADOPTED BY FORALL PHONES ... 79
1
1. CASE STUDY CONTEXT
1.1. THE PROBLEM
With the economic crisis that rose in Europe, several countries, including Portugal, have implemented severe austerity measures, such as wages cuts or an increase in direct and indirect taxes, leading to a fall in family incomes, also due to the increase in the unemployment rate. Because of this, many consumption patterns have had to be altered, changing some household behaviours regarding their hierarchy of priorities. In addition to the families, many companies also entered a cost containment phase, leading to collective redundancies, lower wages and an increase in the number of working hours. The need to justify investment has been increased over the last years and, then, today the need for results is mandatory.
These days, organizations are optimizing costs, so it is required for all departments to be financially accountable. Due to this, the need for measurement is indispensable because without measurement it is impossible to be accountable. The growing pressure within the companies to attain results and outcomes has been leading to the measurement of the return on marketing, treating marketing expenditures as an investment and not as cost (Schultz & Gronstedt, 1997 as cited in Seggie, Cavusgil & Phelan, 2007), being possible to compare them to other assets or departments, enhancing the marketing function as a crucial role in the business strategy. Marketing Science Institute (MSI) in a Journal of
Marketing article (2004), emphasizes that marketing only would have “a seat at the table”
if linked to financial performance. The same institution suggests that marketing will continue losing points to other departments, if they continue focusing only on soft measures, as brand awareness.
In fact, there is evidence that senior management is much more demanding, requiring information of the return on investment (ROI) from the campaigns the marketers are carrying out, owing to the substantial amount of financial resources they manage (Seggie
et al., 2017). In the 2017 VisionEdge Marketing (VEM) report, research from KPMG was
tinted, suggesting that 9 in 10 organizations “expect their CEO to lead the organization on a strategic growth trajectory”. Research by CMO Council and Deloitte was also emphasized in which “almost 70% of CEOs now expect CMOs to lead revenue growth” (VEM, 2017).
2
In this sense, this case study was focused on three main goals: first, to analyse Forall Phones, focusing on their marketing department and how they measure the digital marketing performance, as well as to explore the involved market, analysing its potential and characteristics. Second, to study the importance of measuring the performance of digital marketing, by adding financial indicators linked to the business outcomes and, finally, to define solutions to improve the level of performance measurement in Forall Phones.
1.2. MACROECONOMIC OVERVIEW
The economic crisis that began in 2008 was felt a bit throughout all Europe, and Portugal was no exception. Economic adjustment programs were necessary, bringing high tax burdens to the Portuguese, wages below the European average and many cuts on salaries. Although the crisis effects have been softened over the years, Portugal continues to have a large fiscal burden compared to monthly gross wages, lower wages and with one of the lowest wages in Europe.
In March 2018, 764.2 thousand workers were covered by the national minimum wage, representing 22.9% of the active population in Portugal (Eurofound, 2018). According to Eurofound (2018), these numbers put Portugal at the top of the list of European countries with the highest percentage of people living on the minimum wage, only surpassed by Romania and Estonia (See Appendix 1).
The current gross Portuguese minimum wage is 600 €, 20 € higher than the previous year (Eurofound, 2018). These figures placed Portugal as the 12th country in Europe with the highest minimum wage in 2018, far below the values practiced in Luxembourg (the first country on the list with a monthly minimum wage of 1.998,6 €) and even the neighbour Spain, whose salary has increased to 900 € in 2019 (See Appendix 2).
It is not only in the minimum wage that Portugal is at the base of the European Union’s (EU) wage pyramid. A Portuguese has to work 4 months to earn the same as a Dane wins in a single month. The average Portuguese gross salary in 2017 was 1.017€, below the EU average of 2.000€ (Adecco and Barceló y Asociados, 2017). According to a study by Adecco and Barceló y Asociados (2017), Portugal was the 10th EU country with a lower average salary, far below Denmark, which with 3.807€ leads the list of countries with the highest gross monthly remuneration (See Appendix 3).
3
Since the beginning of the crisis, the Portuguese people have suffered severe salaries’ cuts. Since 2008, the direct income taxes, have led the Portuguese to deliver much of their income to the state, through direct and indirect taxes. The Portuguese tax burden contribution reached its highest records in 2018, contributing with 35.4% to GDP, according to INE (2018), surpassing the previous year, with a contribution of 34.4% (INE, 2017) (See Appendix 4). Despite this high tax burden, the weight of taxes and social contributions in Portugal is still lower than the average in the EU. Compared with the rest of the Member States, Portugal is below average (INE, 2017) (See Appendix 5).
The years after the crisis were black years regarding the unemployment rate in Portugal. In 2013, unemployment reached a 16.2% rate, a new record (Pordata, 2017). Since then, there has been a steady decline since reaching the lowest level in recent years, with 6.7% (See Appendix 6) in October 2018, according to Eurostat (2018). Today, according to Pordata (2018), the Portuguese unemployment rate is in line with the European Union average, with the same value (See Appendix 7).
1.3. MARKET ANALYSIS - EXTERNAL ANALYSIS
1.3.1. SMARTPHONES MARKET IN PORTUGAL
According to the International Data Corporation (IDC) European Mobile Phone Tracker, in 2009, one year after the crisis, in the technological sector, 622 thousand smartphones were sold in Portugal, representing a decrease of 28% when compared to the previous year. For the European Research from IDC’s Mobile Phones Area, Francisco Jerónimo (2010) “The Portuguese mobile phone market witnessed a drop never seen before in 2009. The economic crisis has had a strong impact on demand in a market where penetration rates above 100% show a clear saturation”.
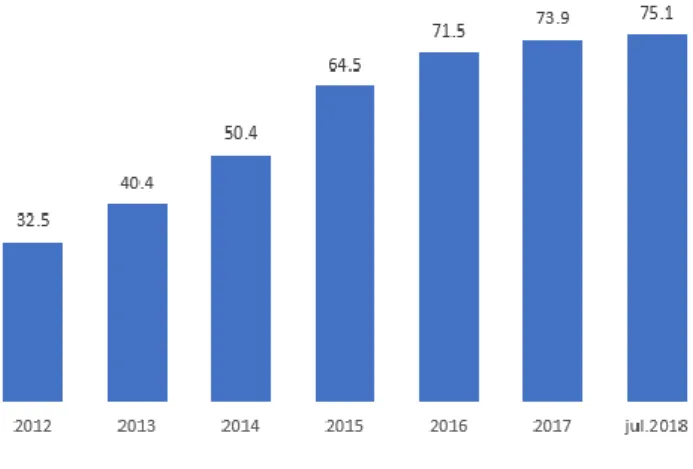
Despite the crisis, as of 2010, the number of Portuguese with smartphones began to grow, exponentially. In 2018, more than nine million Portuguese, living in Continental Portugal, aged 10 or older, had a mobile, and most of them, a smartphone (Marktest, 2018). In fact, according to Marktest Barómetro de Telecomunicações, in July 2018, close to 6.9 million individuals had a smartphone, representing close to three-quarters of the total number of mobile phone owners (See Appendix 8). The same entity states that this has been a growing trend in Portugal over recent years, from 32.5% in 2012 to 75.1% in 2018, more than doubled the number, registered five years earlier (See Figure 1).
4
1.3.2. EXTERNAL ANALYSIS - SMARTPHONES INDUSTRY – THE GROWING
SEGMENT OF REFURBISHED
The smartphone market is a market that has been growing in the last decade. The number of people using smartphones has surpassed all barriers, so nowadays there are more smartphones than people, being the first thing that people look when they wake up and the last thing they use when they go to bed.
According to the GSMA’s Global Mega Trends report in 2018, about 5.1 billion people use mobile devices, two-thirds of the world’s population, and the majority of these mobile devices are smartphones. The number of smartphones sold worldwide has been increasing significantly. From 2007 to 2015, the growth rate of the number of smartphones sold increased from year to year, only stagnating from 2016 (See Appendix 9). In 2012, the number of smartphones sold reached 680 million units, increasing to 1.5 billion in 2016, meaning that at that time about 28% of the world's population had a smart device, a figure that is expected to increase to 37 % by 2020 (Statista, 2015). By 2017, around 1.54 billion smartphones were sold worldwide, and, in 2018, the growth rate of smartphones sold in the world reached its lowest value (3.1%) (Statista, 2015).
Brands like Huawei have been improving its prominence in the global market, having already surpassed Apple in market share in the third quarter of 2018, with a growth of 32.9% (See Appendix 10). Xiaomi, with a growth of 21.20%, consolidates the 4th place in the global market, contradicting its trend of slowing down in recent years. These brands contrast with the downward trend of the global market, which fell 6% in the third quarter
Source: Marktest (2018)
FIGURE 1. SMARTPHONE PENETRATION IN PORTUGAL
5
of 2017, the main reason being their substantially lower price in comparison to Apple and Samsung (Counterpoint, 2017).
The decline in the global market in recent years is largely due to the growth of the market for used and refurbished smartphones, which are sold at much lower prices than the new ones. Due to the exorbitant prices of high-end smartphones, adding to the numerous economic difficulties that families have been facing, the second-hand or refurbished smartphone market has begun to rise another weight in the global market.
In 2016, Deloitte quantified the refurbished market in 17 billion USD$, with 120 million units sold, at an average price of 140 USD$, representing a 50% appreciation over 2015. In that year were sold 80 million smartphones, quantifying the market at 11 billion USD$. According to the same entity, with its TMT Predictions 2016 Report, it was also predicted that the growth rate of the used mobile phones market would be 4-5 times higher than the general smartphone market.
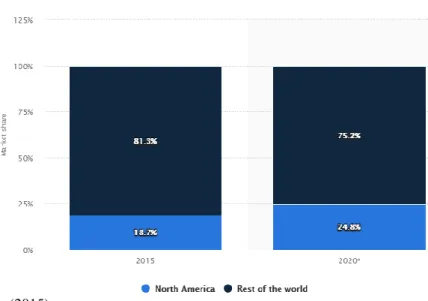
By the end of 2017, the refurbished market was already worth 19 billion USD$ and, according to the IDC (2018) forecast, this figure would rise year after year at a rate of 10%. For this weight, much contributed the US. In fact, by 2015, the US refurbished market accounted for 18.7% of the entire second-hand smartphone market, with an expected increase to 24.8% in 2020, according to Statista (2015) (Figure 2). That is, it is predicted that in 2020, about 55 million used smartphones will be sold, only in this country.
IDC (2018) also expects this industry will reach a 52.7 billion USD$ value in 2022, representing an average selling price of 180 USD$, believing that this market may present opportunities for revenue growth and market share, as second-tier devices become more prepared to capture a larger share of the market, over the next few years.
While this segment has been growing, since 2016 the global smartphone market has been stagnating, having grown only 3% in 2017, a number very far from the growth rates obtained until then. After growing 28% in 2014, the number of smartphones shipments grew only 10.5% in 2015 and 3.1% in 2016. For this, IDC (2018) has pointed out some causes, such as the longer refresh cycles, the offer with regard to the repair by the consumer which allows to increase the life of the smartphone (The Right-to-Repair movement), and especially the “increased smartphone prices at the high end of the spectrum that has led to many consumers holding on to their phones longer than
6
expected”, highlighted by Anthony Scarsella (2018), a research manager for IDC's Mobile Phone program, making the option for reconditioned mobile phones more attractive.
Reducing e-waste is another important favor factor of refurbished smartphones, allowing the reuse of old smartphones and preventing the increasing number of e-waste. This is an important point since the refurbished allows the reuse of smart devices that were previously thrown away or placed in a drawer, thus reducing the amount of electronic waste on the planet. In this way, second-hand devices can have a premium offer at affordable prices and, at the same time, reduce electronic waste, contributing to a sustainable environment and raising awareness of it.
The slowdown in the global smartphone sales in 2016 in giant markets such as Europe, China or the US is mainly due to the saturation of high-end models, mostly iPhones and Samsung Galaxy's, leading major brands to adopt new strategies, now in emerging countries such as India, South Africa or Nigeria, and also starting to sell used mobile phones, such as Samsung, responding to its decline in their mobile market share. In Appendix 11, the difference in the growth rate of this market between 2016 and 2017 in the main markets can be verified. Only in India, according to the Counterpoint Technology Market Research (2017), the refurbished segment grew close to 25% in 2017, representing 12 million smartphones sold, mostly Apple and Samsung. As stated by the same entity (2017), India is among the fastest growing markets in this segment, along with Africa and Southeast Asia (See Appendix 12).
Source: Statista (2015)
FIGURE 2. MARKET SHARE OF USED SMARTPHONES (%)
7
In 2017, the refurbished segment was even the fastest growing in the global smartphone market. According to the Counterpoint's Refurbished Smartphone tracker report (2017), the refurbished smartphones market value grew by 13% in 2017, selling 140 million units, contrasting with the growth rate of 3% of the global market (See Appendix 13). Already in 2018, the refurbished segment grew 10% in the second quarter, contrasting with the declining growth rate of 1% in the global market, in the same period. According to the same organization, the weight of top brands such as Apple and Samsung, compared to other brands is even more visible in this segment, totalling three-quarters of the entire refurbished market and 80% of the total revenue.
1.3.3. THE COMPETITIVE SITUATION
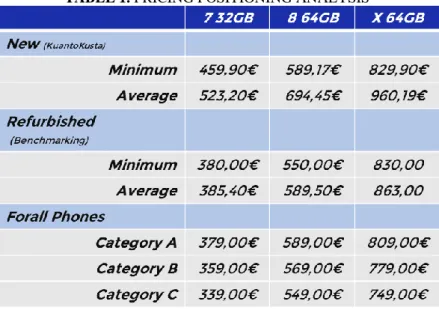
The refurbished smartphone market in Portugal is characterized by being slightly recent in terms of its longevity, and by having two types of companies: big players with history in the electronic gadgets industry, such as Worten, Fnac, Radio Popular and The Phone House; small companies focusing only on second-hand gadgets, such as smartphones, laptops, smartwatches, tablets, promising high-end technology at an affordable price. In 2016, along with the Forall Phones appearance, other similar companies arrived at the national level, offering refurbished smartphones, in some street stores in Porto and Lisbon. However, these stores did not bring what Forall wanted to bring to the market, an online presence and a brand that supports the lifestyle and the needs of the consumer. Once created, in 2016, several electronic retailers operating in Portugal, such as Worten, Fnac and The Phone House, realizing the value of this market, which grew 13% in that year (Counterpoint, 2017), and the high margins practiced in this segment, they decided to move on in this market, pressing Forall. These brands with a sustained position in the electronic market, have taken advantage of the segment growth, selling second-hand products such as smartphones, by Apple and Samsung, at much lower prices than the new mobile phones average. Table 1, provided by Forall Phones, presents the pricing positioning of the main market players, based on the KuantoKusta price comparison platform, comparing Forall’s products prices with other competitors, subdivided into three different categories, usually defined by the brands, according to the smartphone state, being: A – very good condition, B – good condition, and C – reasonable.
8
IServices, which is specialized in device repairs, also recently started selling refurbished iPhones, and The Phone House are Forall Phones’ main competitors.
IServices was born in 2011 and is the market leader in Portugal in smartphone repair services. It specializes in mobile products and technologies, composed by a highly qualified team. Today it is present from the north to the south of the country, having physical stores in Braga, Porto, Coimbra, Lisbon, Cascais, Setúbal, Faro and Funchal and a huge variety of products that can be bought in the digital store or in the physical stores (new and refurbished top-of-the-range smartphones, protectors screens, headphones, power banks, speakers and drones) and a good customer support services. Multi-brand device repair is performed on time regardless of where the equipment is purchased. The Phone House Portugal is the Forall’s competitor with more history and relevance in the Portuguese market. It is a telecommunications retailer with about 100 multi-operator stores. They arrived in the Portuguese market in 1999 and aims to offer the best offer of telecommunications and multimedia solutions, covering all brands and operators, achieving a good position in the market. They focus on the smartphone market and operator services, with integrated solutions for personal, residential and business customers. They entered in the refurbished segment, selling smartphones (iPhone and Samsung Galaxy), iPad Tablets and Apple Smartwatches, selling them online and at physical stores.
Source: Forall Phones (2019)
9
P-Telemoveis, 12Vinte, and iMobiles have also a good position on the segment, in Portugal. P-Telemoveis was created in 2005 in Leiria, selling smartphones, accessories, and providing technical assistance in the repair of technological products and appliances. Now, it has three stores in the district of Leiria and an online store. This company stands out for its speed and assertiveness, being the repair of the equipment the core of the business, promising repairs within a maximum term of five days. In addition to smartphones, the company invests in qualified technicians who can repair almost all types of electronic devices, from GPS, home appliances or computers, as well as consoles or mobile phones. In their online store, they sell everything, from mobile phone covers to top-of-the-range smartphones, as well as refurbished and used equipment such as Apple computers.
12vinte is a used and refurbished equipment store, selling only Samsung and Apple smartphones, MacBook notebooks and Apple smartwatches. Unlike P-Telemóveis, 12vinte has no repair business and only sells in their online store, not having any physical store. In addition to second-hand handsets, it also sells mobile phone accessories such as protective covers or tempered glass films.
iMobiles Outlet Portugal is a company that is especially focused on refurbished and semi-new products, mainly Apple, at an outlet price, online. The company has its office in Marinha Grande and sells its equipments (smartphones, iPad, and MacBook) on its website. The distribution is made through Chronopost or CTT services, with prepayment and collection. iMobiles also provides a repair service for its own products and sells accessories for smartphones, such as smartphone and iPad chargers, headphones or screen protectors.
At the European level, the German ReBuy stands out from the others, claiming to be Europe’s largest recommerce site for electronic goods. This company buys second-hand products, such as electronics and watches, from 10 product categories, inspects them and sells them through its website or through marketplaces such as Amazon, eBay or Gebraucht.de. Founded in 2004, the company is present in Germany, Austria, France, and the Netherlands, through an online store.
10 1.4. FORALL PHONES – INTERNAL ANALYSIS
1.4.1. BUSINESS IDEA AND HISTORY
Created by José Costa Rodrigues, the company’s current CEO, at the end of 2015, the Forall Phones brand was born from the desire of the creator to have a top-of-the-line phone, at that time an iPhone 4S, by all means, costing around 500€, when he was only 16 years old. Due to the smartphone high price, José’s parents refused to pay for it because of the economic situation of the family at the time. At that moment there was a click, and José created the business that Forall Phones is, a Portuguese start-up that, in 2018, sold approximately 4.2 million €. At the time, the 16-year-old decided to sell some belongings, such as books or video games that he did not need anymore, gathering the money to buy the so much desired iPhone. Through OLX Marketplace, the young entrepreneur achieved his goal by buying a second-hand mobile phone. Realizing that it was so easy to achieve his purchase goal, he decided to sell the phone a month later, still making a profit. It was here that José saw a business opportunity of buying and selling used smartphones, creating the Forall Phones, five years later, with only 300€ and without external support. Before the official registration of the brand, by the end of 2015, José had already decided to create a network of ambassadors (community shapers), selling smartphones in his high school through influential friends. Through them, it was possible to share some photos and descriptions of the products, also earning a commission with every sale made. In just three months, he made 70.000€. This ambassadors program remains today, focusing on young university students, the main Forall’s target, young people between 18 and 35 years.
The brand name is quite suggestive: “For all phones”, illustrating the idea that it is possible for everyone to have a high-quality smartphone, making high-end technology accessible to everyone.
In the first year, the firm generated 350.000€, just through word-of-mouth and, later, through an online site. In fact, what at the time seemed to be a simple desire to have a top-of-the-line mobile phone, had become a profitable business, currently with 61 full-time employees, 55 in Portugal, five in Spain, and one in China, selling to 16 countries in Europe (through marketplaces such as Amazon, Backmarket, Allegro, Refurbed and C-Discount), with six physical stores in Portugal, three stores in Spain, and with the strategic vision to open 13 stores in Spain by the end of 2019, forming a business that grows
11
annually 757% since 2015. The business of Forall Phones seems simple: sell high-level refurbished or used smartphones, from Apple and Samsung, at a price up to less than 40 % to the one practiced in the market. In fact, in some smartphones, Forall is really the market player, in Portugal, practicing the lowest or the second lowest price in the market, as can be seen in the cases of the iPhone 7 32G and the iPhone X 64G (See Appendix 14). Keeping the machine well-tuned, supported by young people, is a constant learning challenge by a company that aims to reach 20 million € in sales by the end of 2019. Because of that, the company is increasing its team and has sought to recruit people with more experience for strategic positions.
Actually, the firm aims not only to be number one in Portugal in the refurbished smartphone industry in the coming years but also in other countries. In the words of Bernardo Carreiro, Forall’s Financial Controller: “Our goal in terms of positioning is to be able to have a brand recognized for its youthfulness, adaptability and, more important, its high awareness as an integral part of a society, both by the mission itself, as well as the constant awareness of factors such as social responsibility, environmental concerning and circular economy. We wish that, in a few years’ time, all Europe (who knows, the world) might know our brand by the very potentiality of its name. We want to be distinguished for being “for all” – again, on all the issues involving employees, clients, and any other stakeholder”.
The next steps are to cross the borders, opening stores in Spain and in central Europe, in order to invest in the Polish market. The idea is to keep the center of the operation in Lisbon, but the brand also has an office in Madrid, with a full-time team.
The first store opened in October 2017 in Alvalade (Lisbon), and since then, eight more stores have opened, five in Portugal and three in Spain: Porto (May 2018), Leiria (November 2018), Coimbra (November 2018), Setúbal (February 2019), Madrid (February 2019), downtown Lisbon (March 2019), Salamanca (March 2019), and Barcelona (April 2019). The brand continues to grow, and it is expected that they will open 13 stores in Spain by the end of 2019. At the national level, the brand intends to have 10 physical stores by the end of 2019.
1.4.2. OPERATING MODEL AND PRODUCTS
Forall Phones only sells used smartphones, from Apple and Samsung, short-lived or that were used for display in stores. Appendix 15 presents some of the available products on
12
the brand’s website. The firm buys used smartphones from large retailers, businesses, private individuals, and telephone operating companies who have used the mobile phones as a display in their stores, reselling them to the public, as new ones, in their own stores or on their website and marketplaces. Because the smartphones are on display, they can no longer be sold at a new mobile phone price.
For Forall’s financial department, the brand business model is the key to the business. The value chain starts with the purchasing function (99.5% directly with suppliers and 0.5% with customer returns). The suppliers are, in great majority, foreign entities that suppress the procurement phase. In other words, for brands like Apple and Samsung, Forall works with entities that already collect thousands of smartphones from retailers/operators and then they distribute to companies like them. At the moment, the brand is also working to launch itself on the B2B channel, through vertical integration, allowing to add this function to its value chain, in order to achieve higher and better margins.
After receiving the smartphones, they go through a reconditioning process (within the company) and are later released to the market as the final product.
In addition to smartphones, the company also sells iPad (Apple tablet) and smartphones accessories, such as protective covers, tempered glass, chargers, power banks, and has a specialized repair and assistance service. Forall’s control department reviews the incoming phones and professionally refurbishes them to ensure maximum functionality and quality. Refurbished phones are sold up to less than 40% of the original price. On the website, the customer orders the smartphone and receives it within five working days. Customers can pay by credit card, PayPal, bank transfer or collect on delivery. Each smartphone has a one-year warranty and can be returned within 14 days (See Appendix 16).
1.4.3. TARGET MARKET
Forall’s main target is young people between 18 and 35 years. Although this is the most profitable brand target, they believe that there are customers “of all ages”. With more than 300 active ambassadors, José Rodrigues wants to reach out to all Portuguese universities, investing in direct contact with the consumer that they want to attract and maintain.
13
The main target is characterized as a young population, with little to no annual income, mainly students, and so their purchasing power is reduced, and many of them are still depending on their parents. Belonging to Millennials and Generation Z, they are highly digital and want the latest technology at their fingertips. Today, young people want to be at the forefront of technology and for them, using an iPhone, for instance, is a social status need, since they have a very expensive and stylish device, not within everyone’s reach. In 2014, the International Business Times reported that clothing retail has been surpassed by gadgets as a social status symbol, emphasizing that clothes might “make the man but an iPhone makes a teenager”. In Stephanie Wissink’s opinion, senior research analyst at Piper Jaffray, when young people go shopping, they look for gadgets instead of clothing, looking for devices of popularity rather than utility. Marcia Flicker, associate professor in Business Enterprise at Fordham University, reports that technology is making competition increasingly stronger for teens and young adults, asking when brands like Apple will release new models to the market because they refuse to be stuck with a previous slower model.
As technology advances, prices increase, so it is hard to have premium technology at its market price. This way, the second-hand products offer from Forall Phones intends to attract this target population, who has little income and who worries about their image and reputation. That is why the company’s offer is limited to top-of-the-range brands such as Apple and Samsung.
Despite the start-up’s main revenue source being directly linked to physical stores, digital has played a significant role in the brand image nowadays, since its communication is almost exclusively digital, through social networks or digital advertising.
1.5. MARKETING AT FORALL PHONES
1.5.1. E-COMMERCE VS PHYSICAL STORES
Forall Phones engage with its consumers through multiple channels and one of its competitive advantages is its after-sales service, making the service as personal as possible in a customer-centric approach. Despite the number of physical stores (nine at the moment, with the goal of open 10 in Portugal and 13 in Spain until the end of 2019), the Forall Phones’ business would not have the success that it has today if they hadn’t invested in digital marketing. In fact, given the store’s location (see Appendix 17), not being close to high traffic centers, such as historical areas or shopping centers, there are
14
not many occasional buyers, except in the downtown Lisbon store. That is to say, that the people that go to the store already know what they want and already are aware of the brand, either because they were bombarded with online ads or through word-of-mouth, which is pointed out by the CFO of Forall, Manuel Castel-Branco, as a sales booster at this stage.
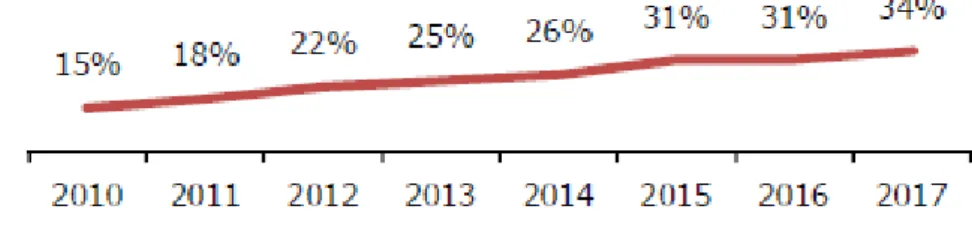
The physical stores’ investment approach is due to several factors: firstly, the profile of the Portuguese population, who, unlike other European societies, still has a great need to see products before buying them. In general, the Portuguese like to try the product and they still distrust the internet dangers. In 2017, 34% of the resident population aged 16-74 reported having used the internet to order online products or services, a number that has doubled since 2010 (15%), according to INE (2017) (See Figure 3). This figure rose to 37% in 2018, according to the same entity. In fact, this value has been rising in the last decade. Today, four out of 10 residents buy products through a smartphone or computer, much due to the mass production of technology.
Despite this rise, Portugal remains far behind the European Union average, 26 percentage points lower in 2016 (see Appendix 18). The mild climate and the sunny days in Portugal, the culture of going out, unlike the Northern Europe people, who spend much more time at home due to bad weather and rainy days, and the fact that it is a small country also makes it easier to find products in the physical world. The weak internet penetration in Portugal when compared to other European countries, allied to the aging population, justify the gap that still exists between online and physical purchases. However, this internet penetration rate has been increasing, registering in 2017 an internet penetration rate of 68.8%, according to Marktest (2017), which also influences the perceived increase
Source: INE (2017)
FIGURE 3. PERCENTAGE OF PEOPLE BETWEEN 16-74 YEARS OLD WHO
15
of online purchases, previously mentioned (see Appendix 19). In addition to the characteristics intrinsic to the Portuguese, the product presented by Forall Phones may sometimes lead to consumer’s distrust. Since the product Forall sells is a refurbished and not a new phone, the buyer will want to check the smartphone state to corroborate if it is in great condition.
Forall stores have some common traits (except the downtown Lisbon store): they try to give continuity to the online customer experience. They are typically small spaces that end up acting almost as pick-up points but, at the same time, they allow the customer to have greater confidence in the brand since it has, effectively, a physical space where they can turn if necessary.
It is important, then, to distinguish the three main direct sales channels to the consumer: the brand website, the marketplaces (including Amazon) and the physical stores. However, at Forall Phones, digital and physical channels are not seen as separate and independent entities. In fact, the brand does not consider itself as a retailer with e-commerce, but an e-commerce with physical stores/collection points. Physical stores sales far exceed online sales, including marketplaces and website, but this figure is the result of Forall’s online excellence and the community shapers performance. In addition, online marketing allows taking a performance approach to sales scalability. The distinction between online and offline in this case becomes even more complicated due to the brand’s business model. Since it is possible to order a smartphone online and picked it up at the store or ordered it online and get it delivered at home, which makes it almost impossible to allocate the sale to an independent online or offline marketing effort. This is why Forall Phones does not break sales into separate compartments, since the buyer that gets a smartphone in the store might have bought it because he saw an ad on Facebook, which is an online effort, for example.
Nevertheless, digital channels have been fundamental in the firm’s evolution and development, since its creation in 2015. Between September and December 2018, where all the sales channels began to be accounted, Forall sold 20-29% through its website, and up to almost 12%, over the same period, through marketplaces. Appendix 20 gives the detailed sales percentages and the number of smartphones sold, per online channel (from the website in Portugal and in the EU, Amazon, and other marketplaces) and per physical stores, in the referred months.
16
Despite the hard task separating, in a quantitative way, what is affected to offline and online, concerning the sale, the digital channels in Forall Phones have a preponderant role regarding communication, according to José Alves. He believes that the large percentage of people who go to a Forall physical store, to buy or repair their smartphone, is because they are aware of the brand, mainly due to any social media promotional campaign, some Facebook, Instagram or Google ad, or by means of some influencer or shaper. To do this, the brand’s investment in Search Engine Marketing has been essential for ads highlighting in search engines, ensuring that consumers find them when searching for semi-used or refurbished phones. Forall’s SEM strategy was even highlighted as the key to the Black Friday online campaign, in November 2018, being the best month regarding direct website sales and return (including all advertising costs).
Due to the weight that mobile use has in online sales, representing about 70%, the brand also uses Geotargeting that, through the smartphone’s location, can notify the consumer when he/she is close to a physical store, the information being provided by Google and Facebook. Hence, this is also why these synergies between offline and online cannot be split in half, and should not be viewed independently, since one channel influences the other and vice versa. It should be noted that the brand does not distinguish digital marketing from marketing, since almost every used marketing tools are digital marketing tools, and, in José Alves’ words, he believes that “Today, marketing is digital marketing”. The brand has a strong presence on Facebook, Instagram, Youtube and Linkedin. The first three serve primarily to engage with consumers and create awareness, to generate leads, advertising ads and doing cross-sell and up-sell to repeat customers and do remarketing. It is also here that new products, brand news, discounts, and brand-specific campaigns are disseminated through videos or images. Linkedin is essentially to communicate job opportunities and, through Forall Family’s page, promote branded social activities, as well as attract new students to its shapers’ ambassador program. In addition to these channels, the brand also uses heavily e-mail marketing, SMS marketing and Google (through Google shopping, display advertising, paid and organic search). Appendix 21 identifies all the digital marketing tools used, as well as their importance to the business and its function. The brand essentially uses all possible digital channels, with different goals, throughout the conversion funnel. This conversion funnel is the representation of the steps that a potential customer passes from the first contact
17
with Forall (awareness) to the conversion itself (that can be the final purchase or a lead generation).
Despite the importance of the brand's website as an e-commerce channel, its main source of revenue results from physical stores. Between September and December 2018, the sale stores weight was always over 60%. Figure 4 discriminates the number of smartphones sold in stores and through e-commerce, between September and December 2018, not counting sales through Community Shapers. It should be noted that at the end of 2018, gross sales totalled approximately 4.2 million €.
1.5.2. FORALL FAMILY
With 330 active shapers, 280 university students in Portugal and 50 in Spain, Forall Phones want to reach to all universities in Portugal and Spain, investing in direct contact with the consumer (January 2019). The brand is now also working on a pilot project, Forall Schools, with 10 high school shapers.
The community shapers or ambassadors are the links between the consumer and the product they want to purchase: smartphones, accessories, and repairs. Hence, Forall Family is a social network created around the university student, the main target of the brand, with the goal of achieving all Portuguese young people. The shaper’s role is to disseminate the product to his/her network, through word-of-mouth or via social media. The shaper has associated a unique and impersonal promo code that works as a driver of a future sale, through a discount granted to those who use it, who would not have it without being in touch with the shaper. In other words, each ambassador, when promoting
Source: Forall Phones (2018)
18
a Forall product to his/her contacts, will increase the chance to create a future sale through his/her promo. Those who buy a Forall product through a shaper promo code will get a discount on the product they are buying, either on the website or at a Forall Phones physical store, also granting the promo holder a value of 10€. In short, both the shaper and the consumer win, a win-win relationship that has brought revenue to Forall Phones and its consumers. 1100 smartphones were sold only through shapers, representing 143.000 €, in Portugal and Spain (by January 2019).
1.5.3. IMPORTANCE OF THE MARKETING DEPARTMENT AT FORALL
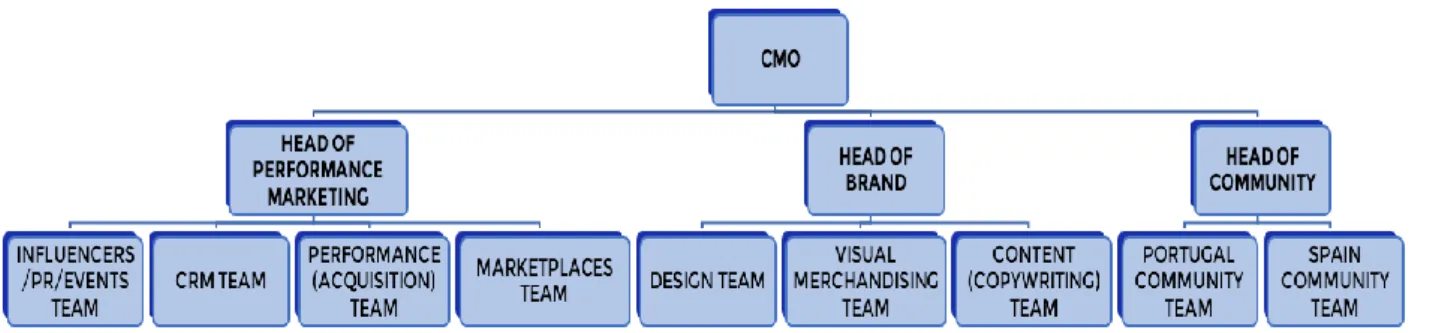
As previously noted, the marketing function performed at Forall Phones is critical to the business. The marketing department is one of the most structured departments of the company, with three distinct areas: performance, brand (including those who are responsible for design, communication, store decoration, etc.) and community (encompassing those who are responsible for the community management). The organization chart, in Figure 5, discriminates all the positions covered in this department. It is important to note that, operationally, Forall Phones’ structure is highly horizontal and there is a lot of involvement of the people of different teams in the marketing strategy definition.
The marketing department is structured and focused on digital. In fact, in terms of communication campaigns, it is noteworthy the successive efforts in digital marketing, with paid ads in search engines and Facebook Ads. This is mainly due to the cost-effectiveness that online marketing offers, compared to traditional advertising, on TV, print or radio. Other identified advantages are related to the real-time feedback that online provides, through platforms such as Google Analytics, which allow taking corrective actions according to the strategy of each advertisement. That is, if an ad is not having the
FIGURE 5. FORALL PHONE’S MARKETING DEPARTMENT CHART
19
desired profitability, through real-time data, it is possible to adjust the strategy and thereby solve the problem. As a matter of fact, almost all of Forall’s marketing efforts are related to online and to the ambassador’s network, mentioned above.
All digital marketing brand’s actions are segmented into three different types of clients. It is through this segmentation that the department channels all its efforts and it is defined all the marketing strategy, varying from the marketing budget division among all actions. The brand subdivides the customers into: prospecting customers (people who are not aware of the brand, not being leads yet, not liking the Facebook or Instagram page, never looked up the brand, never visited its website, etc.); retargeting (people who have interacted with the brand but have not bought its products); buyers (brand consumers). From here, the department splits the budget by each type of client: X% to attract new clients; Y% for people who know the brand but never bought its products; Z% for cross-selling or up-cross-selling (encouraging the purchase of a smartphone accessory, for example) of branded consumers. Through this, it is possible to have a sustainable basis for the entire digital marketing strategy.
The next step is the goal setting. At Forall Phones, the goal is always to increase the profitability, at the sales level, of each action. Therefore, by clearly defining the target audiences, it is possible to delineate how much should desirably be spent on each type of client and, through this, communicate in a targeted manner to each one of them.
The Figure 6, provided by Forall, summarizes the most important online marketing platforms for the brand, with three main goals: to create a long-term relationship with the consumer; to take action by measuring the performance of digital marketing; and to increase the customer lifetime value through brand loyalty fostering.
Source: Forall Phones (2019)
20
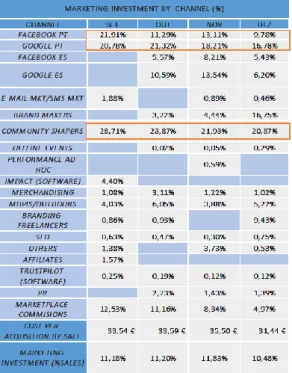
Forall Phones’ finance department monthly defines and updates the marketing budget. According to the CFO, Manuel Castel-Branco, and the Financial Controller, Bernardo Carreiro, responsible for the budgeting definition for each channel, the marketing department is the one that has a more controlled budget level and cannot be compared to other departments. After the purchasing department, marketing is the department with the highest budget and value. This budget is also expected to be increased, since it is defined as a percentage of the firm’s sales, and the sales have been increasing since 2015.
Within the marketing budget, the communication channels where the firm most invests are social media, search engine marketing, brand makers (influencers), and brand shapers. Table 2 illustrates the investment weights in each marketing channel, in the last months of 2018. Google, Facebook, and community shapers represent the three main channels in terms of marketing investment. It is important to note the weight of Mobile in online sales. According to José Alves, most consumers order their mobile phone on their smartphone, at a ratio of 70/30 to the laptop.
The marketing department is of great importance to the business since it provides decision-making inputs. Because of its importance, there are some goals that should be achieved, but José Alves affirms that all the pressure he feels to achieve results is due to his ambitious and result-oriented character, not feeling any extra pressure from either the CEO or other departments.
Source: Forall Phones (2018)
TABLE 2. FORALL PHONE’S MARKETING INVESTMENT BY CHANNEL
21 1.6. DIGITAL MARKETING PERFORMANCE MEASUREMENT
1.6.1. BEST PRACTICES IN DIGITAL MARKETING PERFORMANCE MEASUREMENT
1.6.1.1. THE IMPORTANCE OF MEASUREMENT
In 2016, AdAge published an article that stressed the five Chief Marketing Officer (CMO) today’s priorities, where two of them had a relation to marketing performance measurement. The first was measurement and, as highlighted by the article, for it to be effective, firms should be able to measure the marketing’s impact on business results. The second was the need to better justify marketing investments. An article by Chief
Marketing (2016) has also identified the six trends of marketing for 2017, and three of
them included marketing measurement. In addition, Forbes (2017) emphasized the importance of measuring marketing performance. In Laura Patterson’s words (2017), president and founder of Vision Edge Marketing (VEM), “For today’s marketers, the challenge really isn’t measurement; there is an abundance of metrics. The challenge is measuring marketing’s value and performance”.
The Chief Marketing Officer (CMO) Council found that 80% of the CMOs surveyed were not satisfied with their capability to measure marketing performance (CMO Council, 2009 as cited in Liang, Gao & Ding, 2018).
Despite the rising interest around measuring the effectiveness of marketing activities, few studies were dedicated to what really drives managerial use of marketing and financial metrics (Mintz & Currim, 2013). In a special report conducted by American Marketing Association (AMA) (2015), the results from the CMO Survey in 2014 revealed that only 15% of CMOs were being able to show the impact of social media on business (AMA, 2015). More than six in 10 CMOs affirm that ROI on marketing spending will be the most important measure of their success and demonstrating a ROI for marketing initiatives is considered one of the CMO’s task on the to do list (IBM Global CMO Study, 2018). In fact, an online study of digital marketers developed by Adobe (2013) revealed that 76% of respondents believed measuring marketing performance was important, but only 29% felt that they were doing it well (Lopresti, 2014). Accenture’s Insight Driven Marketing report, a 2001 survey of 175 marketing executives in the United States and the United Kingdom, reveals that 68% reported having difficulty measuring the ROI of their marketing campaigns (Lenskold, 2002).
22
For two decades, VEM has been conducting a Marketing Performance Management (MPM) survey of leaders over a variety of industries. In spite of the focus on data-driven results, VEM’s studies revealed limited progress regarding marketing performance measurement efficiency by companies. In 2016, 10% of 446 firms assessed their marketing organizations as completely ineffective in measuring marketing’s performance, in comparison to 12% who answered completely effective. For example, the VEM’s 2010 annual MPM study found that less than half of over 400 companies were able to establish a clear link, or alignment, between their organizations’ marketing programs and business outcomes. The value of marketing to their senior management teams was even lower, underlining the lack of accountability (VEM, 2010).
One of the problems is that many performance metrics of marketing are subjective, such as attitudes, perceptions, and behaviours of customers. Despite their importance, they are quite hard to measure in an accurate way and their link with financial or business outcomes is weak, making it difficult to demonstrate the value of marketing for managers (Fu, Philips & Philips, 2018). Using large amounts of data is another challenge for marketers. In spite of this, they are actively pursuing it, in order to improve efficiency and make strategic decisions.
One-third of marketing organizations should enhance their ability to use data. Data only has a meaning if it is relevant and can be used to lead to business decisions (VEM, 2017). For example, despite U.S. corporations spending over 300 billion USD$, each year on marketing and sales, the resulting benefit is still difficult to evaluate. Hence, the big challenge for marketers is how to demonstrate value created by marketing programs (Fu
et al., 2018).
1.6.1.2. THE “RIGHT” METRICS
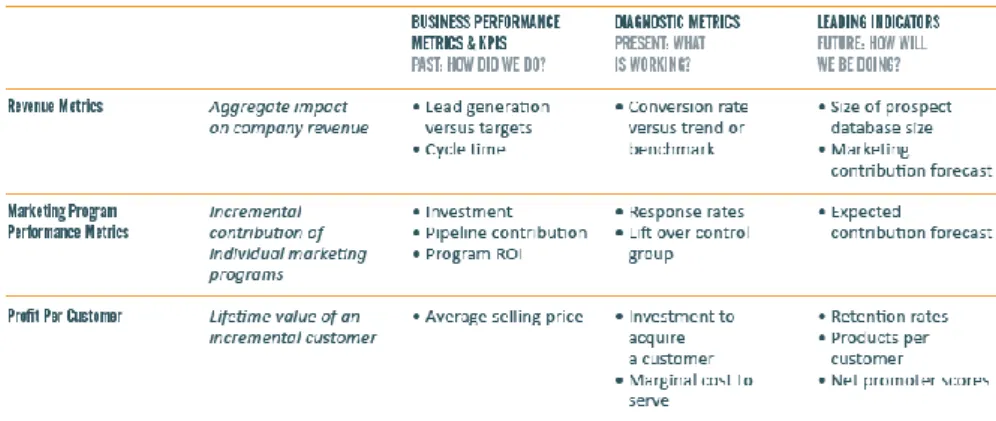
According to Celeste and Moniz (2019), a metric should reveal the strategy firm’s execution, its health, the potential of its markets, the customer dynamics, and should give insight for new strategic directions. One of the first pioneers in the area of MPM and the leader in Marketing Measurement & Performance Management, VEM (2017) provides a measuring framework breaking down the metric in six categories: activity, output-based, operational, outcome-based, leading indicators and predictive, describing the relationship and hierarchy of these marketing metrics. Despite each metric category has its value, their
23
value as performance indicators increases from left to right, and this progression represents increasing maturity (See Figure 7).
For this organization, the key to select marketing metrics for measuring performance is to select those that measure the impact of marketing on the business. That is, those that are critical and provide insights into decision making.
Also, Marketo Company, the leader in Marketing Software & Solutions, an Adobe company that provides solutions for every digital marketing need, released a report (2011) on Marketing Metrics & Analytics, arguing that “CEOs and boards do not care about 99% of the metrics that marketers track – but they do care about revenue and profit growth”. Marketo (2011) defends that soft metrics such as brand awareness, gross rating points, impressions, or organic search rankings are important, but only when they can be linked and have a powerful relationship with hard metrics such as pipeline, revenue or profits. The company points out that marketers often use “wellness” metrics to justify their marketing spend. They choose metrics that sound good and impress people rather than relying on metrics that measure business results and improve profitability. Some common examples include impressions from press releases and Facebook likes.
However, the Marketo Company advises that marketers should track and measure the impact of all marketing activities, whether hard or soft. In the report, the company splits the performance indicators into two groups that directly affect revenues and profits, revenue metrics, and marketing program performance metrics, that can measurably speak the language of CEOs and CFOs. The firsts are metrics that can aggregate the impact of marketing on company revenues. The seconds measure the incremental contribution of each marketing program. The report proposes several errors in the measurement
Source: VEM (2017)
24
performed by marketers, suggesting that the metrics that measure activity, cost, and quantity are not ideal, but rather they all represent interest to CFOs: revenue, margin, profit, cash flow, ROI, shareholder value, that is, metrics that are able to show profit and growth. Marketo suggests a framework for measurement, indicated in Table 3, which represent a summary table of the most indicated financial metrics that companies should support, incorporating time-dependent metrics (past, present, and future). The company also stresses the need for setting goals for each metrics that should be tracked, in order to see if the results are in agreement, above or below expected.
Paul Albright, Marketo’s Chief Revenue Officer, also suggests six rules for success in measurement. He proposes that companies should focus their attention on no more than five metrics and measure success versus goals for the chosen metrics, for every campaign, every channel, every region, and every product. He also advises that marketers should show the trends of each metric evaluated in order to visualize, immediately, if there were improvements. The need to put in a dashboard for the other elements of the organization, in order to prove succinctly what the marketing is trying to achieve is another stressed point in his analysis. He recommends companies to recognise the ones that can achieve their goals and to repeat the process as they can, in a systematic way.
Celeste and Moniz (2019) enumerate in their book, “Marketing Performance – 80 métricas de marketing e vendas”, the main digital marketing metrics that should be used in the marketing strategy definition and in its optimization and operationalization. For these authors, optimizing a campaign or choosing the digital channel that receives most of the investment should be based on facts, data, and metrics. To do this, they present the metrics, divided into categories, allowing the following of the natural flow of digital interaction: acquisition (capture and identification of the flow of visitors), behaviour
Source: Marketo (2011)
25
(indicate different behaviour of consumers), conversion (grouping transaction indicators), and involvement (in order to understand repurchase and recommendation opportunities) (See Figure 8).
Firms can measure thousands of marketing metrics. However, marketers should select the ones that best fit the selected objectives, as well as the nature of the analysis. Appendix 22 and Appendix 23 provide a varied set of metrics. The first is only focused on attitudes, behavioural and branding digital metrics, and the second one explores the world of costs and benefits of digital marketing, giving useful information and speaking the CEO’s and CFO’s language. Both tables were built by cross-referencing information from a variety of different sources and ages (scientific articles, reports, and books), providing a framework that guides marketing professionals. The metrics system is organized by metric purpose, its construction and the way it is measured, as well as the sources each metric was drawn. To emphasize that many indicators are linked to each other, some having a causal link among them.
FIGURE 8. DIGITAL MARKETING METRICS DIVIDED INTO CATEGORIES (ACQUISITION,
BEHAVIOUR, CONVERSION AND INVOLVEMENT)
Source: Celeste & Moniz (2019)
PU RCHA SE IN TEN T
QUANTIFIABLE RETURN OF A SPECIFIC ACTION OR ESTABLISHED OBJECTIVE IN A DIGITAL CAMPAIGN OR SPECIFIC ACTIONS IN THE DIGITAL ECOSYSTEM
NUMBER OF VISITORS WHO ARE INTENDED TO MAKE A PURCHASE BUT DO NOT CONSTITUTE THE PURCHASE
CONVERSION
METRIC MEA N IN G
HIGHER OR LOWER SPEED CONVERSION
CTA - CA LL TO A CTION
TIME LA G A PPLA U SE- LIKES
CON V ERSA TION -COMMEN TS
INVOLVEMENT
INVOLVEMENT BASED ON INTERACTIONS AND ATTENTION ON SOCIAL MEDIA
INVOLVEMENT WITH A PRODUCT OR SERVICE IN THE DIFFERENT DIGITAL CHANNELS (INCLUDING APPS) NUMBER OF LIKES BY POST. IT INDICATES INTEREST BY THE
CONTENT NUMBER OF COMMENTS AND ANSWERS
DIG ITA L EXPERIEN CE AMMOUNT OF DIGITAL EXPERIENCES ON THE WEBSITE
LOY A LTY NUMBER OF TIMES THAT A UNIQUE VISITOR RETURNS TO THE WEBSITE
A /B TESTIN G USED TEST TO SUPPORT THE DECISION BASED ON BEHAVIOURAL RESPONSES
TIME ON SITE TIME ON A SITE AND SESSION
EN TRY PA G E IT IS THE FIRST PAGE OF A SITE VISITED IN A SESSION OR ON A VISIT
EXIT PA G E LAST VIEWED PAGE BY THE VISITOR, ON THE WEBSITE
BOU N CE RA TE REJECTION OR ABANDONMENT OF A WEBSITE
OPEN RA TE EMAIL OPENING ACTION IN A CAMPAIGN THAT SHOWS INTEREST
CTR- CLICK THROU G H RA TE MEASURES THE EMAIL OPENING AND THEIR RESPECTIVE ACTION
BEHAVIOR
METRIC MEA N IN G
RETU RN V ISITORS.N EW V ISITORS NUMBER OF UNIQUE VISITORS RETURNING TO THE SITE AT DIFFERENT MOMENTS.
LOYALTY, ACQUISITION AND ATTRACTION METRIC
ACQUISITION
U N IQU E V ISITORS
F OLLOW ERS.F A N S
F OLLOW ERS G ROW TH RA TE
IMPRESSION S A N D REA CH
NUMBER OF SINGLE VISITORS ON A SITE IN A CERTAIN TIME PERIOD
FANS AND / OR FOLLOWERS OF A SOCIAL NETWORK EVALUATION OF THE GROWTH AND IMPACT OF THE BRAND, PRODUCT, SERVICE OR PERSON IN SOCIAL MEDIA
NUMBER OF TIMES THAT A CONTENT IS PRESENTED
METRIC MEA N IN G
CPA - COST PER A CTION
CPC- COST PER CLICK
CPL- COST PER LEA D
RA CE MODEL
MEA N IN G
SOV - SHA RE OF V OICE ( SOV )
N ETW ORK V A LU E
V A LU E OF " LIKE"
SEN TIMEN T
NUMBER OF SHARES FROM A SITE BRAND MENTIONS IN THE DIGITAL ECOSYSTEM,
COMPARING WITH COMPETITORS MEASURES THE POTENTIAL, IN A NETWORK COMMUNITY,
OF ITS ELEMENTS INTERACTING WITH THEMSELVES
A MPLIF ICA TION - SHA RE
METRIC
EN G A G EMEN T
A TTRITION
MEASURES THE "LIKE" RETURN ON SOCIAL MEDIA THE SENTIMENT EXPRESSED ON POSTS AND INTERACTIONS
SYSTEMATIZATION AND METRICS CLASSIFICATION MODEL INVESTMENT MADE BY THE ANNOUNCER IN ORDER TO LEAD THE VISITOR TO AN ACTION IN AN ADVERTISEMENT INVESTMENT MADE BY AN ADVERTISER ALWAYS THAT A
VISITOR CLICKS IN AN AD
VALUE THAT THE ADVERTISER IS WILLING TO PAY FOR EACH LEAD RECEIVED