www.scielo.br/rbg
BRAZILIAN SEISMICITY: ONLINE NEWS AND SOCIAL MEDIA THAT HELP US
George Sand França
1, Susanne T. R. Maciel
2, Eveline Alves Sayão
1, Aline Lopes Lacerda
1,
Larisse Ferreira da Silva
1, Monique dos Santos Costa
1and Juliana Garrido Damaceno
1,3ABSTRACT.Historically, the earthquake studies was based on reports and records of newspapers, which referred to the estimation of the measure of the intensity of events. The advance of seismological instrumentation improved the calculation of magnitudes of earthquakes, which became a priority measure, to the detriment of intensity estimates. With the growth of access to information and communication technologies, the volume of relevant information for intensity estimation has become feasible and representative. We present the Brazilian Macroseismic Intensity Map between the years of 2006 to 2017, based on records of digital newspapers and blogs, and compare with the map of magnitudes recorded by the Seismological Observatory, Universidade de Brasília, in the same period. The Brazilian Macroseismic Intensity Map contributes to the improvement of the Seismic Hazard Map. The results show the importance of preserving the information of seismic events published in digital media.
Keywords: macroseism, seismicity, intensity, digital newspapers, Brazilian Macroseismic Intensity Map.
RESUMO.Historicamente, o estudo de terremotos era feito a partir de relatos e registros de jornais, que referenciavam a estimativa da medida da intensidade dos eventos. O avanço da instrumentação sismológica aprimorou o cálculo das magnitudes dos terremotos, que tornou-se uma medida priorizada, em detrimento das estimativas de intensidade. Com o crescimento do acesso à informação e às tecnologias da comunicação, o volume de informações pertinentes para a estimativa da intensidade tornou-se viável e representativo. Apresentamos o Mapa Brasileiro de Intensidade Macrossísmica entre os anos de 2006 a 2017, baseado em registros de jornais digitais e blogs, e comparamos com o mapa de magnitudes registradas pelo Observatório Sismológico de Brasília no mesmo período. O Mapa Brasileiro de Intensidade Macrossísmica contribui para a melhora o Mapa de Risco Sísmico. Os resultados indicam a importância de preservar a informação de eventos sísmicos publicados em mídias digitais.
Palavras-chave: macrossismo, sismicidade, intensidade, jornais digitais, Mapa Brasileiro de Intensidade Macrossísmica.
1Universidade de Brasília, Observatório Sismológico, Campus Darcy Ribeiro, SG 13, Asa Norte, Brasília, DF, Brazil – E-mails: georgesand@unb.br, sayaoeveline@gmail.com, aline.geof@gmail.com, larisse_fs@hotmail.com, moniquedsscosta@gmail.com, julianagdamaceno@gmail.com
2Universidade de Brasília, Faculdade UnB Planaltina, Vila Nossa Senhora de Fátima, Cidade Universitária 01, Planaltina, DF, Brazil – E-mail: susanne.maciel@gmail.com 3Istituto Nazionale di Geofisica e Vulcanologia (INGV), Via di Vigna Murata 605, 00143 Rome, Italy 2-Unisalento, Via per Monteroni, 73100 Lecce, Italy
386
BRAZILIAN SEISMICITY BY ALL ONLINE INFORMATIONINTRODUCTION
The rapid development of information and communication technology since the mid-90s and the willingness to invest in initiatives to disseminate information, allow us to have a wealth of information about seismicity in short to long-term over the internet. This information is interpreted by the study of macroseismic, which are, by definition, characterized as the description and measurement of seismic effects experienced by people through an intensity scale.
Brazil is located in a stable continental intraplate region, presenting seismic activity lower than the plate edges (Assumpção et al., 2014). The occurrence of intraplate earthquakes of low to medium magnitude is common, and they are caused by the accumulation of stress generated from the movement of tectonic plates. Brazil can be considered relatively an aseismic country, however with the increase of the seismographic networks in Brazil (Rocha et al., 2015), it was possible to study the Brazilian seismic activity. One of the most active regions of Brazil is the northeast, in the states of Ceará, Rio Grande do Norte and Pernambuco (Berrocal et al., 1984; França, 2006).
In 2014, there was an expansion of the Brazilian Seismograph Network (RSBR), especially in relation to the midwest and north of the country, before characterized by low density of seismograph stations caused by a large expanse of area, difficult of access and logistics, and lack of necessary equipment (Rocha et al., 2015). Under these conditions there was great difficulty in registering low magnitude events, making the process of macroseismics reports also an important tool for the registration of Brazilian historical seismicity.
The main survey of Brazilian seismicity was carried out through journalistic information (Berrocal et al., 1984). This survey showed seismicity of Brazil from 1560 to 1984. Currently, no organization keeps this information stored, either in the previous form with newspaper clippings or stored in digital form. In November 2006, this information was digitally initiated by the Seismological Observatory, so this work aims to record and classify the macroseismic data through the journalistic material and thus contribute to the construction of the Maximum intensity map of Brazil.
METHODOLOGY
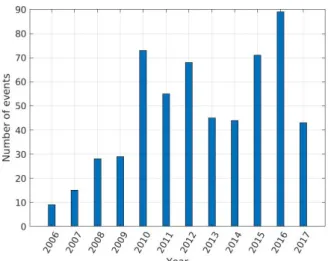
The data were collected from the disclosure of news in online newspapers, blogs, and population reports on social media like Twitter and Facebook, during the period from January 2006 to
December 2017, totalizing 569 analyzed events, averaging 4.31 notifications per month (Fig. 1). The events were reported by the assignment of keywords related to seismic activity, from tools like Google Alert. Then, this data were selected and put into a spreadsheet, which were classified as Natural events and Others (Distant, Artificial or Dam-triggered). Furthermore, the date, the time (UTC), the epicenter coordinates and the magnitude of the event were informed, as well as which vehicles of information were responsible for the notifications and the basic information about the population reports and the material damage in the regions of influence. From these reports it was possible to estimate the maximum intensity of each event, based on the Modified Mercalli Scale (MM). During the analysis, it was noted the recurring presence of earthquakes with an epicenter in the Andean region, felt by the Brazilian population and these events were named Distant.
Figure 1 – Histogram of the number of events per year, from January 2006 to
December 2017.
RESULTS
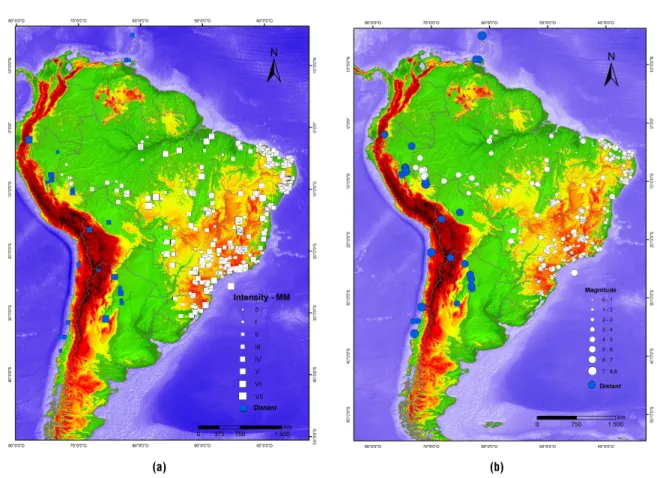
From the collected information it was possible to generate a macroseismic map (Maximum intensity map) for each event (Fig. 2a). By comparison and complementation, it was used a magnitude map, provided by the Seismological Observatory (SIS) from the Universidade de Brasília (UnB) (Fig. 2b). From the maps, it is possible to see the majority concentration of reported events in the northeast and Southeast Brazilian regions.
Figure 3a shows a higher incidence of events with intensity Modified Mercalli III and magnitude 3, and includes all cataloged events. Figure 3b relates only Natural events, noting that lower magnitudes are difficult to be accurately determined. The catalog offers data in different magnitudes types (MW, mR, mb, MS
(a) (b)
Figure 2 – (a) Map of macroseismic with maximum intensity from 2006 to 2017; (b) map of macroseismic with regional magnitude (mR) on the same period.
(a) (b)
Figure 3 – (a) Histogram of the number of earthquakes by the magnitude and maximum intensity. Values are less than zero or have not been determined; (b) histogram
of the number of earthquakes by magnitude.
and ML) for the same event, and we choose to follow only
one magnitude. For magnitudes above 6, we used the moment magnitude (Mw), which is the best representation of the energy
liberated from the earthquake; for events in Brazil, we used the regional magnitude (mR) (Assumpção, 1983). Unusually these
388
BRAZILIAN SEISMICITY BY ALL ONLINE INFORMATIONmagnitude (MS), local magnitude (ML) or body magnitude (mb).
From 2006 to 2017 there were 426 Natural events, 43 Artificial events, 5 Dam-triggered, 28 Distant events, and 27 Uncertain events.
Figure 4 – Histogram showing the number of events per Brazilian state. Events
are classified as Natural and Others (explosions, artificial tremors, etc.).
The events classified as Distant are also Natural, but they are from regions with epicentral distance above 1500 km. In this case, 27 events were recorded as Distant, and the vast majority in the region of the Andes, where seismic activity is marked by subduction between Nazca and South America plates (Bilek, 2010). The average of the magnitude is 6.4 mb, considered high
by Brazilian standards, while the average of the intensities was III, considered low. It happens because, in most cases, the effects felt in Brazil occur in high places, such as in buildings due to the amplification of seismic waves, as in the case of São Paulo, in September 2015. In contrast, the main intensities felt occurred in the Brazilian regions of extreme west, mainly located in the northern region, as happened in the states of Acre, Rondônia, and Amazonas in November 2015.
Artificial events, exemplified by mining explosions, construction of roads and building structures, totaled 42 cases in the catalog. The average of magnitudes, 2.0 mR, and intensities,
III, of earthquakes, can easily be mistaken with events classified as Natural. For events classified as Others, there were 67 cases reported by the population which, however, there was no confirmation of natural earthquakes or local explosions. The average of seismic intensity was III, revealing that the effects on civil constructions, such as cracks and dangling objects, are the main effects reported by the population. Figure 4 shows that three states felt more earthquakes, Ceará (CE), Rio Grande do Norte (RN) and Minas Gerais (MG) and following by Pernambuco (PE) and São Paulo (SP). Most of the earthquakes occurred in the
city of Monte Claros (MG), Pedra Preta (RN), Sobral (CE), and Caruaru (PE), confirming the several exams seismic in this days.
DISCUSSIONS AND CONCLUSIONS
Throughout the analysis of the data, it was observed the encumbrance in determining the intensity of events. Intensity is a qualitative measure, based on population reports about the event, and the level of damages caused by the earthquake. This brings us to a problem because, albeit Modified Mercalli intensity is the most widely used worldwide to determine the seismic intensity, it was originally created based on European countries. It means that it is not the same thing to compare, for example, the structure of European civil buildings to the Brazilian ones. Before that, we should analyze how each individual reacts before an earthquake situation. As in Brazil the occurrence of tremors is considerably low compared to countries located in high seismic activity areas, the population is not adapted to the phenomenon itself and its effects on space. This type of reaction is noted when Distant events (teleseisms) are felt in high buildings, mainly in southeastern Brazil. Thus, a possible proposal is to create a new intensity scale, less subjective and aiming at the Brazilian territory as something to be taken into account. Furthermore, we are faced with the need to create a standardized form, in order to make the classification process of seismic intensity more reliable and less subjective.
ACKNOWLEDGMENTS
The authors would like to thank, GSF thanks CNPq for the PQ as well as FAPDF and CAPES for the financial support to the students. The authors would also like to thank to Gabriel B. França for the wonderful discussions to improve this article.
REFERENCES
ASSUMPÇÃO M. 1983. A regional magnitude scale for Brazil. Bull. Seismol. Soc. Am., 73: 237–246.
ASSUMPÇÃO MS, FERREIRA J, BARROS LV, BEZERRA H, FRANÇA GS, BARBOSA JR, MENEZES E, RIBOTTA LC, PRICHINER M, NASCIMENTO A & DOURADO JC. 2014. Intraplate seismicity in Brazil. In: TALWANI P (Ed.). Intraplate seismicity. chapter 3, p. 50–71. Cambridge University Press. doi: 10.1017/CBO9781139628921.004.
BERROCAL J, ASSUMPÇÃO MS, ANTEZANA R, DIAS NETO CM, ORTEGA R, FRANCA H & VELOSO JAV. 1984. Sismicidade do Brasil. São Paulo, Brasil: Instituto Astronômico e Geofísico, USP. 320 pp.
BILEK SL. 2010. Seismicity along the South American subduction zone: Large earthquakes, tsunamis, and subduction zone complexity. Tectonophysics, 495: 2–14. Invited review paper.
FRANÇA GS. 2006. Brazil Seismicity. Bulletin of the International Institute of Seismology and Earthquake Engineering, 40: 23–36.
ROCHA MP, ASSUMPÇÃO M, CARVALHO J, BARBOSA J, FRANÇA G, BIANCHI M, BARROS L, AZEVEDO PA & COLLACO B. 2015. Intensificação do monitoramento sismológico nas Regiões Centro-Oeste e Norte do país pela implantação da Rede Sismográfica Brasileira (RSBR). In: XV Simpósio Nacional de Estudos Tectônicos, 2015, Vitória - ES, Brazil: SBG.
Recebido em 25 setembro, 2018 / Aceito em 9 novembro, 2018 Received on September 25, 2018 / Accepted on November 9, 2018