IOP Conference Series: Materials Science and Engineering
PAPER • OPEN ACCESS
Pedestrian Environment Quality Assessment in Portuguese
Medium-Sized Cities
To cite this article: Adriana Sousa et al 2019 IOP Conf. Ser.: Mater. Sci. Eng. 471 062033
View the article online for updates and enhancements.
Content from this work may be used under the terms of theCreative Commons Attribution 3.0 licence. Any further distribution of this work must maintain attribution to the author(s) and the title of the work, journal citation and DOI.
Published under licence by IOP Publishing Ltd
WMCAUS 2018
IOP Conf. Series: Materials Science and Engineering 471 (2019) 062033
IOP Publishing doi:10.1088/1757-899X/471/6/062033
1
Pedestrian Environment Quality Assessment in Portuguese
Medium-Sized Cities
Adriana Sousa 1, Bertha Santos 2, Jorge Goncalves 3
1 Calçada Fonte do Lameiro, Department of Civil Engineering and Architecture, University of Beira Interior, 6200-358 Covilhã, Portugal
2 CERIS-CESUR and Calçada Fonte do Lameiro, Department of Civil Engineering and Architecture, University of Beira Interior, 6200-358 Covilhã, Portugal
3 CITTA and Calçada Fonte do Lameiro, Department of Civil Engineering and Architecture, University of Beira Interior, 6200-358 Covilhã, Portugal
Abstract. The features of pedestrian spaces contribute to sustainable urban mobility and
consequently to improve the quality of the built environment. A pedestrian space free of obstacles, with slight slopes, continuous, agreeable, attractive and safe, is definitely a space that invites to enjoyment and socialization. With the aim of improving the pedestrian circulation conditions, the present paper describes a set of approaches for assessing the quality of pedestrian environment and presents an adapted approach that can be used in medium-sized cities. Land use, pedestrian facilities and road/traffic attributes are the most common topics addressed in the pedestrian environment evaluation. These attributes can be expressed in scores and their spatial distribution can be represented using Geographical Information Systems (GIS), supporting the decision making process of pedestrian system improvement. For Portuguese medium-sized cities, the Pedestrian Environmental Quality Index (PEQI) was adapted and tested through a case study in Covilhã city. The main steps of the methodology include the definition of relevant data, preparation of survey forms, training of data collection teams, data collection, database organization, PEQI calculation and GIS data visualization, management and maps production. The case study focused on the areas that have a significant pedestrian flow, either because of commercial, services and recreation activities, or because they are important links of the public transport system. As main findings, it was possible to conclude that the selected approach allows a great flexibility in the incorporation of new attributes and weights according to specific technical goals and scenarios (calibration).
1. Introduction
With the constant development of today's society, there is a wide variety of means to travel ranging from motor vehicles to non-motorized vehicles and pedestrian. With regard to road traffic, its increase impairs the quality of life in urban areas, due to released emissions, noise or accidents. It is therefore necessary to ensure harmony between different networks and transportation modes by applying the concept of sustainable mobility, which promotes public and smooth transport modes.
According to [1] and [2], walking is a highly sustainable transport mode for the following reasons: • All trips include at least one small journey made on foot, so some improvements in pedestrian
infrastructures can/should be included in the budget of planned interventions on other transport networks.
WMCAUS 2018
IOP Conf. Series: Materials Science and Engineering 471 (2019) 062033
IOP Publishing doi:10.1088/1757-899X/471/6/062033
2
• Non-motorized modes can achieve transport planning objectives including reduced traffic and parking congestion, energy consumption and pollution emissions. They can also help achieve land use planning objectives, such as urban redevelopment and more compact “smart growth” development.
• It is an economic way to travel since it does not require investment in another transport mode or fuel.
• Promotes additional social and economic benefits such as exercise that makes people healthier through leisure activities.
Thus, environments that allow and encourage people to walk contribute to healthier lifestyles, safer streets, social equity and environmental quality.
In order to evaluate and sustain interventions in the pedestrian environment, several approaches as the Pedestrian Environmental Data Scan (PEDS) [3], the Pedestrian Safety Index (PSI) [4], the Pedestrian Environment Quality Index (PEQI) [5] and the off-street Pedestrian Level of Service (HCM) [6] have been used. In general, these approaches are translated into an index that allows a global evaluation (scoring) of the environment and conditions offered to pedestrians, or into the preparation and update of pedestrian environment databases. For these purposes, it is usually necessary to gather a set of indicators that allow assessing the physical safety of pedestrians, the existing pedestrian infrastructure and land use, and the aesthetic and security aspects. In some approaches, a subjective evaluation component with questions of personal opinion is also considered.
2. Evaluation of existing tools
Three pedestrian environment audit tools (PEDS, PSI and PEQI) were reviewed to determine which are the most common indicators used in assessing the quality of pedestrian environment and which are the most suitable for the existing pedestrian conditions in Portuguese medium-sized cities.
One of them, the Pedestrian Environment Data Scan (PEDS), was developed with the objective of collecting, in an organized way, a set of data related to the natural and constructed environment. This approach that allows assessing segments of the pedestrian network and footpaths in the United States of America, was adapted from the Systematic Pedestrian and Cycling Environment Scan (SPACES) developed for Australia. The PEDS form has 35 indicators divided into 4 sections, namely: environment, pedestrian infrastructures, road attributes and cycling and pedestrian environment. It also has a section with four subjective questions to evaluate the pedestrian environment as a whole [3, 7].
Another audit tool, the Pedestrian Safety Index (PSI), assesses the basic needs of the pedestrian’s security along their route, allowing the identification of existing problems and improvements to be made [4]. In the calculation of the PSI, 24 indicators are considered, and its overall value is computed applying expression (1).
𝑃𝑆𝐼 = ∑ 𝑐 𝑆𝐼 (1)
In the expression, PSI is the Pedestrian Safety Index, i is the indicator number, c is the coefficient of the safety indicator and SI is the Safety Indicator score.
The c coefficient reflects the importance of each indicator and is defined according to the depth degree of the evaluation presented by indicator i and the number of authors that evaluate indicator i with a certain depth. Three categories were considered to classify the indicator’s depth degree of evaluation. Regarding the score of the Safety Indicator (SIi), it is calculated by comparing the safety standards
defined by the authors, for different road hierarchies, with the existing conditions of the street. The SIi
is translated by a number between 0 (zero) and 1, in which a higher compliance of the standards corresponds to value 1 and the non-adjustment results in 0. The value of PSI (in percentage) is given by expression (2) and the five considered classes, as well as their interpretations, are presented in Table 1.
WMCAUS 2018
IOP Conf. Series: Materials Science and Engineering 471 (2019) 062033
IOP Publishing doi:10.1088/1757-899X/471/6/062033
3 Table 1. PSI interpretation [4]
PSI% rating Model score Interpretation
A 80 – 100 Highest quality (very pleasant), many important pedestrian safety facilities present B 60 – 79 High quality (acceptable), some important pedestrian safety facilities present C 40 – 59 Average quality (rarely acceptable), pedestrian safety facilities present but possibility of improvement D 20 – 39 Low quality (uncomfortable), minimal pedestrian safety facilities E 0 – 19 Lowest quality (unpleasant)
The Pedestrian Environment Quality Index (PEQI) was developed by the San Francisco Department of Public Health and allows the pedestrian environment quality evaluation, as well to obtain information about its intervention needs [5, 8]. It consists of two data collection forms, one for intersections and another for street segments. The intersection form consists of a section with 10 indicators and the street segment form incorporates 27 indicators divided into 5 sections: Vehicle Traffic, Sidewalks, Land Use, Safety and Aesthetic Qualities and Perceived Walkability. To each indicator, a weight factor is assigned, according to the existing pedestrian conditions. The worse these conditions are, the lower its weight in the PEQI score calculation is. The sum of weights assigned to an intersection or street segment gives the PEQI score (Table 2). The score is then adjusted to a range between 0-100 using expression (3), allowing the identification of pedestrian circulation existing conditions according to the classes presented in Table 3.
𝑃𝐸𝑄𝐼 =( )
( ) × 100 (3)
Table 2. PEQI Intersection and Street Segment Formulas Intersection formula
Step 1
With Traffic Signal:
(pedestrian signals + no turn on red + crossing speed + scramble)
No Traffic Signal: (stop signs * 2)
Step 2
Add above to:
(crosswalks + ladder crosswalks + curb cuts + Traffic Calming Features (TCF) count + + additional pedestrian signs)
Segment formula
(number lanes + two way + speed limit + TCF count + sidewalk width + surface + obstructions + curb + curb cuts + trees + planters + seating + buffers + retail
+ public art + graffiti + litter + ped-scale lights + construction + abandoned buildings + bike racks + vacant lots + attractive + feels safe + strong odors + noisy + walkable)
Table 3. PEQI score interpretation [8]
Score Interpretation
0 – 20 Environment not suitable for pedestrians 21 – 40 Poor pedestrian conditions exist
41 – 60 Basic pedestrian conditions exist 61 – 80 Reasonable pedestrian conditions exist 81 – 100 Ideal pedestrian conditions exist
WMCAUS 2018
IOP Conf. Series: Materials Science and Engineering 471 (2019) 062033
IOP Publishing doi:10.1088/1757-899X/471/6/062033
4
All the methodologies presented have been developed with the same purpose, to collect information about the pedestrian environment allowing its evaluation and assessment to make improvements aiming at more comfortable and safer conditions for pedestrians.
Nevertheless, there are some differences between the approaches presented. In the case of PEDS, its main disadvantage, compared to the other approaches, is that the collected data are not aggregated into a single index that can represent a global assessment of the pedestrian environment. On the other hand, PEDS and PSI only consider collecting information on street segments while PEQI incorporates two forms to separately assess the pedestrian environment at intersections and street segments.
One of the main advantages of using the PEQI index, is the possibility to easily incorporate new specific indicators present in the evaluated area, as well as to redefine the original indicator’s weights.
While PSI mostly focuses on pedestrian’s safety, PEDS and PEQI assess the pedestrian environment more broadly, including the perception of pedestrians about the surrounding environment incorporating general issues and personal opinions in its forms.
3. Development of a Portuguese Index for medium-sized cities
Having in account the characteristics and advantages presented in section 2, the index PEQI was the framework used to generate a tool for Portuguese medium-sized cities.
3.1. Method
A study of indicators considered in the evaluation of pedestrian environments for the 3 approaches described, as well as the set of indicators proposed for PEQI adapted to medium-sized Portuguese cities (PEQI PT), was made and is presented in Tables 4 and 5.
In order to adapt the original PEQI form to the Portuguese pedestrian reality, the following changes were considered:
• In the intersections form, the indicator "No turn on red signals / Signs" was changed to "Yellow at the turning (for vehicles)".
• In the street segments form, indicators "Grade", "Slope" and "Sidewalk coating material" have been added to the "Sidewalks" section. Its incorporation relates with the variety of terrain forms that can be found in Portuguese cities, which clearly influence the experience of using the built pedestrian systems.
• In the street segments form, indicators "Construction sites" and "Abandoned/boarded up buildings" were grouped into a single indicator in the section "Safety and Aesthetic Qualities", given the similar negative effect they cause on the pedestrians.
• Increase in the weight of indicators related to the built pedestrian environment of street segment. The indicator’s weights present in the street segments form were redefined in order to increase the contribution of the "Sidewalks" section and the "Traffic Calming Measures" indicator in the score. This decision was based on the assumption that a well-built pedestrian environment favours good safety conditions, including spaces shared by car and pedestrian traffic, and positively promotes the aesthetic aspects and the pedestrianization degree perceived by users.
As far as inclinations are concerned, the proposed approach considers grades and slopes of the sidewalks with the same weight. This is justified because "Transversal slopes" significantly influences the easiness of pedestrian’s movement, and in the case of "Longitudinal grades" because in Portugal there is a significant amount of urban areas placed on non-levelled terrain, which increases its relevance and justifies its inclusion. Regarding the indicator "Sidewalk coating material", a greater weight was attributed to concrete pavement or blocks of concrete, since this material presents better behaviour, ensuring anti-slip sidewalk conditions, maintaining surface texture even in rainy weather. In addition to the changes presented above, other changes were made to clarify observers about witch answers best express the reality.
WMCAUS 2018
IOP Conf. Series: Materials Science and Engineering 471 (2019) 062033
IOP Publishing doi:10.1088/1757-899X/471/6/062033
5
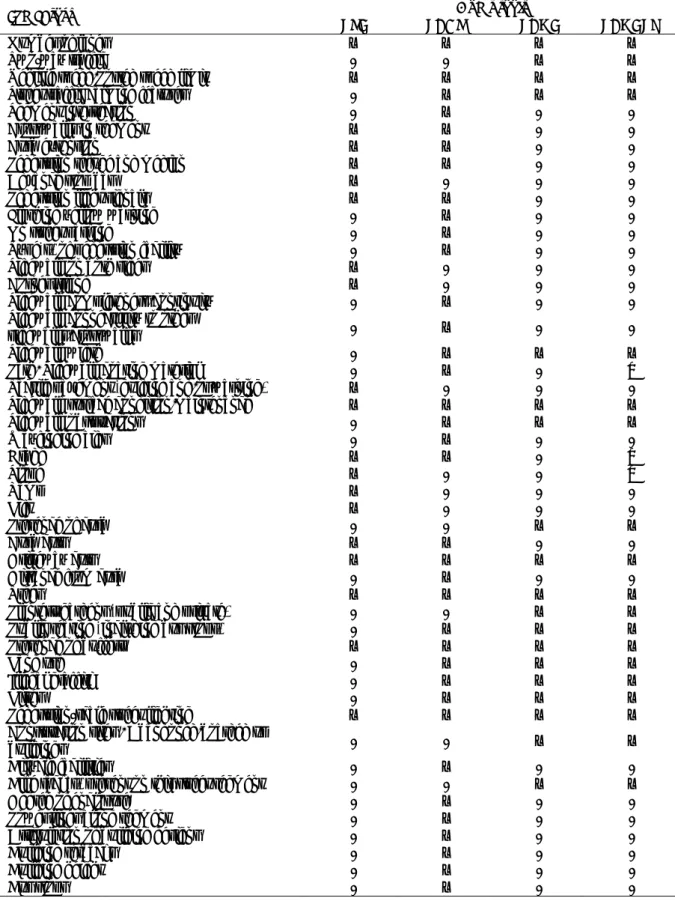
Table 4. Indicators considered in the different audits tools for segments analysis
Indicators PSI PEDSAudit tools PEQI PEQI PT
Number of lanes x x x x
Two-way traffic - - x x
Vehicle speed/Posted speed limit x x x x
Street traffic calming features - x x x
Segment intersection - x - -
Crosswalks in segment x x - -
Curb extension x x - -
Pedestrian refuge and median x x - -
Advance stop bar x - - -
Pedestrian light signals x x - -
Flashing yellow warning - x - -
On street parking - x - -
Type(s) of pedestrian facility - x - -
Sidewalk on both sides x - - -
Corner island x - - -
Sidewalk completeness/continuity - x - -
Sidewalk connectivity to other
sidewalks/crosswalks - x - -
Sidewalk width - x x x
Path/ Sidewalk coating material - x - x
Tactile pavement (guiding and/or warning) x - - - Sidewalk surface condition/maintenance x x x x
Sidewalk obstructions - x x x Wayfinding aids - x - - Grade x x - x Slope x - - x Ramp x - - - Lift x - - - Presence of curb - - x x Curb cuts x x - - Driveway cuts x x x x
Distance from curb - x - -
Trees x x x x
Planters/gardens (public and private) - - x x Public seating (including bus stops) - x x x
Presence of buffers x x x x
Land use - x x x
Illegal graffiti - x x x
Litter - x x x
Pedestrian-scale street lighting x x x x
Construction sites / Abandoned/boarded up
buildings - - x x
Bicycle facilities - x - -
Bike rack(s) present on this street segment - - x x
Degree of enclosure - x - -
Power lines along segment - x - -
Articulation of building designs - x - -
Building setbacks - x - -
Building height - x - -
WMCAUS 2018
IOP Conf. Series: Materials Science and Engineering 471 (2019) 062033
IOP Publishing doi:10.1088/1757-899X/471/6/062033
6
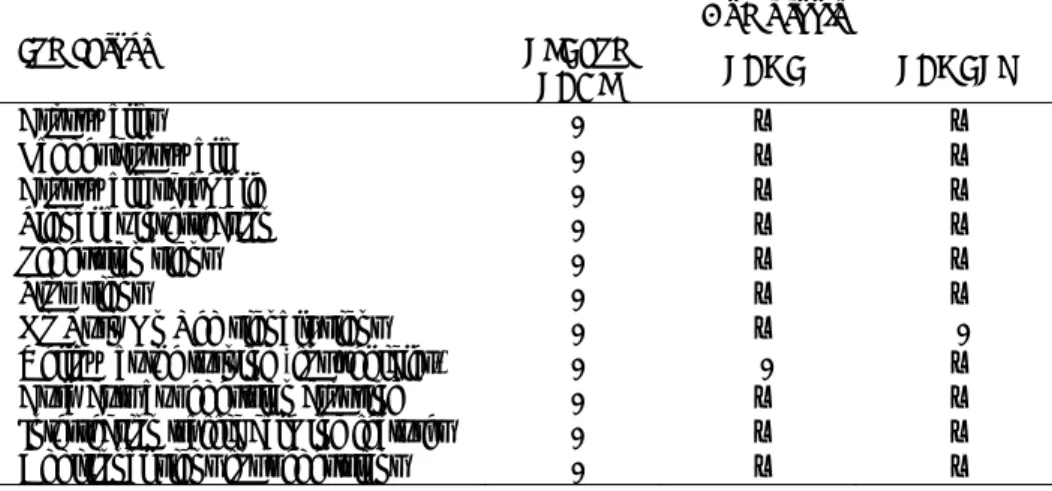
Table 5. Indicators considered in audits tools for intersections analysis Indicators
Audit tools PSI and
PEDS PEQI PEQI PT
Crosswalks - x x Ladder crosswalk - x x Crosswalk scramble - x x Signal at intersection - x x Pedestrian signs - x x Stop signs - x x
No Turn On Red signals/signs - x - Yellow at the turning (for vehicles) - - x Curb cuts at pedestrian crossing - x x Intersection traffic calming features - x x Additional signs for pedestrians - x x
Having in account these changes, PEQI forms adapted to the Portuguese medium-sized cities reality were prepared and weights were assigned to each indicator option in the proposed street segment form. Table 6 presents the proposed weights for the five form sections. The indicator’s weight of the proposed intersection form and the score distribution were kept equal to those of the original PEQI form.
Table 6. Form section weights of PEQI PT score for street segments
Sections PEQI PT minimum score
weight (%) PEQI PT maximum score weight (%)
Vehicle traffic 13 17
Sidewalks 39 42
Land use 10 6
Safety and aesthetic
qualities 24 16
Perceived Walkability 14 19
3.2. Application
The main methodological steps undertaken included the delimitation of the study area, the definition of relevant data, preparation of survey forms, training of data collection teams, data collection, database organization, PEQI calculation and GIS data visualization, map production and result interpretation.
3.2.1. Study area. A case study was developed in Covilhã city, in the central region of Portugal, on the
eastern slope of Serra da Estrela at an altitude around 650m. The municipality has an area of more than 550 km2 and an estimated population of 51797 inhabitants (2011 Census). The study area was carried out in the parish of “Covilhã and Canhoso”, which presents a significant pedestrian flow and the major commercial, services and recreation areas. In total, 74 intersections and 27,4 kilometres of street segments were evaluated.
3.2.2. Collection and processing of data. First, in order to prepare the database for assessing the quality
of the pedestrian environment, the Covilhã road network was treated in ArcGIS® software. To implement a useful GIS project a careful planning of relevant data collection was undertaken involving the following phases:
• Identification of each street segment and intersection with its own unique numerical identifier code (ID).
• Determination of the number of intersections and street segment forms required. In the case of street segments, it was decided to evaluate each side of the street separately and as such two forms were required for each segment.
WMCAUS 2018
IOP Conf. Series: Materials Science and Engineering 471 (2019) 062033
IOP Publishing doi:10.1088/1757-899X/471/6/062033
7
• Training of the observers involved in data collecting through a theoretical exposition and pilot survey.
The data collection performed involved two teams of two elements that assessed a total of 74 intersections and the two sides of 126 street segments. The collected data was inserted into a Microsoft Excel® spreadsheet to create the alphanumeric database and automate the PEQI PT index calculation. Finally, the data was organized to be added to the geographical component of the road network in an ArcGIS® project.
3.2.3. Results
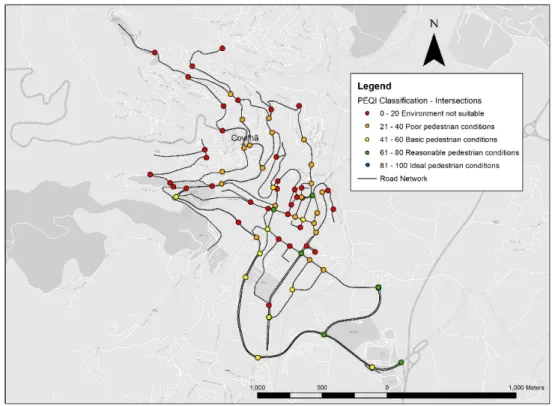
Of the 74 intersections considered for evaluation, 41 were stop-controlled intersections, 16 roundabouts and 17 signalized intersections. Skewed intersections were not present in the study area. Most of the analysed intersections had three legs (53) and were stop-controlled (36) or signalized intersections (12). Figure 1 shows the thematic map output with the achieved PEQI PT scores for the analysed intersections.
Figure 1. Intersection PEQI PT scores [9]
Data were collected from both sides of 126 segments (252 forms): 105 segments of major collector streets (10,6 km), 65 segments of minor collector streets (9,4 km) and 82 segments of access streets (7,3 km). Figure 2 shows the PEQI PT score thematic map obtained for the analysed street segments.
The maximum score obtained for intersections was in a roundabout with a score of 71. Six intersections obtained the minimum score of 0 (zero), of which 3 were signalized and 3 were stop-controlled intersections. Figure 3 shows the frequency distribution of scores obtained for intersections and street segments, divided by the five PEQI PT classification classes.
3.2.4. Discussion of results. In general, the results obtained for intersections are not satisfactory, since
approximately half of the evaluated intersections presented an environment not suitable for pedestrians with a PEQI PT score between 0 and 20, due to the lack of pedestrian crosswalks. It can also be verified that six of the most recently constructed roundabouts present the highest scores, revealing reasonable pedestrian conditions.
WMCAUS 2018
IOP Conf. Series: Materials Science and Engineering 471 (2019) 062033
IOP Publishing doi:10.1088/1757-899X/471/6/062033
8
From the results obtained for street segments, the minimum score verified was 20 (environment not suitable for pedestrians) and the maximum score was 75 (reasonable pedestrian conditions). From Figure 3, it can be concluded that most of the street segments present basic pedestrian conditions. Only one segment had the minimum score (0-20) and no segment reached the maximum score (81-100).
Through the maps produced in ArcGIS® software, it was possible to verify that the intersections and street segments presenting higher scores are located in the most recent zone of the city.
Figure 2. Street segments PEQI PT score [9]
Figure 3. Distribution of PEQI PT scores for intersections (on the left) and street segments (on the right) [9]
3.3. Limitations and recommended improvements
Several challenges were encountered during the development of the PEQI index for Portuguese medium-sized cities. One of them was including relevant indicators for the Portuguese reality. New factors were
WMCAUS 2018
IOP Conf. Series: Materials Science and Engineering 471 (2019) 062033
IOP Publishing doi:10.1088/1757-899X/471/6/062033
9
identified and incorporated during the PEQI adaptation process: grade, slope and sidewalk coating material. Concerning grade, it is considered that its weight should be rethought and redefined supported in a more extensive literature review. According to the models developed by Meeder et al. [10], a 1% increase in slopes makes a walk roughly 10% less attractive. Therefore, for an accurate measurement of this indicator, the weight adopted can be kept high. If the measure is done subjectively by an evaluator (taking into account for example the physical effort), it should decrease or be subjected to statistical treatment. It would be also important to carry out night-time assessments to determine the lighting conditions and to integrate an evaluation of the design options for physical impaired pedestrians. The latter can be included through inquiries on impaired pedestrian’s perception about the pedestrian environment quality in order to mitigate or even eliminate possible existing barriers. The inclusion of an indicator related to the level of service offered by the segment, intersection or infrastructure could also enhance the analysis and evaluation of pedestrian environments.
Finally, a wider application of the PEQI PT will allow to validate and to refine the set of adopted indicators and their weights.
4. Conclusions
From the study carried out it was possible to conclude that in most cases the pedestrian system (environment or performance) evaluation is performed separately for intersections and street segments based on their different characteristics and the pedestrian’s behaviour at these places. It can also be concluded that data collection is usually organized by topic and that some audits incorporate issues related with the observer’s perception. The most common topics are land use, pedestrian facilities and road/traffic and some of the most common indicators are the number of lanes, the posted speed limit on vehicles, the sidewalk surface condition, driveway cuts, presence of trees and buffers, and pedestrian-scale street lighting.
The index adopted to evaluate the quality of the pedestrian environment of Portuguese medium-sized cities was the PEQI, since it allows a greater flexibility in the incorporation of new indicators, changes in their weights and calibration for different scenarios. To calibrate the original PEQI and test its applicability, a case study incorporating the areas that presented a significant pedestrian demand in Covilhã city was considered.
Concerning intersections, the main findings of the case study showed that about 47% presented non-suitable environment, 31% poor conditions and only 22% revealed basic or reasonable pedestrian conditions. These values are largely due to the lack of crosswalks at these sites. The roundabouts were the intersections type with better scores. On the other hand, about 70% of the analysed street segments revealed basic conditions, 17% reasonable conditions and 12% showed poor pedestrian conditions. With this index, it is still possible to make a study for each indicator individually. For example, it was possible to verify that about 70% of the analysed sidewalks presented some impediments and 15% significant impediments (due to damages caused by tree roots), which indicates the necessity of intervention.
In conclusion, the PEQI adapted approach and the analysis of the information related to indicators allow an integrated view of the pedestrian environment quality of an urban area or city and the identification of areas with pedestrian problems, supporting the definition of intervention actions in order to improve the global pedestrian environment.
References
[1] Amoroso S, Castelluccio F, Maritano L. Urban Transport XVIII - Urban Transport and the Environment in the 21st Century UK: WIT Press; 2012.Z. A. Latif, I. Zamri, and H. Omar, “Determination of tree species using Worldview-2 data,” 2012 IEEE 8th Int. Colloq. Signal
Process. Its Appl., pp. 383–387, 2012.
[2] Litman T. Economic Value of Walkability Victoria Transport Policy Institute, editor. Victoria: vtpi; 2017.
[3] Clifton K, Smith A, Rodriguez D. The development and testing of an audit for the pedestrian environment. Landscape and Urban Planning. 2007.
WMCAUS 2018
IOP Conf. Series: Materials Science and Engineering 471 (2019) 062033
IOP Publishing doi:10.1088/1757-899X/471/6/062033
10
[4] Asadi-Shekari Z, Moeinaddini M, Shah M. Pedestrian safety index for evaluating street facilities in urban areas. Safety Science. 2015.
[5] SFDPH. The Pedestrian Environmental Quality Index (PEQI): An assessment of the physical condition of streets and intersections. São Francisco: 2008.
[6] TRB. HCM2010 - Highway Capacity Manual (Vol 3) US: Nacional Academy of Sciences; 2010. [7] Livi A. Pedestrian Environment Data Scan Audit Protocol. 2004.
[8] UCLA. PEQI Full Protocol. 2013.
[9] Sousa A. Evaluation of the Pedestrian System to Improve Urban Mobility (in Portuguese) Covilhã: Department of Civil Engineering and Arquitecture - University of Beira Interior; 2016.
[10] Meeder M, Aebi T, Weidmann U. The influence of slope on walking activity and the pedestrian modal share. Transportation Research Procedia. 2017; 27: p. 141–147.
![Figure 2. Street segments PEQI PT score [9]](https://thumb-eu.123doks.com/thumbv2/123dok_br/18871868.931410/9.892.173.718.305.708/figure-street-segments-peqi-pt-score.webp)