AGFORWARD (Grant Agreement N° 613520) is co-funded by the European Commission, Directorate General for Research & Innovation, within the 7th Framework Programme of RTD. The views and opinions expressed in this report are purely those of the writers and may not in any circumstances be regarded as stating an official position of the European Commission
Current extent and trends of agroforestry in the EU27
Project name
AGFORWARD (613520)
Deliverable
D1.2: Current extent and trends of agroforestry use in the EU27, including
maps with agroforestry likelihood, stratified into systems aligned with
work-packages 2 to 5
Original date
7 December 2014
Current date
4 December 2015
Authors
Michael den Herder, Gerardo Moreno, Rosa Mosquera-Losada, João Palma,
Anna Sidiropoulou, Jose Javier Santiago Freijanes, Josep Crous-Duran,
Joana Paulo, Margarida Tomé, Anastasia Pantera, Vasileios Papanastasis,
Konstantinos Mantzanas, Przemko Pachana, and Paul J. Burgess
Reviewer
Approved by Tobias Plieninger and Paul Burgess
Contents
1 Context ... 2
2 Executive summary ... 2
3 Introduction ... 5
4 Material and methods ... 6
5 Results ... 16
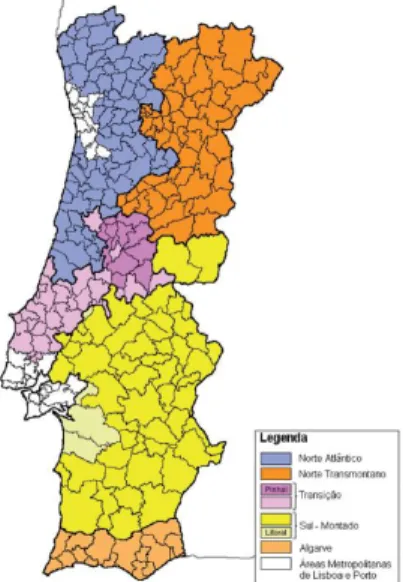
6 Agroforestry inventories in Portugal, Spain and Greece ... 51
7 Discussion ... 79
8 Conclusions ... 86
9 Acknowledgements ... 86
References ... 87
Annex A. Data sources ... 90
Annex B. Agroforestry likelihood ... 91
Deliverable 1.2: AGFORWARD (613520) 4 December 2015
1 Context
The AGFORWARD research project (January 2014-December 2017), funded by the European Commission, is promoting agroforestry practices in Europe that will advance sustainable rural development. The project has four objectives:
1) to understand the context and extent of agroforestry in Europe,
2) to identify, develop and field-test innovations (through participatory research) to improve the benefits and viability of agroforestry systems in Europe,
3) to evaluate innovative agroforestry designs and practices at a field-, farm- and landscape scale, and
4) to promote the wider adoption of appropriate agroforestry systems in Europe through policy development and dissemination.
This report describes a deliverable to address objective 1. The extent and recent changes of agroforestry systems in Europe will be assessed using existing EU27 land cover and land use databases.
2 Executive summary
An accurate and objective estimate on the extent of agroforestry in Europe is critical for the development of supporting policies. Despite the fact that agroforestry can be found almost everywhere it is hard to find reliable data on the extent of agroforestry, especially in Europe. However, databases that can be used to provide an estimate on the extent of agroforestry in Europe are available. The CORINE land cover classification (European Environment Agency, 1995) contains land cover data for Europe and includes the land cover class “agroforestry”. Nevertheless, it is obvious from previous studies that agroforestry is practiced on a much wider scale than estimated by the CORINE database. A recent literature study summarising the currently available data sources estimated that agroforestry is practiced in Europe at least on an area of 10.6 million hectares equivalent to 6.5% of the utilized agricultural area (den Herder et al. 2015) which is considerably more than the 3.3 million hectares as estimated by CORINE. However, even though literature studies are useful to understand the context, data obtained from literature studies are not collected in a comparable way which makes it difficult to give a reliable estimate. For this reason, a more harmonized and uniform pan-European estimate is needed. In this report we try to answer the question: How much agroforestry is there in Europe and where is it?
The agroforestry areas were mapped using three different approaches based on existing land cover and land use databases: LUCAS Land Use and Land Cover data, Copernicus Land Monitoring Survey (high resolution maps with tree cover density for seven countries) and a review of the literature and statistical inventories from some selected countries.
For the analysis of the LUCAS data in this report, agroforestry systems were grouped into four categories, similar as in the AGFORWARD project. These categories were chosen on the basis of the initial perspective of the farmer and comprise: i) high natural and cultural value agroforestry systems, ii) high value tree agroforestry systems, iii) arable agroforestry systems, and iv) livestock agroforestry systems.
Deliverable 1.2: AGFORWARD (613520) 4 December 2015 According to our estimate using the LUCAS database the total area under agroforestry in the EU 27 is about 24 million ha which is equivalent to about 5.7% of the territorial area or 14% of the utilised agricultural area. This estimate is considerably larger than the previous estimate by den Herder et al. (2015) who suggested that agroforestry occupies at least 10.6 million ha representing about 6.5% of the utilised agricultural area in Europe. Of our four studied systems, high natural and cultural value agroforestry covers about 20.3 million ha which is by far the largest area. Livestock agroforestry which partly overlaps with high natural and cultural value agroforestry covers 16.1 million ha. High value tree agroforestry and arable agroforestry cover 2.6 and 2.2 million ha respectively. A hot spot analysis revealed that a high abundance of areas under agroforestry can be found in south, central and north-east Portugal, south-west, central and parts of north Spain, south of France, Sardinia, Sicily and south Italy, central and north-east Greece, central and west Bulgaria, central and north Romania and western Cyprus.
Spain (6.9 million ha), France (2.6 million ha), Italy (2.3 million ha), Greece (2.1 million ha), Romania (1.9 million ha) and Portugal (1.8 million ha) have the largest absolute extent of agroforestry. However, if we would look at the extent of agroforestry in relation to the utilised agricultural area (UAA), countries like Cyprus (78% of UAA), Portugal (49% of UAA) and Greece (40% of UAA) have the largest percentage of agroforestry cover.
LUCAS data were also used to estimate the extent of single trees and green linear elements such as hedgerows. Agroforestry involving single trees covers almost 300 thousand hectares corresponding to around 0.02% of the territorial area in the EU. The largest extent of agroforestry with single trees or single bushes can be found in France (55,900 ha) followed by Spain (44,300 ha) and the UK (35,900 ha). Agroforestry involving hedgerows cover about 1.78 million hectares representing around 0.42% of the territorial area in the EU. The largest extent of agroforestry with hedgerows can be found in France (598,000 ha) followed by the UK (240,000 ha) and Italy (168,000 ha).
The higher estimate for the agroforestry area using the LUCAS data (24.4 million ha) than the literature review (10.6 million ha) can be partly explained by the addition of data for Romania (1.76 million ha) and Bulgaria (1.39 million ha), plus higher estimates for Spain (+3.05 million ha), France (+2.12 million ha) and Italy (+1.34 million ha). When the LUCAS estimates for Spain and Portugal were compared with a more detailed analysis of national inventories, the higher estimate for agroforestry in Spain of about 6.89 million ha rather than 3.84 million ha seems valid. The higher estimate for Spain is primarily a result of including silvopastoral systems in addition to the dehesa.
Remote sensing data were used to estimate tree cover on agricultural land. At the landscape scale (100 m x 100 m), tree cover density on agricultural land was surprisingly high and the seven investigated countries (Austria, Switzerland, Estonia, Latvia, Lithuania, Sweden and Norway) together have about 4.5 million hectares of agricultural land with more than 10% tree cover. At the landscape scale, Sweden has the largest extent of agricultural land with significant tree cover.
Considering the fact that agroforestry covers a considerable part of the agricultural land in the EU (up to about 14% of the UAA), agroforestry deserves a more prominent place in EU statistical reporting. This is not difficult to implement. Although this current estimate of the extent of agroforestry in Europe was difficult to undertake, statistical reporting could be improved. For
Deliverable 1.2: AGFORWARD (613520) 4 December 2015 example, identifying agroforestry areas using the Eurostat’s LUCAS database could be made easier and more straightforward by introducing a few simple changes in data collection. Although analyses suggest that it was rare for LUCAS results from Spain to identify “agroforestry” at the interface of independently managed forest and agricultural land, this should still be checked for other regions.
Most likely there is still an error in the extent of agroforestry, but since the data were collected and analysed in a uniform manner it is now possible to make comparisons between countries and identify regions in Europe where agroforestry is already widely practiced and areas where there would be opportunities for practicing agroforestry at a larger scale. A more uniform reporting method makes it easier to give more precise estimates on the extent of agroforestry in Europe and changes in its extent. This would help to increase the role of agroforestry on policy agendas and provide decision makers with more reliable information on the extent of agroforestry and changes. Without reliable and up-to-date information on the extent agroforestry area, both now and changes over time, it will be very hard to plan and evaluate measures to promote this sustainable land use practice.
Deliverable 1.2: AGFORWARD (613520) 4 December 2015
3 Introduction
In the AGFORWARD project agroforestry is defined as “the practice of deliberately integrating woody vegetation (trees or shrubs) with crop and/or animal systems to benefit from the resulting ecological and economic interactions” (Burgess et al. 2015). Based on this definition alone it would be very hard to estimate the extent of agroforestry in Europe and we would need some more information to frame the boundaries of what is and is not agroforestry. There are several categories of common agroforestry practices in Europe including wood pastures, hedgerows, windbreaks, riparian buffer strips, intercropped and grazed orchards, grazed forests, forest farming (Mosquera-Losada et al. 2009), and more novel silvoarable and silvopastoral systems such as alley cropping, woodland chicken, and food forestry. What each of these practices has in common is that they take advantage of the interactive benefits from combining trees and shrubs with crops and/or livestock to create an integrated and sustainable land-use system (Lundgren and Raintree 1982, Leakey 1996).
An accurate and objective estimate on the extent of agroforestry in Europe is critical for the development of supporting policies. Despite the fact that agroforestry can be found almost everywhere it has been hard to find reliable data on the global extent of agroforestry (Zomer et al. 2009) and especially in Europe. This lack of European data, and a narrow definition of agroforestry, has led in the past to the misconception that agroforestry is probably of little importance in a European context. This misunderstanding can lead to incorrect policy decisions and this problem can best be tackled by providing an objective estimate on the extent of agroforestry in Europe. This is especially important since recently agroforestry is gaining momentum in researcher, farmer and policy circles. In this report we try to answer the question: How much agroforestry is there in Europe and where is it?
Databases providing an estimate on the extent of agroforestry in Europe are already available. The CORINE land cover classification contains land cover data for Europe and includes the land cover class “agroforestry” (European Environment Agency 1995). According to the CORINE database, agroforestry covers about 3.3 million hectares in Europe, mainly in Spain, Portugal and Italy with some smaller areas in France and Austria. However other studies have demonstrated that agroforestry is practiced on a wider scale than this and that the CORINE database is underestimating the agroforestry area. The agroforestry system of wood pastures has the largest areal extent in Europe and they are found in all climatic zones ranging from the Mediterranean to boreal zones (Bergmeier et al. 2010, Plieninger et al. 2015). Oak tree systems in the Mediterranean and reindeer husbandry in northernmost Fennoscandia in particular cover large areas (Eichhorn et al. 2006, Jernsletten and Klokov 2002). There are also other systems. Fruit tree agroforestry systems are particularly found in the central (Herzog 1998) and Mediterranean regions of Europe, with large areas of olive agroforestry in the Mediterranean region (Eichhorn et al. 2006). A recent literature study summarising the currently available data sources estimated that agroforestry in Europe is practiced at least on an area of 10.6 million hectares equivalent to 6.5% of the utilized agricultural area in Europe (den Herder et al. 2015).
Zomer et al. (2009) report a first attempt to quantify the extent of agroforestry at the global level. One surprising result was the unexpectedly large extent of agroforestry worldwide. Globally, approximately 46% of all agricultural land had at least 10% tree cover. For Europe, the corresponding figure was that 40% of all agricultural land in Europe had at least 10% tree cover
Deliverable 1.2: AGFORWARD (613520) 4 December 2015 (Zomer et al. 2009). A key result was that agroforestry is a significant feature of agriculture in all regions of the world. In the 2014 update on the global extent of agroforestry, Zomer et al. (2014) reported that even about 46% (i.e. about 113.5 million ha) of all agricultural land in Europe had at least 10% tree cover. Thus estimates on the extent of agroforestry depend a lot on the definition of agroforestry. In the current report, we adopt the same definition for agroforestry used by several authors (Lundgren and Raintree 1982, Leakey 1996, Zomer et al. 2009, Burgess et al. 2015); the deliberate integration of woody vegetation with crops and/or animals to benefit from the resulting ecological and economic interactions.
There are a range of methods for categorising agroforestry practices. This can be done on the basis of components, products, agro-ecological zones, and socio-economic groupings (McAdam et al. 2009). In the AGFORWARD project, agroforestry systems have been grouped into four categories on the basis of the initial perspective of the farmer. The main types of agroforestry systems provided by the AGFORWARD project are: high natural and cultural value agroforestry systems, high value tree agroforestry systems, arable agroforestry systems, and livestock agroforestry systems. A more detailed description of the four different systems is available on the AGFORWARD website (www.agforward.eu) and in the preliminary stratification of the systems by den Herder et al. (2015). In the current report we used the same stratification of European agroforestry into these four different systems. The extent of the systems was estimated using uniform EU-wide statistics and databases. The results from these were then compared with the country reports made by experts from some selected agroforestry countries.
4 Material and methods
Agroforestry areas were mapped using three different approaches that are based on existing land cover and land use databases: LUCAS Land Use and Land Cover data, COPERNICUS Land Monitoring Survey (high resolution maps with tree cover density for seven countries) and a review of the literature and statistical inventories from some selected countries.
4.1 The Land Use/Cover Area frame Survey (LUCAS)
For the quantification of agroforestry in Europe, we used data collected in the Land Use/Cover Area frame Survey (LUCAS) which is a harmonised in situ land cover and land use data collection exercise that extends over the whole of the EU’s territory (Eurostat 2015). The first survey was held in 2001. In 2006, the sampling methodology changed and its focus shifted from an agricultural land survey to a broader land cover, land use and landscape survey. In the same year, a three-yearly interval was introduced for carrying out the survey. In 2009, the geographical coverage of LUCAS was expanded to 23 of the then EU-27 Member States. For this report we used the data from the 2012 survey which covered all of the then EU-27 Member States. Croatia joined the EU in 2013 and was not yet included in the LUCAS 2012 data collection.
LUCAS is a two phase sample survey. The LUCAS first phase sample is a systematic sample with points spaced 2 km apart in the four cardinal directions covering the whole of the EU’s territory; it therefore includes around 1.1 million different points. Each point of the first phase sample is photo-interpreted and assigned to one of the following seven pre-defined land cover strata: arable land, permanent crops, grassland, wooded areas and shrubland, bareland, artificial land, and water. From the stratified first phase sample, a second phase sample of points (the field sample) is drawn. During
Deliverable 1.2: AGFORWARD (613520) 4 December 2015 the LUCAS 2012 survey, a sample of 270,000 of first phase points was visited on the spot by field surveyors. The selection of the points is based on the stratification information producing a quasi-regular grid with on average a LUCAS sample point in every block of 4 km x 4 km. However, points above 1500 metres and far from the road network were considered inaccessible and were therefore not visited (Eurostat 2015).
Due to the intensive sampling effort that was used in LUCAS, the set of points can be viewed as representative of the land cover at EU and also for the larger countries at national scales. To estimate the extent of agroforestry practices in Europe, we divided the number of points defined as agroforestry in each country by the total number of LUCAS points in this country and multiplied this by the surface of the country.
It is important to note that LUCAS uses a double land cover classification system for land covers with multiple layers, such as for instance agroforestry systems where there is often in addition to a tree layer also a secondary layer which can be composed of shrubs, crops or grass. In LUCAS this is marked entered as the primary land cover (LC1) which is composed of trees when these are present, and the secondary land cover (LC2) which can be composed of e.g. shrubs, crops, grass or bare soil. In specific landscapes, such as agroforestry area and complex or heterogeneous areas these two separate land covers (LC1 and LC2) are used. For example, our database contains many points where for land cover 1 (LC1) is entered “apple trees (B71)” and land cover 2 (LC2) is “common wheat (B11)”. In the real world this means that on this particular point common wheat was growing under the apple trees. It is likely that points with this particular combination of primary and secondary land cover represent a silvoarable practice using a combination of apple trees and common wheat.
Another useful variable in the LUCAS database is land management, which contains information on if this is any sign of grazing. By identifying certain combinations of primary and secondary land cover and land management it is possible to identify agroforestry points and stratify them into different systems. Agroforestry systems were stratified according to the same classification described by den Herder et al. (2015) into systems or practices focussed on high natural and cultural value, high value trees (e.g. olive and fruit trees), arable systems, and livestock systems. For each system, the criteria for the selection of LUCAS points belonging to a particular system were different. The selection procedure for stratifying agroforestry points into four discernible systems (high natural and cultural value, high value trees, arable and livestock) is explained in more detail in the following sections.
4.1.1 High natural and cultural value agroforestry systems
Currently their is no universal or officially accepted definition of the concept “high natural and cultural value” agroforestry systems (but see den Herder et al. 2015 for a preliminary stratification of agroforestry systems). The high nature value concept was proposed by the European Environment Agency (Parachini et al. 2006). The concept recognizes that specific farming practices and systems support high biodiversity levels (Pointereau et al. 2007). For instance, the dehesas and montados agroforestry systems in Spain and Portugal are among the highly diverse high nature value systems in Europe. According to Paracchini et al. (2006) there exist three types of high nature value farmland: 1) farmland with a high proportion of semi-natural vegetation, 2) farmland with a mosaic of low intensity agriculture and natural and structural elements, such as field margins, stone walls, patches of woodland or scrub, small rivers, and 3) farmland supporting rare species or a high proportion of
Deliverable 1.2: AGFORWARD (613520) 4 December 2015 European or world populations. Plieninger et al (2015) made an estimate on the extent of wood pastures in Europe based on LUCAS data and their analysis would correspond with the “type 1” high nature value farmland with a high proportion of semi-natural vegetation. In addition, their definition of wood pastures would generally correspond as well with our understanding of the concept high natural and cultural value agroforestry. Therefore, we thought it is justified to assume that the estimate of Plieninger et al (2015) on the extent of wood pastures in Europe is also a good estimate on the extent of high natural and cultural value agroforestry in Europe.
A more detailed description on estimating the extent of wood pastures using LUCAS data is provided by Plieninger et al. (2015), whose approach shows similarities with our approach for estimating high value tree, arable and livestock systems. The approach can be summarized as follows: in LUCAS, the presence of trees in the observational point was assessed considering a 20 m radius. On the basis of the LUCAS data, Plieninger et al. (2015) defined wood-pastures as those sampled points that show a combination of a tree cover (density of tree-crown >5%) with a pasture cover (grassland communities with clear evidences of grazing, coded as land use U111 in the LUCAS database). They mapped three categories of wood-pastures: i) pastures in open woodlands, including those points with woodland (density of tree-crown >10%) as the primary land cover (coded as C10 to C33), and with grassland as the secondary land cover (coded as E10 and E30); ii) pastures with sparse trees (density of tree-crown between 5% and 10%), directly defined in the LUCAS database as a specific land cover class (coded as E10); and iii) pastures with cultivated trees (coded as B71 to B81) with recorded grazing land use i.e. excluding points that are ungrazed permanent croplands rather than fully-fledged wood-pastures. As a result, Plieninger et al. (2015) found that the LUCAS database contained 12,772 points that they considered wood-pastures. In this report, we thought it is justified to consider these wood pastures mapped by Plieninger et al. (2015) to be similar to high natural and cultural value agroforestry areas in the current exercise.
A hot spot analysis was used to identify areas with a relatively high abundance of wood pastures. Loss of habitat including effects of increasing fragmentation by humans – decreasing habitat fragment size and increasing isolation between fragments – are major threats to biodiversity (Larsson et al. 2001). The ability of organisms to migrate and disperse across the landscape depends to some degree on the spatial structure of the landscape. Therefore, fragmentation is one of the central issues in conservation and landscape management. In the process of fragmentation, large intact habitats are converted into a mosaic of smaller patches. Fragmentation influences biodiversity by reduction of habitat and there will be smaller sized fragments of the habitat left which will be more isolated. Smaller habitats affects the population size in each habitat fragment and increases the risk of extinction of isolated populations of species with limited dispersal capacity (Larsson et al. 2001).
For the hot spot analysis we assumed that large extents of wood pastures or wood pastures with a low level of fragmentation are more likely to have a high natural value compared to single isolated or fragmented patches. The analysis was used to indicate in which areas wood pastures are relatively well-connected or in which European regions they would cover larger areas. To estimate the abundance of wood pastures, we used the Kernel density tool in ArcMap 10 (ESRI 2015). The Kernel density tool calculates the density of a feature in a neighbourhood around the feature. In our
Deliverable 1.2: AGFORWARD (613520) 4 December 2015 case we used the tool to calculate the density of LUCAS wood pasture points around each wood pasture point and the results were visualised in a grid.
A similar hot spot analysis as for the wood pastures was carried out for the high value tree, arable and livestock systems to indicate areas in Europe with a relatively high abundance of these agroforestry practices.
4.1.2 Agroforestry with high value trees
As a first step in identifying agroforestry areas containing high value trees, we selected the following primary land cover classifications (LC1) indicating points with high value trees: B71 apple, B72 pear, B73 cherry, B74 nuts, B75 other fruit trees and berries, B76 oranges, B77 other citrus fruits, B81 olive groves, B82 vineyards, B83 nurseries and B84 industrial crops (only mulberry and carob were included). See Eurostat (2012) for more information on LUCAS land cover and land use classification codes.
As a next step, out of our selected points containing high value trees we identified those which can be described as grazed orchards. In LUCAS grazing is marked in the Land Management column (1 = signs of grazing, 2 = no signs of grazing). In LUCAS, grazed orchards can be identified by selecting points with high value trees as a primary land cover in combination with signs of grazing.
To identify arable high value tree systems, we have to find a combination of LC1 and LC2 which could indicate high value trees intercropped with arable crops. In combination with the selected primary land covers containing high value trees from above (LC1=B71-B84), the following secondary land cover classifications (LC2) could indicate intercropped high value trees: B11 common wheat, B12 durum wheat, B13 barley, B14 rye, B15 oats, B16 maize, B19 other cereals, B21 potatoes, B23 other root crops, B31 sunflower, B41 dry pulses, B42 tomatoes, B43 other fresh vegetables, B44 floriculture and ornamental plants, B45 strawberries, B50 fodder crops (mainly leguminous), B51 clovers, B52 lucerne, B53 other leguminous and mixtures for fodder, B54 mix of cereals and E30 spontaneously re-vegetated surfaces (indicating areas which are ploughed).
4.1.3 Agroforestry for arable systems
To identify arable agroforestry systems, we selected combinations of LC1 and LC2 which could indicate intercropped permanent crops, woodlands or shrubland. To identify arable agroforestry systems, we select the same primary land cover (LC1) as under the high value trees (B71-B84; willow was now added under B84), but now we also included the land cover classes indicating woodland (C10-C33). As a secondary land cover we selected B11-B54 indicating that there are crops grown under planted or forest trees.
4.1.4 Agroforestry for livestock systems
To identify livestock agroforestry systems, we selected the same primary land cover classes (LC1) as selected above under the arable systems (permanent crops B71-B84, woodland C10-C33 and shrublands with sparse tree cover D10. To this selection we added the grasslands with sparse tree cover (E10) as these areas are often used for livestock grazing. In addition we added the following land use classes to our selection: U361 Amenities, museums, leisure, U410 Abandoned areas and
Deliverable 1.2: AGFORWARD (613520) 4 December 2015 U420 Semi-natural and natural areas not in use. The reasoning for adding these land use classes was that recreation areas (class U361) often contain significant areas with natural woody vegetation and sometimes these areas are grazed either by domestic or wild animals. Abandoned areas and (semi-) natural areas, which may seem unused at first sight, are also often used for grazing. To identify those LUCAS points which show signs of grazing we used the same approach as under the grazed high value tree systems by selecting grazed points in the Land Management column (1 = signs of grazing, 2 = no signs of grazing). Agroforestry livestock systems were identified by selecting the grazed points from our selection of primary land covers.
4.1.5 Total extent of agroforestry area in Europe
The four different agroforestry systems stratified for the purpose of the AGFORWARD project and as described in this report are for a large part overlapping. The area of high natural and cultural value agroforestry overlaps for a large part with livestock agroforestry. Similarly, high value tree agroforestry overlaps with livestock and arable agroforestry. Therefore, to estimate the total agroforestry area in the EU we cannot simply sum up the area covered by the different systems. We corrected for this overlap by merging the files for our four different systems. Each LUCAS point has a unique identifier and in this way we could exclude those points which occurred more than once in our estimate on the total extent of agroforestry.
4.2 Agroforestry likelihood map
Using LUCAS we can make area calculations but the problem is that the resulting maps will only contain agroforestry point data. By combining LUCAS and CORINE it could be possible to identify those areas where it would be likely to find agroforestry. The assumption behind it is that if we find a confirmed agroforestry point in LUCAS in a certain CORINE land cover type, it is likely that there will be more farms practicing agroforestry on the same particular land cover class in other areas as well.
In the analysis we examined to which particular CORINE classes our LUCAS agroforestry points correspond. In order to do so, for all our selected LUCAS agroforestry points we counted how many of these points belong to a certain CORINE class. Based on this we calculated the density of agroforestry points for each land CORINE land cover class (Figure 1; Appendix B). Following this principle, areas with a high density of agroforestry points would have high agroforestry likelihood. Agroforestry likelihood was calculated for each CORINE class as shown in Equation 1.
Deliverable 1.2: AGFORWARD (613520) 4 December 2015 Figure 1. Example of LUCAS points in a CORINE Land Cover Class polygon.
𝐴𝐹 𝑙𝑖𝑘𝑒𝑙𝑖ℎ𝑜𝑜𝑑 =Density of LUCAS agroforestry pointsDensity of all LUCAS points x 100% Equation 1
Agroforestry likelihood was calculated for each CORINE class for each country as shown in the example above. Based on the calculated likelihood per CORINE land cover class per country we were able to reconstruct a European agroforestry likelihood map.
4.3 Estimating the extent of hedgerows and isolated trees
In order to estimate isolated trees and hedgerows cover in Europe, we used the transect data included in the LUCAS 2012 update for each LUCAS point. These transects describe all features found in a transect of 250 m east placed at each LUCAS point, using the same LUCAS cover codes but also new codes dealing with linear elements of the landscape. We focused on those features more likely related to agroforestry like isolated trees taken from “single trees, single shrub” with code 10 and tree lines defined as the code 11 (avenue trees: One line of trees, not clustered trees; two lines of trees (avenue trees) are separated by a road), and those with less than 3 m width as code 12 (Conifer hedges: the feature is coded when the width is less than 3 m), 13 (Bush/tree hedges/coppices, visibly managed, e.g. pollarded (generally < 5 m height). The feature is coded when the wide is less than 3 m) and 14 (Bush/tree hedges, not managed, with single trees, or shrubland deriving from abandonment - The feature is coded when the width is less than 3 m. Shrub or wood margins are found as field boundaries within agricultural land or alongside roads or water courses). Within each region, we identified each coded element within each transect. From the 1283 transects measured of total of 270,276 transects carried out in Europe we got a mean of the surface occupied by a tree at European level. We multiplied the number of coded elements per transect by the mean of the surface occupied by each tree and therefore we obtain the meters occupied by trees within a transect of 250 m. This value was later on divided by 250 m to provide the proportion of the length of an identified element with respect to the total length of the transects in a region. Hereafter, we
Agroforestry
No agroforestry
Deliverable 1.2: AGFORWARD (613520) 4 December 2015 multiplied this percentage by the total area of each region in Europe. The Microsoft Excel 10 program was used for these calculations. Maps were created with QGIS version 2.12 Lyon.
4.4 Tree cover density on agricultural land
The extent of agroforestry, if defined by tree cover on agricultural land of greater than 10%, can be estimated by analysing tree cover density. A first attempt on the quantification of the extent of agroforestry at the global level was made by Zomer et al. (2009) using the then-available remote sensing datasets. In their first attempt they used a 1 km2 resolution tree-cover data set together with a global land-use layer to investigate the occurrence of agroforestry, which was defined as tree cover on agricultural land. Later, their assessment was updated using a dataset with improved resolution (250 m) and improved quality (Zomer et al. 2014).
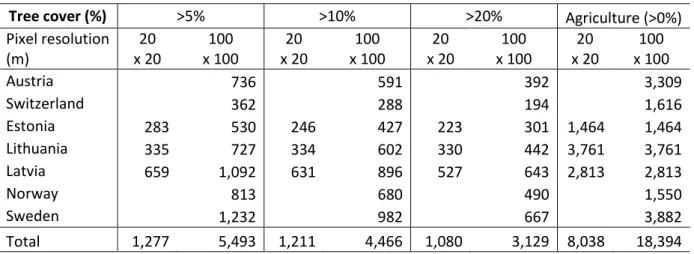
For our European assessment in this report, tree cover density maps (% tree cover per pixel) at a 20 and 100 m resolution were available for Norway, Sweden, Estonia, Latvia, Lithuania, Switzerland and Austria (Figure 2)(Copernicus Land Monitoring Services 2015). The raster data were used to analyse tree cover density in agricultural land of these six countries for which we had data. An agricultural land vector layer was created by merging all CORINE land cover classes (CORINE class 2.1.1. to 2.4.4.) belonging to the first level category “agricultural areas”. The merged layer was used as a mask to map all agricultural land of the selected countries (Figure 3). Tree cover density data were analysed at different scales. The 20 m resolution raster data was used to assess tree cover density at the field scale and the 100 m resolution for the assessment of tree cover at the landscape scale. At the time of writing the report, we only analysed tree cover density for this limited set of countries. However, in the near future, tree cover density mosaic layers will be available for whole Europe at a 20 m and 100 m resolution.
Deliverable 1.2: AGFORWARD (613520) 4 December 2015 Figure 2. Tree cover density map at a) 20 m and b) 100 m resolution. The map depicts tree cover density in agricultural and forest areas.
Deliverable 1.2: AGFORWARD (613520) 4 December 2015 Figure 3. Tree cover density at a 20 m resolution: a) CORINE Land Cover classification was used to identify agricultural areas (in purple), and b) then we visualized and quantified tree cover density on agricultural land as indicated by the grey-scale gradient (black = 0% tree cover, white = 100% tree cover).
Deliverable 1.2: AGFORWARD (613520) 4 December 2015
4.5 Verification of the LUCAS maps and area estimates
To verify if our LUCAS estimates on the area covered by agroforestry produced a reasonably reliable estimate, we included three chapters reviewing mapping exercises and examining national statistics in some selected agroforestry countries such as Greece, Portugal and Spain. Our LUCAS estimates were compared against the results from these national agroforestry reviews. Another way of verification method is handled in the discussion section. In this section the LUCAS results are compared with the results from the literature study on the preliminary stratification of agroforestry in Europe by den Herder et al. (2015).
Deliverable 1.2: AGFORWARD (613520) 4 December 2015
5 Results
5.1 Extent of agroforestry based on LUCAS
5.1.1 High nature and cultural value agroforestry systems
Wood pastures cover about 20.3 million hectares in Europe according to the estimate by Plieninger et al. (2015) corresponding to about 4.7% of the territorial area in the EU (Table 1). The largest extent of wood pastures can be found in the Mediterranean countries in Spain (5.8 million ha), France (2.1 million ha), Italy (1.5 million ha), Portugal (1.5 million ha) and Greece (1.3 million ha) (Figure 4). Wood pastures also cover large areas in Eastern Europe especially in Romania (1.7 million ha) and Bulgaria (1.1 million ha). The largest extent of pastures in open woodland is found in Spain (3.7 million ha) and Portugal (1.1 million ha). The largest areas of pastures with sparse trees are found in Spain (1.9 million ha), Romania (1.5 million ha), France (1.4 million ha), Italy (1 million) and Bulgaria (1 million ha). The largest extent of pastures with cultivated trees (fruit, olives or nuts) is found in Spain (192 thousand ha), Greece (125 thousand ha), Portugal (114 thousand ha), and Italy (106 thousand ha).
Large extents of wood pastures or wood pastures with a low level of fragmentation are more likely to have a high natural value compared to single isolated or fragmented patches. The hot spot analysis shows areas with a relatively high abundance of wood pasture points (Figure 5). It means that in these areas wood pastures probably cover larger areas or that the individual pastures are situated at a relative close proximity and therefore are more likely to be well-connected to each other. The hot spot analysis revealed that a high abundance of wood pastures can be found in south Portugal, south-west Spain, south of France, Sardinia, Sicily and south Italy, central and north-east Greece, central and west Bulgaria, and central and north Romania (Figure 5).
Deliverable 1.2: AGFORWARD (613520) 4 December 2015 Table 1. Extent of wood pastures in Europe based on LUCAS data (table adapted from Plieninger et al. 2015).
Country Total territorial area1
Pastures in open woodland Pastures with sparse trees Pastures with cultivated trees
Wood pasture total
1000 ha 1000 ha % 1000 ha % 1000 ha % 1000 ha % Austria 8388 36.4 0.4 76.6 0.9 22.1 0.3 135.0 1.6 Belgium 3053 15.0 0.5 50.1 1.6 2.5 0.1 67.6 2.2 Bulgaria 11090 96.9 0.9 1027.8 9.3 20.1 0.2 1144.8 10.3 Cyprus 925 1.6 0.2 4.7 0.5 3.5 0.4 9.9 1.1 Czech Republic 7887 31.4 0.4 45.7 0.6 8.6 0.1 85.7 1.1 Denmark 4290 52.4 1.2 11.2 0.3 0.0 0.0 63.6 1.5 Estonia 4523 2.1 0.0 96.0 2.1 0.0 0.0 98.1 2.2 Finland 33843 27.4 0.1 59.8 0.2 0.0 0.0 87.2 0.3 France 54397 664.4 1.2 1386.1 2.5 54.4 0.1 2104.9 3.9 Germany 35713 249.4 0.7 275.2 0.8 34.4 0.1 559.1 1.6 Greece 13196 420.0 3.2 800.7 6.1 124.6 0.9 1345.4 10.2 Hungary 9302 18.0 0.2 198.5 2.1 0.0 0.0 216.6 2.3 Ireland 6980 154.0 2.2 198.1 2.8 0.0 0.0 352.1 5.0 Italy 30134 361.0 1.2 1047.7 3.5 105.9 0.4 1514.5 5.0 Latvia 6456 10.2 0.2 84.8 1.3 0.0 0.0 95.0 1.5 Lithuania 6530 8.4 0.1 212.4 3.3 6.7 0.1 227.5 3.5 Luxembourg 259 2.4 0.9 6.0 2.3 2.4 0.9 10.8 4.2 Malta 32 0.0 0.0 0.0 0.0 0.0 0.0 0.0 0.0 Netherlands 4154 12.8 0.3 11.2 0.3 3.2 0.1 27.1 0.7 Poland 31268 105.8 0.3 357.3 1.1 11.4 0.0 474.6 1.5 Portugal 8909 1072.4 12.0 269.3 3.0 113.5 1.3 1455.3 16.3 Romania 23839 98.1 0.4 1527.8 6.4 73.1 0.3 1699.0 7.1 Slovakia 4904 14.0 0.3 71.8 1.5 0.0 0.0 85.7 1.7 Slovenia 2027 13.9 0.7 91.9 4.5 3.8 0.2 109.5 5.4 Spain 49851 3677.1 7.4 1940.7 3.9 191.7 0.4 5809.6 11.7 Sweden 43858 215.0 0.5 308.6 0.7 2.0 0.0 525.6 1.2 United Kingdom 24853 344.8 1.4 441.0 1.8 14.0 0.1 799.8 3.2 EU-27 total 430659 8522 2.0 10925 2.5 890 0.2 20337 4.7
Deliverable 1.2: AGFORWARD (613520) 4 December 2015 Figure 4. Extent of wood pastures in the EU27 based on LUCAS data. Map redrawn from Plieninger et al. (2015).
Deliverable 1.2: AGFORWARD (613520) 4 December 2015 Figure 5. Hot spots for high natural and cultural value agroforestry in Europe. The dark blue areas indicate areas in Europe where wood pastures can be found in high densities.
Deliverable 1.2: AGFORWARD (613520) 4 December 2015
5.1.2 High value tree agroforestry systems
Agroforestry involving high value trees cover about 2.7 million hectares corresponding only to about 0.6% of the territorial area in the EU (Table 2). The largest extent of agroforestry with high value trees can be found in Italy (1 million ha) followed by Greece (437 thousand ha) and Spain (376 thousand ha) (Table 2, Figure 8). France, Portugal and Romania also have a considerable area under agroforestry with high value trees. The largest extent of intercropped high value trees is found in Italy (934 thousand ha) followed by Greece (339 thousand ha), Spain (183 thousand ha) and France (126 thousand ha) (Table 2, Figure 6). The largest extent of grazed high value tree practices is found in Spain (217 thousand ha), Portugal (122 thousand ha), Greece (123 thousand ha) and Italy (116 thousand ha) (Table 2, Figure 7). The hot spot analysis revealed that a high abundance of high value tree agroforestry can be found in south Portugal, south-west Spain, south of France, Sicily and south Italy, central, west and north-east Greece, central Bulgaria, eastern Crete and western Cyprus (Figure 9).
Deliverable 1.2: AGFORWARD (613520) 4 December 2015 Table 2. Extent of intercropped, grazed and total extent of high value tree agroforestry practices in Europe based on LUCAS data
Country Total
territorial area
Intercropped fruit, olive and nut tree area
Grazed fruit, olive and nut tree area
Agroforestry with high value trees (intercropped
and/or grazed) 1000 ha 1000 ha % 1000 ha % 1000 ha % Austria 8388 10.4 0.1 22.0 0.3 32.4 0.4 Belgium 3053 0.0 0.0 2.5 0.1 2.5 0.1 Bulgaria 11090 71.8 0.6 23.4 0.2 91.8 0.8 Cyprus 925 8.3 0.9 6.4 0.7 14.1 1.5 Czech Republic 7887 2.9 0.0 7.2 0.1 10.0 0.1 Denmark 4290 1.2 0.0 0.0 0.0 1.2 0.0 Estonia 4523 0.0 0.0 0.0 0.0 0.0 0.0 Finland 33843 0.0 0.0 0.0 0.0 0.0 0.0 France 54397 126.3 0.2 53.9 0.1 178.8 0.3 Germany 35713 10.0 0.0 35.8 0.1 45.8 0.1 Greece 13196 338.8 2.6 123.0 0.9 436.5 3.3 Hungary 9302 60.2 0.6 0.0 0.0 60.2 0.6 Ireland 6980 0.0 0.0 0.0 0.0 0.0 0.0 Italy 30134 933.6 3.1 116.2 0.4 1008.1 3.3 Latvia 6456 2.9 0.0 0.0 0.0 2.9 0.0 Lithuania 6530 3.4 0.1 6.7 0.1 10.1 0.2 Luxembourg 259 0.0 0.0 2.4 0.9 2.4 0.9 Malta 32 0.4 1.3 0.0 0.0 0.4 1.3 Netherlands 4154 0.0 0.0 3.7 0.1 3.7 0.1 Poland 31268 10.0 0.0 11.5 0.0 21.5 0.1 Portugal 8909 74.1 0.8 122.7 1.4 184.6 2.1 Romania 23839 88.5 0.4 73.5 0.3 161.9 0.7 Slovakia 4904 16.0 0.3 0.0 0.0 16.0 0.3 Slovenia 2027 0.0 0.0 3.8 0.2 3.8 0.2 Spain 49851 183.2 0.4 217.0 0.4 376.2 0.8 Sweden 43858 0.0 0.0 2.0 0.0 2.0 0.0 United Kingdom 24853 2.0 0.0 14.2 0.1 16.2 0.1 EU-27 total 430659 1944 0.5 848 0.2 2683 0.6
Deliverable 1.2: AGFORWARD (613520) 4 December 2015 Figure 6. Intercropped fruit orchards, nut tree plantations and olive groves based on LUCAS data
Deliverable 1.2: AGFORWARD (613520) 4 December 2015 Figure 7. Distribution of grazed fruit orchards, grazed nut tree plantations and grazed olive groves based on LUCAS data.
Deliverable 1.2: AGFORWARD (613520) 4 December 2015 Figure 8. Distribution of two categories (arable and livestock) of agroforestry for high value trees in EU27 based on LUCAS data.
Deliverable 1.2: AGFORWARD (613520) 4 December 2015 Figure 9. Hot spots for high value tree agroforestry in Europe. The dark blue areas indicate areas in Europe where high value tree agroforestry practices can be found in high densities.
Deliverable 1.2: AGFORWARD (613520) 4 December 2015
5.1.3 Arable agroforestry systems
Silvoarable agroforestry covers about 2.2 million hectares corresponding only to about 0.5% of the territorial area in the EU (Table 3). The largest extent of silvoarable agroforestry can be found in Italy (954 thousand ha) followed by Greece (349 thousand ha) and Spain (287 thousand ha) (Table 3, Figure 10). The largest extent of arable agroforestry with permanent crops (planted fruit, nut and olive trees) is found also in Italy (934 thousand ha) followed by Greece (339 thousand ha), Spain (183 thousand ha) and France (126 thousand ha) (Table 3, Figure 10). The largest extent of arable agroforestry in woodlands is found in Spain (104 thousand ha) and Portugal (52 thousand ha). These mainly oak-dominated woodlands often combine silvopastoral and silvoarable practices and are called dehesas and montados. Cereal cultivation is the most common arable agroforestry practise in these oak woodlands. There were almost no arable agroforestry systems linked with shrubland (tree height < 5 m) with sparse trees (Table 3). The hot spot analysis revealed that a high abundance of arable agroforestry can be found in south Portugal, south-west and north-east Spain, south of France, Sicily and south Italy, central and north-east Greece, eastern Crete and central Cyprus (Figure 11).
Deliverable 1.2: AGFORWARD (613520) 4 December 2015 Table 3. Extent of silvoarable agroforestry systems in Europe based on LUCAS data including
agroforestry areas under permanent crops (fruit, nut and olive trees), woodlands and shrubland with sparse trees
Country Total
territorial area
Permanent crops Woodland Shrubland with sparse trees All silvoarable 1000 ha 1000 ha % 1000 ha % 1000 ha % 1000 ha % Austria 8388 10.4 0.1 7.8 0.1 0.0 0.0 18.2 0.2 Belgium 3053 0.0 0.0 0.0 0.0 0.0 0.0 0.0 0.0 Bulgaria 11090 71.8 0.6 8.3 0.1 0.0 0.0 80.1 0.7 Cyprus 925 8.3 0.9 0.0 0.0 0.0 0.0 8.3 0.9 Czech Republic 7887 2.9 0.0 0.0 0.0 0.0 0.0 2.9 0.0 Denmark 4290 1.2 0.0 3.7 0.1 0.0 0.0 5.0 0.1 Estonia 4523 0.0 0.0 0.0 0.0 0.0 0.0 0.0 0.0 Finland 33843 0.0 0.0 0.0 0.0 0.0 0.0 0.0 0.0 France 54397 126.3 0.2 19.9 0.0 0.0 0.0 146.1 0.3 Germany 35713 10.0 0.0 10.0 0.0 1.4 0.0 21.5 0.1 Greece 13196 338.8 2.6 10.1 0.1 0.0 0.0 348.9 2.6 Hungary 9302 60.2 0.6 6.0 0.1 0.0 0.0 66.2 0.7 Ireland 6980 0.0 0.0 12.0 0.2 0.0 0.0 12.0 0.2 Italy 30134 933.6 3.1 20.1 0.1 0.0 0.0 953.6 3.2 Latvia 6456 2.9 0.0 1.5 0.0 0.0 0.0 4.4 0.1 Lithuania 6530 3.4 0.1 0.0 0.0 0.0 0.0 3.4 0.1 Luxembourg 259 0.0 0.0 0.0 0.0 0.0 0.0 0.0 0.0 Malta 32 0.4 1.3 0.0 0.0 0.0 0.0 0.4 1.3 Netherlands 4154 0.0 0.0 0.0 0.0 0.0 0.0 0.0 0.0 Poland 31268 10.0 0.0 0.0 0.0 0.0 0.0 10.0 0.0 Portugal 8909 74.1 0.8 52.2 0.6 0.0 0.0 126.3 1.4 Romania 23839 88.5 0.4 3.3 0.0 1.7 0.0 93.5 0.4 Slovakia 4904 16.0 0.3 8.0 0.2 0.0 0.0 24.0 0.5 Slovenia 2027 0.0 0.0 0.0 0.0 0.0 0.0 0.0 0.0 Spain 49851 183.2 0.4 104.3 0.2 0.0 0.0 287.5 0.6 Sweden 43858 0.0 0.0 5.9 0.0 0.0 0.0 5.9 0.0 United Kingdom 24853 2.0 0.0 8.1 0.0 0.0 0.0 10.1 0.0 EU-27 total 430659 1944 0.5 281 0.1 3 0.0 2228 0.5
Deliverable 1.2; AGFORWARD (613520) 4 December 2015 Figure 10. Distribution of silvoarable agroforestry practices. Included are intercropped permanent crops (fruits, olives and nuts), woodland (intercropped forest trees) and scrubland with sparse tree cover.
Deliverable 1.2; AGFORWARD (613520) 4 December 2015 Figure 11. Hot spots for arable agroforestry in Europe. The dark blue areas indicate areas in Europe where arable agroforestry practices can be found in high densities.
Deliverable 1.2; AGFORWARD (613520) 4 December 2015
5.1.4 Livestock agroforestry systems
Agroforestry systems with livestock cover about 16.2 million hectares in Europe corresponding to about 3.8% of the territorial area in the EU (Table 4). The largest extent of livestock agroforestry systems can be found in the Mediterranean countries in Spain (5.8 million ha), France (1.6 million ha), Greece (1.7 million ha), Italy (1.3 million ha) and Portugal (1.2 million ha) (Table 4, Figure 12). The largest extent of livestock systems associated with permanent crops is found in Spain (217 thousand ha) and Portugal (122 thousand ha). The largest areas of livestock systems on woodland are found in Spain (3.5 million ha), Portugal (799 thousand ha), Greece (656 thousand ha), France (647 thousand ha) and Italy (622 thousand ha). The largest extent of livestock agroforestry on shrublands with sparse tree cover is found in Spain (587 thousand ha) and Greece (534 thousand ha). The largest extent of livestock agroforestry on grassland with sparse tree cover is found in Spain (1.2 million ha), France (746 thousand ha) and Romania (670 thousand ha). A surprising finding was that recreation areas in Europe contain a considerable extent of grazed areas; about 131 thousand ha for the whole EU 27. Grazing in recreation areas was most common in the UK, the Netherlands and Sweden. There is also a large area of (semi)-natural, unused and abandoned areas which are grazed by animals summing up to about 1.8 million ha for the whole EU 27. The hot spot analysis revealed that a high abundance of livestock agroforestry can be found in large areas of Portugal and Spain, south of France, Sardinia, south Italy, central and north-east Greece, south and west Bulgaria, and western Cyprus (Figure 13).
Deliverable 1.2; AGFORWARD (613520) 4 December 2015 Table 4. Extent of agroforestry for livestock systems in Europe based on LUCAS data. Included are agroforestry areas under permanent crops (fruit, nut and olive trees), woodlands, shrubland and grassland with sparse tree cover, recreation areas, and (semi-) natural, unused and abandoned areas.
Country Total
territorial area
Permanent crops Woodland Shrubland with sparse tree cover
Grassland with sparse tree cover
Recreation areas (Semi-) natural, unused and abandoned areas All silvopasture 1000 ha 1000 ha % 1000 ha % 1000 ha % 1000 ha % 1000 ha % 1000 ha % 1000 ha % Austria 8388 22.0 0.3 92.1 1.1 6.5 0.1 37.6 0.4 1.3 0.0 3.9 0.0 158.2 1.9 Belgium 3053 2.5 0.1 6.2 0.2 0.0 0.0 34.9 1.1 0.0 0.0 2.5 0.1 46.2 1.5 Bulgaria 11090 23.4 0.2 167.0 1.5 91.8 0.8 584.4 5.3 0.0 0.0 55.1 0.5 884.9 8.0 Cyprus 925 6.4 0.7 12.2 1.3 12.2 1.3 12.8 1.4 0.0 0.0 62.9 6.8 80.8 8.7 Czech Rep. 7887 7.2 0.1 31.5 0.4 0.0 0.0 5.7 0.1 0.0 0.0 1.4 0.0 45.8 0.6 Denmark 4290 0.0 0.0 8.7 0.2 1.2 0.0 5.0 0.1 2.5 0.1 16.2 0.4 29.9 0.7 Estonia 4523 0.0 0.0 8.2 0.2 0.0 0.0 6.2 0.1 0.0 0.0 4.1 0.1 14.4 0.3 Finland 33843 0.0 0.0 143.1 0.4 5.0 0.0 10.0 0.0 2.5 0.0 20.1 0.1 168.2 0.5 France 54397 53.9 0.1 647.0 1.2 106.4 0.2 746.3 1.4 7.1 0.0 134.8 0.2 1626.0 3.0 Germany 35713 35.8 0.1 114.5 0.3 10.0 0.0 97.4 0.3 10.0 0.0 27.2 0.1 277.8 0.8 Greece 13196 121.4 0.9 655.7 5.0 534.3 4.0 289.9 2.2 3.4 0.0 261.3 2.0 1717.5 13.0 Hungary 9302 0.0 0.0 12.0 0.1 2.0 0.0 22.1 0.2 0.0 0.0 4.0 0.0 40.1 0.4 Ireland 6980 0.0 0.0 94.2 1.3 24.0 0.3 106.2 1.5 2.0 0.0 100.2 1.4 308.5 4.4 Italy 30134 116.2 0.4 622.4 2.1 235.2 0.8 329.8 1.1 11.5 0.0 146.3 0.5 1336.5 4.4 Latvia 6456 0.0 0.0 13.1 0.2 0.0 0.0 10.2 0.2 0.0 0.0 0.0 0.0 23.4 0.4 Lithuania 6530 6.7 0.1 11.8 0.2 0.0 0.0 20.1 0.3 0.0 0.0 0.0 0.0 38.6 0.6 Luxembourg 259 2.4 0.9 2.4 0.9 0.0 0.0 2.4 0.9 0.0 0.0 0.0 0.0 7.2 2.8 Malta 32 0.0 0.0 0.0 0.0 0.4 1.3 0.0 0.0 0.0 0.0 0.4 1.3 0.4 1.3 Netherlands 4154 3.7 0.1 9.3 0.2 3.7 0.1 11.1 0.3 18.5 0.4 31.5 0.8 66.7 1.6 Poland 31268 11.5 0.0 38.7 0.1 1.4 0.0 47.3 0.2 2.9 0.0 22.9 0.1 106.1 0.3 Portugal 8909 122.7 1.4 799.1 9.0 44.9 0.5 139.7 1.6 1.2 0.0 81.4 0.9 1161.0 13.0 Romania 23839 73.5 0.3 93.5 0.4 41.7 0.2 669.5 2.8 1.7 0.0 43.4 0.2 908.2 3.8 Slovakia 4904 0.0 0.0 20.0 0.4 4.0 0.1 18.0 0.4 0.0 0.0 8.0 0.2 45.9 0.9 Slovenia 2027 3.8 0.2 16.3 0.8 7.5 0.4 27.5 1.4 0.0 0.0 1.3 0.1 55.0 2.7 Spain 49851 217.0 0.4 3520.0 7.1 587.6 1.2 1163.9 2.3 5.6 0.0 489.0 1.0 5756.3 11.5 Sweden 43858 2.0 0.0 279.7 0.6 9.8 0.0 172.1 0.4 13.7 0.0 11.7 0.0 473.4 1.1 United King’m 24853 14.2 0.1 243.4 1.0 50.7 0.2 239.3 1.0 46.7 0.2 314.4 1.3 851.9 3.4 EU-27 total 430659 846 0.2 7662 1.8 1781 0.4 4810 1.1 131 0.0 1843 0.4 16229 3.8
Deliverable 1.2; AGFORWARD (613520) 4 December 2015 Figure 12. Distribution of agroforestry for livestock systems. Included are permanent crops (fruits, olives and nuts), woodland, shrubland and grassland with sparse tree cover, recreation areas and unused (semi-) natural and abandoned areas with grazing.
Deliverable 1.2; AGFORWARD (613520) 4 December 2015 Figure 13. Hot spots for livestock agroforestry in Europe. The dark blue areas indicate areas in Europe where livestock agroforestry practices can be found in high densities.
Deliverable 1.2; AGFORWARD (613520) 30 September 2015
5.1.5 Total extent of agroforestry area in Europe
According to our estimate using the LUCAS database the total area under agroforestry in the EU 27 is about 24 million ha which is equivalent to about 5.7% of the territorial area or 14% of the utilised agricultural area (Table 5, Figure 14). Of our four studied systems, by far the largest area (20.3 million ha) is covered by high natural and cultural value agroforestry. Livestock agroforestry which overlaps to a large extent with high natural and cultural value agroforestry also covers with 16.1 million ha; a very large area in the EU. High value tree agroforestry and arable agroforestry cover 2.6 and 2.2 million ha respectively. The hot spot analysis revealed that a high abundance of areas under agroforestry can be found in south, central and north-east Portugal, south-west, central and parts of north Spain, south of France, Sardinia, Sicily and south Italy, central and north-east Greece, central and west Bulgaria, central and north Romania and western Cyprus (Figure 15).
Spain (6.9 million ha), France (2.6 million ha), Italy (2.3 million ha), Greece (2.1 million ha), Romania (1.9 million ha) and Portugal (1.8 million ha) have the largest absolute extent of agroforestry (Figure 16). However, if we look at the extent of agroforestry in relation to the utilised agricultural area (UAA), countries like Cyprus (78% of UAA), Portugal (49% of UAA) and Greece (40% of UAA) have the largest percentage of agroforestry cover (Figure 17). Some countries have a very small agroforestry cover such as Denmark, the Netherlands, Belgium, Luxembourg and Malta. This result is mainly due to their small size but is also an effect of a low percentage of the agricultural land covered by agroforestry. Some other countries do have some of their agricultural land under agroforestry in absolute numbers but the proportion of agroforestry area relative to the UAA is very low. This is the case in countries such as Poland, Germany, Denmark and the Czech Republic which have only 3-4% of their UAA under agroforestry.
Deliverable 1.2: AGFORWARD (613520) 5 December 2015 Table 5. Total extent of agroforestry in Europe based on LUCAS data.
Country Total territorial area Utilised Agricultural area (UAA)1
High natural and cultural value
agroforestry
High value tree agroforestry Arable agroforestry systems Livestock agroforestry system All agroforestry Estimated proportion of total territorial area Estimated proportion of UAA 1000 ha 1000 ha 1000 ha 1000 ha 1000 ha 1000 ha 1000 ha % % Austria 8388 2878 135.0 32.4 18.2 158.2 234.8 2.8 8.2 Belgium 3053 1358 67.6 2.5 0.0 46.2 79.9 2.6 5.9 Bulgaria 11090 4476 1144.8 91.8 80.1 884.9 1394.2 12.6 31.2 Cyprus 925 118 9.9 14.1 8.3 80.8 91.7 9.9 77.5 Czech Republic 7887 3484 85.7 10.0 2.9 47.2 108.7 1.4 3.1 Denmark 4290 2647 63.6 1.2 5.0 28.6 90.9 2.1 3.4 Estonia 4523 941 98.1 0.0 0.0 14.4 106.8 2.4 11.4 Finland 33843 2291 87.2 0.0 0.0 168.2 238.5 0.7 10.4 France 54397 27837 2104.9 178.8 146.1 1628.9 2629.2 4.8 9.4 Germany 35713 16704 559.1 45.8 21.5 276.3 602.8 1.7 3.6 Greece 13196 5178 1345.4 436.5 347.2 1699.0 2093.4 15.9 40.4 Hungary 9302 4686 216.6 60.2 66.2 40.1 300.9 3.2 6.4 Ireland 6980 4991 352.1 0.0 12.0 308.5 504.9 7.2 10.1 Italy 30134 12856 1514.5 1008.1 949.3 1335.1 2307.4 7.7 17.9 Latvia 6456 1796 95.0 2.9 2.9 32.1 111.0 1.7 6.2 Lithuania 6530 2743 227.5 10.1 5.0 26.9 243.5 3.7 8.9 Luxembourg 259 131 10.8 2.4 0.0 7.2 10.8 4.2 8.3 Malta 32 11 0.0 0.4 0.4 0.4 0.8 2.5 7.0 Netherlands 4154 1872 27.1 3.7 0.0 68.6 89.0 2.1 4.8 Poland 31268 14447 474.6 21.5 10.0 104.7 543.5 1.7 3.8 Portugal 8909 3668 1455.3 184.6 126.3 1159.8 1809.5 20.3 49.3 Romania 23839 13306 1699.0 161.9 93.5 906.6 1938.3 8.1 14.6 Slovakia 4904 1896 85.7 16.0 24.0 45.9 137.8 2.8 7.3 Slovenia 2027 483 109.5 3.8 0.0 56.3 117.6 5.8 24.4 Spain 49851 23753 5809.6 376.2 287.5 5757.7 6893.5 13.8 29.0 Sweden 43858 3066 525.6 2.0 5.9 471.4 667.0 1.5 21.8 United Kingdom 24853 16882 799.8 16.2 10.1 841.8 1075.0 4.3 6.4 EU-27 total 430659 174499 20337 2683 2223 16196 24421 5.7 14.0 1
Deliverable 1.2: AGFORWARD (613520) 5 December 2015 Figure 14. Total extent of agroforestry in Europe based on LUCAS data.
Deliverable 1.2: AGFORWARD (613520) 5 December 2015 Figure 15. Agroforestry hot spots in Europe. The dark blue areas indicate areas in Europe where agroforestry practices can be found in high densities.
Deliverable 1.2; AGFORWARD (613520) 5 December 2015 Figure 16. Estimated extent (x 1000 ha) of area covered by agroforestry in the EU27.
Figure 17. Estimated extent of agroforestry as a proportion of the Utilised Agricultural Area in the EU27.
5.2 Agroforestry likelihood
Based on our analysis on the probability of observing a LUCAS agroforestry point inside a particular CORINE class, an agroforestry likelihood map could be constructed (Figure 18). The highest likelihood of observing agroforestry was in Portugal, Spain, Italy, Cyprus, Bulgaria and Romania. In most countries agroforestry was associated with the CORINE land cover classes: agricultural land with significant natural vegetation (26 countries), non-irrigated arable land (25 countries), pastures (24 countries), coniferous forest (22 countries), mixed forest (20 countries) and complex vegetation patterns (20 countries) (Table 6). These land cover classes were associated with agroforestry all around Europe. However, the likelihood of observing agroforestry in these land cover classes was quite low ranging from about 2 to 9%. The CORINE land cover classes agroforestry areas, olive groves, annual crops associated with permanent crops, vineyards, fruit trees and berry plantations
0 1000 2000 3000 4000 5000 6000 7000 8000 A re a ( x 1000 h a) 0 10 20 30 40 50 60 70 80 90 Pr o p o rtion o f UA A (% )
Deliverable 1.2; AGFORWARD (613520) 5 December 2015 had the highest agroforestry likelihood ranging from about 12 to 61%. These land cover classes were associated with agroforestry mostly in the Mediterranean, south-eastern and central Europe. The analysis also provides us information what kind of agroforestry practices are associated with a particular land cover in the different European countries. For example, in Bulgaria we observed high agroforestry likelihood (30.6%) on the CORINE land cover “231 pastures”, indicating that agroforestry in Bulgaria is often associated with wood pastures. In Italy, the CORINE class “222 fruit trees and berry plantations” has a high agroforestry likelihood (32.6%), indicating that in Italy grazed and intercropped fruit tree orchards are a frequently found agroforestry practice. In the Netherlands, the highest agroforestry likelihood (17.9%) was observed on the CORINE class “322 Moors and heathlands” indicating that sheep grazing on heathland is a common practice in this country. In Sweden, the classes “231 pastures” and “311 broad-leaved forests” had the highest agroforestry likelihood (19.3% and 16.9% respectively), indicating that the most common agroforestry practices in Sweden are the Scandinavian wood-pastures in southern Sweden and reindeer grazing in the mountain birch forests in the North.
Deliverable 1.2: AGFORWARD (613520) 5 December 2015 Table 6. Agroforestry likelihood expressed as the probability observing a LUCAS agroforestry point inside a particular CORINE land cover class in the
countries for which both LUCAS and CORINE data were available. See also Appendix B for more detailed information.
142 Sp o rt an d lei su re f aciliti es 211 N o n -irrigated a ra b le la n d 212 Per m an en tly irriga ted la n d 213 Ric e fi eld s 221 Vin ey ar d s 222 Fru it tree s a n d b erry p lan ta tio n s 223 Oliv e gro ve s 231 Pa stu re s 241 An n u al crop s a ss o ciated w ith p erm an en t crop s 242 Co m p le x ve ge ta tio n p at tern s 243 La n d p rin cipa lly o ccup ie d b y agricu ltu re , with si gn if ican t ar eas o f n at u ra l v ege ta tio n 244 Agrofor e stry a re as 311 Broa d -l eav ed fore st 312 Con if ero u s for es t 313 Mix ed fore st 321 N at u ra l gra ss lan d s 322 Mo o rs a n d h eat h lan d s 323 Scl ero p h yllou s v ege ta tio n 324 T ra n sitio n al w o o d lan d -s h ru b 334 Bu rn t ar eas Austria 7.8 0.4 11 5 2.5 7.8 1 2.1 2.5 1.1 1.1 Belgium 0.2 1.4 2.8 1.3 1.2 Bulgaria 4.4 28.7 20.5 30.6 24.8 20.8 2.9 5 3.9 20.9 13.4 Cyprus 5.1 10.2 9.1 8.2 19.6 54.8 17.9 5.3 13.8 4.6 22.8 19.9 8.1 Czech Republic 0 4.7 1.2 0 2 0.8 0.5 Denmark 2 0.3 2.2 2.5 0.7 0.9 4.7 5 3.1 Estonia 0.3 0.8 1.1 0.3 Finland 0.6 0.6 0.7 0.6 0.4 France 3 0.8 8.4 6.6 31.4 7.7 5.3 8.8 3 2.4 2.6 8.4 13.3 5.8 6.2 Germany 0.5 1.1 3.5 1.6 1.2 2.7 0.8 0.6 1 2.5 2.6 Hungary 5.9 0.3 12.3 24.5 1.8 0.8 2.7 0.5 2 2.7 1.5 Ireland 1.9 3.6 9.6 2.7 6.8 11.3 3.6 8.2 Italy 4 0.5 7.6 32.6 27.5 9.8 25 7.7 12 42.6 5.7 1.8 3.6 8.4 2 12.4 10.7 Latvia 0.6 0.5 0.5 0.3 0.3 0.5 0.3 0.7 Lithuania 0.4 19.3 0.8 1.4 2 0.2 Luxembourg 3.8 6.4 2.6 10.8
Deliverable 1.2: AGFORWARD (613520) 5 December 2015 142 Sp o rt an d lei su re f aciliti es 211 N o n -irrigated a ra b le la n d 212 Per m an en tly irriga ted la n d 213 Ric e fi eld s 221 Vin ey ar d s 222 Fru it tree s a n d b erry p lan ta tio n s 223 Oliv e gro ve s 231 Pa stu re s 241 An n u al crop s a ss o ciated w ith p erm an en t crop s 242 Co m p le x ve ge ta tio n p at tern s 243 La n d p rin cipa lly o ccup ie d b y agricu ltu re , with si gn if ican t ar eas o f n at u ra l v ege ta tio n 244 Agrofor e stry a re as 311 Broa d -l eav ed fore st 312 Con if ero u s for es t 313 Mix ed fore st 321 N at u ra l gra ss lan d s 322 Mo o rs a n d h eat h lan d s 323 Scl ero p h yllou s v ege ta tio n 324 T ra n sitio n al w o o d lan d -s h ru b 334 Bu rn t ar eas Malta 100 Netherlands 3.5 0.7 1.6 2.5 4.3 1 3.5 7.9 17.9 Poland 0.2 1.1 0.6 1.4 1 0.3 0.3 3.3 4.7 Portugal 10.6 15.6 2.4 9.5 2.7 9.9 28.6 8.8 12.1 9.7 8.3 64.2 27.3 3 8.2 13.3 7.7 4.8 4.5 Romania 1.6 15.2 16.9 13.4 6.3 11.6 2 0.5 0.1 3.7 7.5 Slovakia 0.4 42.4 4.4 6.3 4.9 1.3 0.8 0 1.9 Slovenia 8 12.9 2.2 11 1 0.8 6.1 2.8 Spain 3 2.4 1.7 5.6 7.8 16.5 14.2 5.8 8.7 75.2 17.6 7.4 6.4 20.5 7.2 11.4 15.4 5.2 Sweden 1.9 19.3 6.7 10.2 16.9 2.3 9.6 0.2 7 United Kingdom 0.8 3.8 4.4 8.3 3.3 2.8 7.2 8.1 No. of countries where agroforestry is associated with this CORINE land
cover class 6 25 3 2 11 12 5 24 4 20 26 3 15 22 20 15 10 5 17 1
Agroforestry
Deliverable 1.2: AGFORWARD (613520) 5 December 2015 Figure 18. Agroforestry likelihood based on the probability of observing a LUCAS agroforestry point in a certain CORINE land cover class.
Deliverable 1.2: AGFORWARD (613520) 5 December 2015
5.3 Hedgerows and isolated trees
5.3.1 Single tree, single bushes agroforestry systems
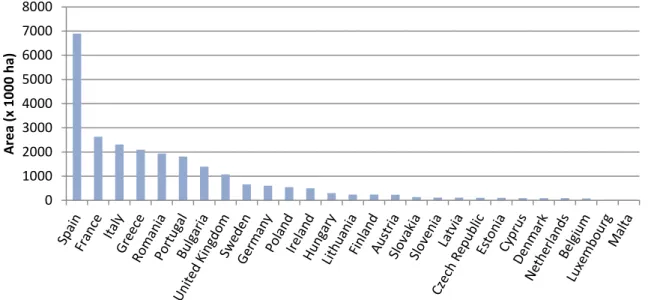
Agroforestry involving single trees cover almost 300 thousand hectares corresponding only around 0.02% of the territorial area in the EU (Table 7, Figures 19 and 20). The largest extent of agroforestry with single trees, single bushes can be found in France (55.9 thousand ha)) followed by Spain (44.3 thousand ha) and UK (35.9 thousand ha). In terms percentage Malta (0.46%) and UK (0.15%), and Portugal (0.11%) are the countries with the highest density of single trees and single bushes.
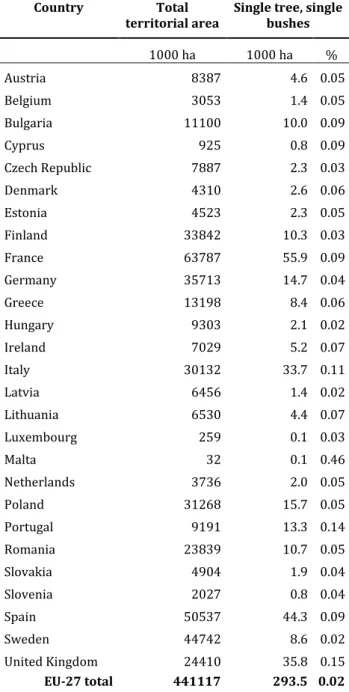
Table 7. Extent of single tree and single bushes in Europe based on LUCAS data
Country Total
territorial area Single tree, single bushes
1000 ha 1000 ha % Austria 8387 4.6 0.05 Belgium 3053 1.4 0.05 Bulgaria 11100 10.0 0.09 Cyprus 925 0.8 0.09 Czech Republic 7887 2.3 0.03 Denmark 4310 2.6 0.06 Estonia 4523 2.3 0.05 Finland 33842 10.3 0.03 France 63787 55.9 0.09 Germany 35713 14.7 0.04 Greece 13198 8.4 0.06 Hungary 9303 2.1 0.02 Ireland 7029 5.2 0.07 Italy 30132 33.7 0.11 Latvia 6456 1.4 0.02 Lithuania 6530 4.4 0.07 Luxembourg 259 0.1 0.03 Malta 32 0.1 0.46 Netherlands 3736 2.0 0.05 Poland 31268 15.7 0.05 Portugal 9191 13.3 0.14 Romania 23839 10.7 0.05 Slovakia 4904 1.9 0.04 Slovenia 2027 0.8 0.04 Spain 50537 44.3 0.09 Sweden 44742 8.6 0.02 United Kingdom 24410 35.8 0.15 EU-27 total 441117 293.5 0.02
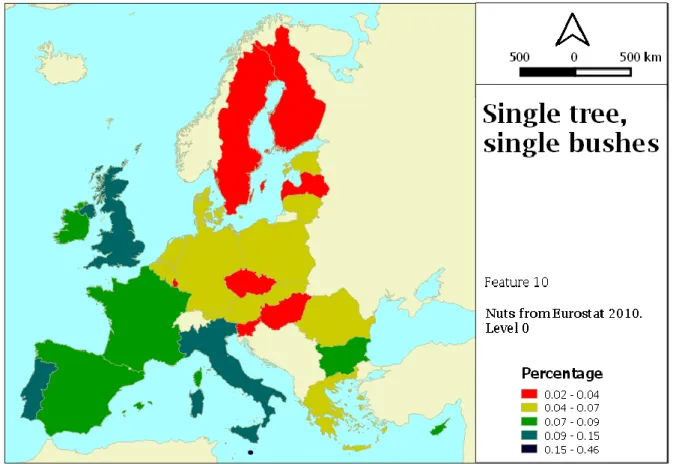
Deliverable 1.2: AGFORWARD (613520) 5 December 2015 Figure 19. Single trees and single bushes cover (percentage)
Deliverable 1.2: AGFORWARD (613520) 5 December 2015 Agroforestry involving hedgerows cover about 1.78 million hectares representing around 0.42% of the territorial area in the EU (Table 8, Figures 21 and 22). The largest extent of agroforestry with hedgerows can be found in France (598 thousand ha)) followed by UK (240 thousand ha) and Italy (168 thousand ha) (Table 8). In terms of percentage, Ireland (1.6%), UK and France (around 1%) are the countries with the highest hedgerows surface.
The hedgerows were split in four classes (Avenue trees, Conifer hedgerows, hedgerows managed, and hedgerows deriving from abandonment). The second (Conifer hedgerows) has the lower cover (only 11.7 thousand ha, the 0.002 % of the whole area) among the selected hedgerows features; having the rest a similar cover (from the 0.08 to 0.19 %) (Table 8).
Avenue trees cover around 769.7 thousand hectares corresponding to 0.19% of the territory of the EU (Table 8). The largest extent of avenue trees can be found in France (312.9 thousand ha) followed by Poland (78.2 thousand ha) and Italy (57.9 thousand ha) (Table 8). In terms of percentage, Belgium (0.64%), The Netherlands (0.59%), and France and Luxembourg (0.49%) are the countries with a highest density of avenue trees.
The largest extent of agroforestry with conifer hedges can be found in France (3.2 thousand ha)) followed by Spain (1.9 thousand ha) and Finland (1.7 thousand ha) (Table 8). Austria (0.008%), Belgium (0.006%), and France, Finland and Cyprus (0.005%) are the countries with the highest density of conifer hedges.
Managed hedgerows cover 421 thousand hectares representing around 0.08% of the territorial area in the EU (Table 8). The largest extent of agroforestry with managed hedgerows can be found in France (150.9 thousand ha), followed by UK (146.3 thousand ha) and Italy (35.6 thousand ha) (Table 8). The UK (0.6%), Ireland (0.37%), and France (0.24%) are the countries with the highest density of managed hedgerows.