w w w . e l s e v i e r . e s / e r m b e
Leveraging a luxury fashion brand through social media
Maria Teresa Romão
a, Sérgio Moro
b,∗, Paulo Rita
c, Pedro Ramos
b,d aInstituto Universitário de Lisboa (ISCTE-IUL), Lisboa, PortugalbInstituto Universitário de Lisboa (ISCTE-IUL), ISTAR-IUL, Lisboa, Portugal
cNOVA Information Management School (NOVA IMS), Universidade Nova de Lisboa, Campus de Campolide, 1070-312 Lisbon, Portugal dInstituto Universitário de Lisboa (ISCTE-IUL), IT-IUL, Lisboa, Portugal
a r t i c l e i n f o
Article history:Received 3 June 2018
Received in revised form 5 October 2018 Accepted 19 October 2018
Available online 19 November 2018 JEL classification: M31 M37 Keywords: Social media Social networks Luxury marketing Brand image Data mining
a b s t r a c t
This research aims to understand how the interactions across several social networks influence the visibility of a luxury brand’s most relevant social network which acts as a showcase (Instagram).
A data mining approach is proposed for modeling the number of likes on Instagram using 365 posts published in the luxury brand’s different social networks between 2015 and 2016. Fifteen features related with the brand’s social networks, product characteristics and visibility in external media were prepared and used to feed a support vector machine model which achieved an adequate performance (mean absolute percentage error of 27%). A sensitivity analysis was applied to reveal how each of the fifteen features influenced the Instagram likes. The findings unveiled interactions on the remaining networks hold an influence on Instagram likes, particularly Facebook, with the number of video views, the positive emoticons, and the number of comments and shares explaining around 40% of the model.
© 2018 AEDEM. Published by Elsevier Espa ˜na, S.L.U. This is an open access article under the CC BY-NC-ND license (http://creativecommons.org/licenses/by-nc-nd/4.0/).
1. Introduction
The phenomenon of social media marketing (SMM) has only been developed within the last decade and it is focused mainly on the impact that social media has on consumer behavior (Campbell, Ferraro, & Sands, 2014). Regarding SMM applied to luxury brands, several studies have investigated the effects that SMM has on consumer feedback (Kedzior, Allen, & Schroeder, 2016), brand awareness and attitude (Langaro, Rita, & Salgueiro, 2018), and also on brand commitment and loyalty (Tong, Su, & Xu, 2018). Addition-ally, each person is usually present in a few social networks and can read the same message from a brand in each of those networks (Zhang, Tang, Yang, Pei, & Yu, 2015). Yet, despite each network hav-ing its own characteristics, this omni-present user effect can create a chain of consequences leading the interactions in one network to influence the remaining ones. However, in the context of social media marketing for luxury brands little is known regarding such
∗ Corresponding author.
E-mail addresses:teresagromao@gmail.com(M.T. Romão),scmoro@gmail.com (S. Moro),prita@novaims.unl.pt(P. Rita),pedro.ramos@iscte-iul.pt(P. Ramos).
influence, especially when a brand displays its products mainly on one social network.
Josefinas is a luxury brand that offers exclusive women’s fashion accessories. To Josefinas, social networks are able to build aware-ness, spread advertising, and also build a relationship with their customers. Josefinas brand was created in 2013 targeting the spe-cific shoes luxury market. By emerging from the start as a full digital company, Josefinas contrasts with large luxury brands which have been more often studied (Link Humans, 2015). The brand is also an excellent example of a small enterprise that reaches across the globe to sell its luxury products. Hence, it was selected for this study, which aims to find out how the interactions in different social networks impact the visibility of Josefinas’ brand and prod-ucts in Instagram, which serves as the showcase for their prodprod-ucts. The knowledge unveiled will contribute to support decisions asso-ciated with the management of the channels used by the brand to display its products and also to understand online consumers. More specifically, the main goal is to build a quantitative model that is able to measure the impact on a social network based on data from other social networks (e.g., Facebook, Pinterest), brand’s visibility in external media (e.g., magazines) and products’ features (e.g., price).
https://doi.org/10.1016/j.iedeen.2018.10.002
2444-8834/© 2018 AEDEM. Published by Elsevier Espa ˜na, S.L.U. This is an open access article under the CC BY-NC-ND license (http://creativecommons.org/licenses/by-nc-nd/4.0/).
2. Theory
2.1. Decision support based on social media data
The uniqueness of social media data requires the use of data mining techniques that are able to effectively extract and analyze user generated content. The big data available from social media has the potential to unfold interesting findings in the Marketing domain (Amado, Cortez, Rita, & Moro, 2018; Canito, Ramos, Moro, & Rita, 2018). The study and development of these techniques belongs to a discipline that emerged from data mining: social media mining (Zafarani, Abbasi, & Liu, 2014). Social media data tends to appear mainly in the form of written contents (e.g. status updates, com-ments in reviews or social groups, conversations with other users), and in the form of likes or dislikes, shares, tags, hashtags, emoti-cons, video messages, personal information (e.g., number of friends, citizenship, gender) and rating scores (Kennedy, 2016).
Table 1displays four studies that adopted different approaches to extract knowledge for decision support from social media sites related to luxury and fashion brands. In the last row, the charac-teristics of this research are presented, so that a comparison can be made. These studies were chosen to represent different approaches on research areas closely related with data mining applied to the luxury and fashion industry.
2.2. Support vector machines and sensitivity analysis
The information and knowledge extracted from data can be used to make valid predictions and to improve decision making (Silva, Moro, Rita, & Cortez, 2018). Support vector machines (SVM) are supervised black-box data mining methods, being popular tools for both classification and regression analysis. SVM are rarely used in areas where interpretability is important and, thus, improving it will enhance their acceptance and understanding by domain users. The SVM model receives as inputs a list of x1. . .xn features and
transforms the corresponding space encompassing each feature (i.e., xi∈ M) into a m-dimensional feature space through applying
a nonlinear mapping based on a kernel (Moro, Rita, & Vala, 2016). In this new space, the model then identifies the best linear sepa-rating hyperplane based on a list of support vector points (thus, its name).
In order to be able to extract useful information from black-box models such as SVM, one can use a sensitivity analysis approach. The sensitivity analysis is a technique that assesses how sensitive is the model (i.e., how much is the output variation) when the input features are assorted through their range of possible values. The simplest sensitivity analysis changes one input feature while keep-ing the remainkeep-ing ones’ constant. This implies that input features’ influence on each other is not accounted for. Conversely, the most complex sensitivity analysis implies changing all input features through their possible range of combinations, which deems such procedure to be computationally demanding, making it only fea-sible for a few input features. To address both limitations,Cortez and Embrechts (2013)proposed the data-based sensitivity analy-sis (DSA), which starts by extracting a randomly selected subset from the original training dataset. Then, DSA changes simultane-ously each of the input features through the possible values within the subset to assess output variation. As such, DSA is less computa-tionally demanding when compared to varying all features, while it addresses input features’ influence on each other. DSA has been used successfully in several different studies (e.g.,Moro, Cortez, & Rita, 2017; Moro, Cortez, & Rita, 2018) and therefore it was also adopted for the present research.
2.3. The interactions across social networks
Marketers are increasingly using social media within their brand strategy in order to raise brand awareness, create engagement, and increase conversions for their brands and products (Bento, Martinez, & Martinez, 2018). Due to the great use of social networks, luxury brands and customers are communicating with each other without any restriction in time, place, and medium, making it a two-way communication (Kim & Ko, 2012). The result of this strat-egy is that photos and videos are cross-shared between Twitter, Facebook, Instagram and Pinterest. Consumers see the same prod-ucts, and the same carefully crafted posts, pins and tweets on each channel. Platforms such as Instagram, built on the power of visual storytelling, have facilitated luxury brands’ online engagement, due to their visual characteristic that complements the esthetic stan-dards of many top brands (Dahlhoff, 2016).
The worldwide use of several social networks by users and sub-sequent investments by brands has led researchers to study the interactions across those networks.Phua, Jin, and Kim (2017)found that Instagram users have the highest brand engagement and com-mitment when compared to Facebook, Twitter, and Snapchat. Such finding supports Josefinas strategy of using Instagram as its show-case.Waterloo, Baumgartner, Peter, & Valkenburg (2018)identified perceived user differences when expressing both positive and neg-ative emotions on Facebook, Twitter, Instagram, and WhatsApp. Thus, both the abovementioned studies concur to current social networks’ heterogeneity both from a user and brand perspectives. Likewise,Kaya and Bicen (2016) confirm previously cited stud-ies. Such findings lead us to hypothesize that each social network where a brand is present exerts an influence on the remaining ones, considering that nowadays users are present in the most widely adopted networks (Zhang et al., 2015). Therefore, the following two research questions emerge: (1) is there an influence of user interactions in a brand’s social network on another network? (2) is it possible to unveil which features contribute the most to such influence?
To the best of our knowledge, this research, where interac-tions between different social networks are measured, has never been conducted. The approach adopted in this research brings new insights for literature on branding, by showing how brands can leverage multiple social networks and take advantage in favor of the brand’s image.
3. Data
Josefinas is venturing into an omni-channel approach since it started to be a pure e-commerce company and then decided to sell its products in a physical store. The brand is present online on Insta-gram, Facebook, Twitter, Pinterest, Snapchat, Tumblr and Google+, apart from its website (https://josefinas.com/). In order to go fur-ther with Josefinas’ digital strategy, this research adopted a data mining approach, by building a model based on relevant data for the problem addressed. The posts from both Josefinas’ Facebook pages, Instagram account, Twitter, Google+ and Pinterest were collected for over a year between September 1, 2015 and October 31, 2016. This data collection resulted in 588 promotional posts exclusively published by Josefinas on its homepages in the social networks where it operates. However, Josefinas does not publish the exact same content across their different social networks since some pub-lications are not appropriate for all social networks. Annex 4 shows the number of collected posts in each social network. Only the pub-lications that were common between the English and Portuguese Facebooks along with Instagram were considered, since those rep-resent the most valuable and used social platforms by the brand. From this latter group, 365 common posts were identified and then
Table 1
Data-driven social media studies.
Reference Problem category Metrics used Approach
Ananda, Hernández García, & Lamberti (2015)
Analysis of two luxury fashion brands (Gucci and The Bridge) in order to understand how luxury fashion brands translate their SMM strategy to Actions.
Facebook (n◦of likes, comments) and Twitter (n◦of tweets, retweets and replies) posts
RENL Framework
Parrott, Danbury, & Kanthavanich (2015)
Analysis of brand
advocacy behavior within luxury brand accessory forums.
Blog texts
and audience comments from fashion forums
Netnography and Text mining
Park, Ciampaglia, & Ferrara (2016)
Prediction of which fashion models will become famous in the age of Instagram.
Data from Fashion Model Directory (name, hair color, eye color, height, hip size, etc.) and from Instagram (n◦of likes and comments)
Sentiment Analysis and Regression Analysis
Moro et al. (2016) Predictions of Facebook performance of a Cosmetic Company.
Facebook posts Data Mining
Present study Find the impact that several social networks have on the visibility of a luxury brand’ products in its most relevant social network.
Nr. of likes on Instagram Data Mining
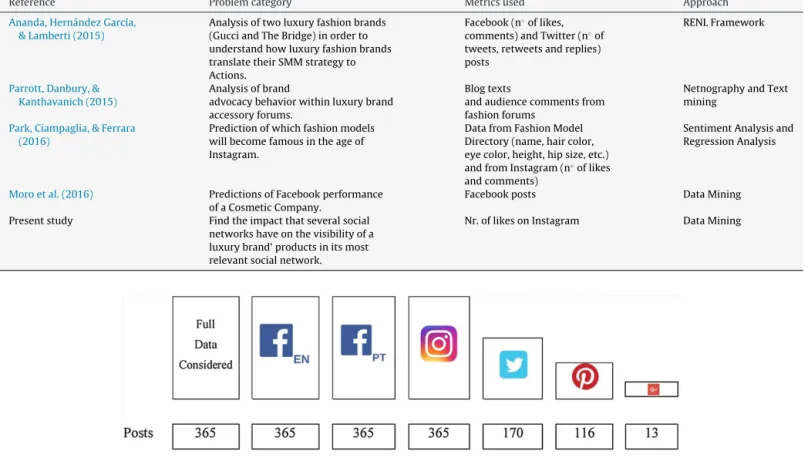
Fig. 1. Publications considered from each social network.
analyzed in order to determine how many of these were present across the remaining social networks (Fig. 1). Thus, out of the 588 initially collected publications, both Facebook pages and Instagram accounted for 365, Twitter accounted for 170, Pinterest 116 and Google Plus just 13. Both Snapchat and Tumblr were less adopted by Josefinas when compared to the remaining social media chan-nels. Annexes 5 to 8 show snapshots of Josefinas’ Instagram and Facebook in order to understand from which publication area the features were extracted. All the collected information is publicly available in each data source and any user can view it, facilitating the data collection procedure. Thereafter, it was necessary to pre-pare it and analyze the features that were likely to provide relevant hints for modeling “Instagram likes”. Thus, Annex 1 describes the meaning of each feature used for modeling and identifies its origin, which can be “source” or “computed”. The term “source” is used to describe the features that remain exactly as they were collected, while “computed” refers to the features that were calculated based on the “transformed” ones. From the sixty-seven initially collected features (listed in Annex 2), only fifteen were considered adequate to be modeled, as shown in Annex 1. The result is a tuned dataset of 365 publications characterized by fifteen features, ready to feed the modeling procedure.
4. Methods
A k-fold cross-validation procedure was conducted to evaluate the quality of the model built on the data as well as to provide an accurate estimate of the performance of the predictive model in practice (Rodriguez, Perez, & Lozano, 2010). Annex 9 exempli-fies such procedure. The dataset was divided into 10 folds, which resulted in 328 outcomes (90%) used for training the model and 37 outcomes (10%) for testing it, thus assuring independence of
the split between train and test data (Kuhn & Johnson, 2013). As a result, the procedure encompassed ten iterations for modeling and testing the built model, by varying the fold of data used for train-ing and then computtrain-ing model accuracy, based on the predicted number of “Instagram likes” for every record in the dataset (one per publication in the social networks). Since the SVM implements a non-linear complex model and to further ensure the evaluation of its ability to fit training data, the 10-fold cross-validation was conducted twenty times, with the final outcome resulting from the average of the twenty executions. Two metrics were chosen for measuring model accuracy: the MAE (Mean Absolute Error) and the MAPE (Mean Absolute Percentage Error). The former computes the average of all absolute differences between the actual and the predicted values, being a measure of the deviation of the capacity that the model has when predicting the correct value, while the lat-ter is a percentage of that deviation (Kim & Kim, 2016). Assuming SVM is able to achieve adequate results as measured through both MAE and MAPE, the DSA was applied to show the relevance of each feature in terms of their contribution to the model.
5. Results and discussion
Modeling performance was first assessed using an evaluation scheme including a realistic 10-fold cross-validation procedure for testing the model with unforeseen data, which was ran twenty times (Annex 9). Annex 3 presents five randomly selected samples of the publications used to feed the model, showing the information for each feature (data is organized vertically for space optimization purpose). This annex also shows the “real” and “predicted” outcome and the “absolute difference”. The “real” is the real value of “Insta-gram Likes” whereas the “predicted” shows the values predicted by the model being an average of the 20 executions of the procedure.
The “absolute difference” corresponds to the absolute difference between real and predicted values while the “% difference” shows the ratio between the absolute difference and the real value (i.e., % difference =| real − predicted | / real).
By calculating the average absolute deviation of Instagram likes, the support vector machine achieved a MAE of 109.512. More-over, MAPE achieved a percentage value of 27.15%, which indicates that the average of Instagram likes predicted deviates 27.15% from the real value. Considering that these results demonstrate that the model is not completely accurate to predict each Instagram like (which can also be seen through the five cases exemplified in Annex 3), these outcomes also provide evidence that the model consti-tutes a valid approximation for modeling the number of Instagram likes, since the MAPE predicted resulted in a similar value when compared to other studies (e.g.,Moro et al., 2016).
The knowledge discovery phase is perceived to provide insights regarding the features that influence the number of likes on Josefinas’ Instagram. Therefore, understanding the users’ motives to “like” a publication on the Instagram of a luxury fashion brand can ultimately leverage managerial decision support in luxury marketing. Thus, understanding the factors that influence why there is interaction with a certain publication on Instagram can be valuable for marketers to know what actions should be taken to increase this interaction and also to understand how to manage the remaining social media used by the brand to drive toward success and reach users’ expectations. Table 2presents the percentage relevance of each of the fifteen features. As the values reveal, this percentage indicates small values, particularly for the features located on the last columns. Results point out that no feature is significantly more relevant than the remaining ones. Therefore, there is not a single feature that generates greater visibility on this social network. However, it is possible to identify two features that stand out the most, which are the number of products and the Facebook video views. The number of products presented on each publication contributes with an influence of 13.75% on Instagram likes, while the Facebook video views hold a relevance of 12.88%. Next, five relevant features are scrutinized. Considering these six features are all numeric and a large portion of them are extracted from Facebook, a common tendency between all of them is that as the value of those features increase, the number of likes on Josefi-nas’ Instagram tends to decrease. A plausible explanation for this phenomenon is that Facebook has about over 1 billion more active users than Instagram and, in the case of Josefinas, Facebook has more 50 thousand followers than Instagram, even though the latter is their premium social network. Also, Facebook offers much more options than Instagram, such as different reactions to posts, event creation, status update, live streaming videos, while Instagram features concern likes, comments and views on posts and instant or live videos (feature named Instagram stories). These differences prove the wider scope of Facebook, which centralizes more infor-mation for users. However, it all depends on how users interact and use these social networks, as a survey conducted by Facebook IQ in 2016 pointed out: “Facebook better satisfies people’s need for empowerment, recognition and connection, and Instagram more strongly fulfills their desire for fun, relaxation and discovery”. The survey also showed that Facebook is more about sharing reactions and opinions whereas Instagram is more about inspiring and sharing behind-the-scenes content. Additionally, both Instagram and Facebook feeds differ, as in Facebook, the more a user interacts with another person or page, the more publications from these will be shown to the user (Facebook Newsroom, 2017), whereas on Instagram the feed only shows contents related to accounts (friends or brands) that users previously followed. Moreover, Instagram is a company owned by Facebook and, consequently, newsfeeds of both brands are controlled by Facebook. In this way and to follow its
ide-als, Facebook might not show the same posts to a user on Facebook Table
2 List of figures and its relevance. Features nr.products fb.video. views fb.shares fb.comments nr.days. since.publish positive. emoticons prod.price nr.days. mag.next price. base nr.days. evt.next pi.pins nr.days. mag.last nr.days. evt.last fb. followers tweet Total Relevance 13.75% 12.88% 10.37% 9.64% 8.12% 7.39% 6.88% 6.75% 5.82% 5.74% 4.81% 3.61% 2.82% 1.41% 0.01% 100.00%
Fig. 2. Influence of “Number of Products” on “Instagram likes”.
and Instagram, which means that if a user sees a brand’s post in Facebook (s)he might not see it on Instagram and vice versa, helping to promote every brand that is contracting advertising services.
The number of products presented on each publication is the feature that most influences the number of Instagram likes (Fig. 2). The main finding is that the number of likes has the tendency to decrease as the number of products presented on the publication increases above nine. However, a number of products displayed on the same publication below three seems to have the opposite effect. This behavior might be explained in part by the fact that when a user sees too many products on the same publication, his/her attention gets dispersed and (s)he cannot focus on one product and appreciate it, which turns users more demanding when interacting with a publication.
Regarding the number of views from Facebook videos, the num-ber of likes on Instagram tends to decrease as the numnum-ber of visualizations increases (Fig. 3). According toAn and Harvey (2016), video is the most effective form of marketing communications. Since the introduction of videos on Facebook platform, photo reach has been declining. When a brand does a video post instead of a photo, there is, on average, a 135% increase in organic reach, turning Facebook video one of the best ways to deliver content to an audience that privileges interaction and involvement. Another important characteristic of video on social networks, such as Face-book and Instagram, is the potential to reach digital consumers in the format that most closely resembles television, which is still the preferred choice for overall viewing and it is heavily consumed among adults of all ages (Nielsen, 2016). When comparing gen-erations, millennials are more eager for video content than older generations and more likely to follow content related to fash-ion, beauty and interior design on Instagram than on Facebook
(Facebook IQ, 2016). Despite the great number of views on Facebook videos, the same videos on Instagram have less interaction, which can be explained by the fact that Josefinas’ videos on Instagram are much shorter than the ones on Facebook. Also, on Instagram people scroll very fast, making them pay attention only to the photos and not interacting with videos.
Individuals can take a series of actions on Facebook when engag-ing with a brand. They can like or react to a post, comment on another and share the other (Kim & Yang, 2017). Regarding reac-tions, an extension of the like button, users can express their sentiments (love, haha, wow, sad and angry) toward a publica-tion. Furthermore, commenting provides users the opportunity to express their opinions through debate with others while sharing is considered the most valuable form of user engagement for brands, considering its potential for viral redistribution (Larsson, 2017). Liking a post requires less commitment than commenting or shar-ing. Clicking is enough to like, while comments and shares demand additional actions and extra commitment (Kim & Yang, 2017).
From Figs. 4–6, one can observe the impact of these three behaviors (reactions, comments and shares) related with Josefinas’ Facebook. People’s engagement with a brand’s posts, through react-ing, commenting or sharreact-ing, result in electronic word-of-mouth (eWOM), since their actions are visible and spread to an entire network of friends (Hoffman & Fodor, 2010). Through social net-works, consumers have the opportunity to share information about their consumption experience and to spread advice regarding prod-ucts and brands in a genuine process. In addition, when eWOM, besides verbal information, is complemented by visual informa-tion, it not only improves the message quality and credibility but also increases consumers’ interest and purchase intention of products (Lin, Lu, & Wu, 2012). When consumers are gathering
Fig. 4. Influence of Facebook’s “Positive Emoticons” on “Instagram Likes”.
Fig. 5. Influence of “Facebook Comments” on “Instagram likes”.
Fig. 6. Influence of “Facebook Shares” on “Instagram likes”.
pre-purchase information, constructing their perception of brand image or intending to do a purchase, the information provided by eWOM on social networks can be crucial to influence them. Accord-ing toPwC (2016), (45)% of digital buyers worldwide consider that social media influences their digital shopping behavior, through the reading of reviews, comments and feedback. Also, online lux-ury consumers have high levels of trust toward online customer reviews (Liu, Burns, & Hou, 2013), which reduces uncertainty and improves the efficiency of consumers’ online searches before pur-suing an actual purchase (Dwyer, 2007).
Regarding Josefinas, positive emoticons - likes, loves, aha and wow–(Fig. 4), comments (Fig. 5) and shares (Fig. 6) on Facebook tend to increase as the number of likes on Instagram increases until it reaches a plateau (e.g., for the emoticons, that value is around 500 Instagram likes) and then begins to decrease and remain constant, except for the sharing of content that has a slightly dif-ferent behavior. The performance of these features indicates that when a new Josefinas’ publication is made, the user’s interaction
on Instagram is almost instantaneous, generating a considerable amount of likes, whereas on Facebook users interaction is devel-oped during a certain time and people enjoy commenting, sharing and using emoticons on the publication. As Facebook covers a larger population of users when compared to Instagram, it is normal that when a user interacts with a Josefinas’ post, his/her friends will see it on their newsfeed, increasing the likelihood of the last ones also interacting with it. Therefore, as Josefinas’ posts propagate across different users’ Facebook newsfeed, it happens that more reac-tions to the publicareac-tions occur and remain during a long period of time.
By exploring how the interactions in several social networks influence the visibility of Josefinas brand’s most relevant social network–Instagram, findings point out that the influence most fea-tures, particularly those related with Facebook, have on Instagram is positive until a certain point (e.g., increases until the first fraction of the plots), ceasing its influence from that onwards. On Insta-gram, Josefinas are very reactive. While the post is a novelty, the
interactions on Instagram occur very rapidly, which can be under-stood as the novelty or moment effect. Moreover, on Facebook the message lasts longer, independently of being a novelty. Facebook encourages a more relational and not a reaction process and thus, the interactions are not immediate and fast as on Instagram, but they persist over time, generating in the end a greater number of interactions. Considering the different behavior of these social net-works, when the publications stops being a novelty, the line on the majority of the graphs becomes straight. Having said that, it is pos-sible to add that the influence of Facebook on Instagram Likes is negative. Another factor that corroborates these different behav-iors relates with the different feeds, which means that Facebook feed delivers more options to its users and people get entertained with different stimuli, whereas Instagram feeds only offer photo or video publications of users who the primary user already follows. In this way, on Instagram people might get bored of scrolling down to only see photos and videos and not reach Josefinas’ posts, while on Facebook as users see different content (news, shares, brands’ or friend’s posts) they might get entertained and spend more time on the platform and interacting with the luxury brand’ posts. 6. Conclusions
6.1. Final remarks
This study shows evidence of an influence between the inter-actions of Instagram and Facebook for the case of Josefinas. There is also some influence of pins in Pinterest. Interestingly, despite the brand published around half of the tweets when compared to both Facebook and Instagram publications, the number of tweets does not influence Instagram likes. Thus, this research suggests that luxury digital brands should invest in the more visually appeal-ing social networks, givappeal-ing credit to the statement “a picture is worth a thousand words”. Hence, the first research question is par-tially positively answered (i.e., there is an influence of some social networks on other networks). By measuring each feature’s contri-bution, the second research question is positively answered (i.e., unveiling which features contribute the most to such influence). Additionally, the standard magazine articles about the brand also showed to have an impact on Instagram likes, although at a lower scale when compared to Facebook. Finally, this study highlights the advantages of a multichannel multinetwork strategy, with the interactions in one network influencing the other.
6.2. Managerial implications
It is important to highlight that Facebook still remains the dominant social network for any brand that wants to exhibit and generate buzz around its products and the brand itself. Neverthe-less, Instagram is more targeted for niche and luxury brands due to its visual characteristics, where high-end brands such as Josefi-nas can target the right fans and tell them a story with which they can feel identified, thus achieving those who are really interested in the brand and on what it has to offer and tell. Besides Instagram and Facebook, other social networks studied in this research such as Twitter, Pinterest and Google Plus do not have a great effect on lux-ury brands. It is important to consider that this conclusion is mainly related with Josefinas’ audience that interacts on social networks, which a great part is Portuguese and this audience does not have a great presence on Twitter, Pinterest and Google Plus.
Another takeaway is that besides Josefinas being an emergent and small luxury brand, it is also a niche brand focusing on hand-made shoes and bags, while big luxury fashion houses such as Louis Vuitton or Burberry offer a wider variety of products and have been on the market for many years, being in another luxury
segment. In this way, Josefinas is able to compete with big luxury fashion houses, since its products are unique, have a more attrac-tive price and are directed to a specific audience. This research shows how a small brand such as Josefinas can take advantage of consumers’ interactions with the brand to develop and inspire advertising campaigns. By unveiling the most meaningful features in the adopted social networks, this study also uncovers opportu-nities to take advantage of those features to increase the audience of their showcase.
6.3. Limitations and future research
This research has some limitations regarding the sample amount, which regards to one year. Also, the study is focused in a single case of small luxury brand and an emergent and recent one. Additionally, there may be a change in user behavior, implying that a user may dislike a previously liked post, for example, which may affect the collected data. Yet, this behavior typically occurs within the first days after the post has been published (i.e., this is the rea-son why social media metrics usually provide adequate metrics to measure posts’ performance–Moro et al., 2016). Other approaches such as text mining or sentiment analysis could be employed to extract additional knowledge from the users’ comments published on social networks and thus have a more solid foundation. Fur-thermore, it is recommended to study other cases, such as luxury brands with larger dimensions, like Louis Vuitton or Chanel, so that other results with different measures can be achieved.
Appendix A. Supplementary data
Supplementary data associated with this article can be found, in the online version, atdoi:10.1016/j.iedeen.2018.10.002.
References
Amado, A., Cortez, P., Rita, P., & Moro, S. (2018). Research trends on Big Data in Marketing: A text mining and topic modeling based literature analysis. European Research on Management and Business Economics, 24(1), 1–7.
An, Y., & Harvey, K. E. (2016). Public Relations and Mobile: Becoming Dialogic. In In Handbook of Research on Human Social Interaction in the Age of Mobile Devices. pp. 284–311. IGI Global.
Ananda, A. S., Hernández García, Á., & Lamberti, L. (2015). Social media marketing in Italian luxury fashion. In Paper presented at the 5th Annual International Workshop on Luxury Retail, Operations and Supply Chain Management. pp. 1–17. Milan, Italy Bento, M., Martinez, L. M., & Martinez, L. F. (2018). Brand engagement and search for brands on social media: Comparing Generations X and Y in Portugal. Journal of Retailing and Consumer Services, 43, 234–241.
Campbell, C., Ferraro, C., & Sands, S. (2014). Segmenting consumer reactions to social network marketing. European Journal of Marketing, 48(3/4), 432–452. Canito, J., Ramos, P., Moro, S., & Rita, P. (2018). Unfolding the relations between
companies and technologies under the Big Data umbrella. Computers in Industry, 99, 1–8.
Cortez, P., & Embrechts, M. J. (2013). Using sensitivity analysis and visualization techniques to open black box data mining models. Information Sciences, 225, 1–17.
Dahlhoff, D. (2016). The Challenge for Luxury Retailers: Figuring Out Digital Oppor-tunities. In Online Luxury Retailing: Leveraging Digital Opportunities: Research, Industry Practice, and Open Questions. Philadelphia: Wharton School, Baker Retailing Center.
Dwyer, P. (2007). Measuring the value of electronic word of mouth and its impact in consumer communities. Journal of Interactive Marketing, 21(2), 63–79. Facebook IQ. (2016). Facebook and Instagram: A Tale of Two Feeds.. Retrieved from:
https://insights.fb.com/2016/07/11/facebook-and-instagram-a-tale-of-two-feeds/
Facebook Newsroom. (2017). News Feed FYI: New Signals to Show You More Authentic and Timely Stories. Retrieved from: https://newsroom.fb. com/news/2017/01/news-feed-fyi-new-signals-to-show-you-more-authentic-and-timely-stories/
Kedzior, R., Allen, D. E., & Schroeder, J. (2016). The selfie phenomenon–consumer identities in the social media marketplace. European Journal of Marketing, 50(9/10), 1767–1772.
Hoffman, D. L., & Fodor, M. (2010). Can you measure the ROI of your social media marketing? MIT Sloan Management Review, 52(1), 41–49.
Kaya, T., & Bicen, H. (2016). The effects of social media on students’ behaviors; Facebook as a case study. Computers in Human Behavior, 59, 374–379.
Kennedy, H. (2016). Why Study Social Media Data Mining? In Post, mine, repeat (pp. 19–39). Palgrave Macmillan, London.
Kim, S., & Kim, H. (2016). A new metric of absolute percentage error for intermittent demand forecasts. International Journal of Forecasting, 32(3), 669–679. Kim, A. J., & Ko, E. (2012). Do social media marketing activities enhance customer
equity? An empirical study of luxury fashion brand. Journal of Business Research, 65(10), 1480–1486.
Kim, C., & Yang, S. U. (2017). Like, comment, and share on Facebook: How each behavior differs from the other. Public Relations Review, 43(2), 441–449. Kuhn, M., & Johnson, K. (2013). Applied predictive modeling. New York: Springer (Vol
26).
Langaro, D., Rita, P., & Salgueiro, M. F. (2018). Do social networking sites con-tribute for building brands? Evaluating the impact of users’ participation on brand awareness and brand attitude. Journal of Marketing Communications, 24(2), 146–168.
Larsson, A. O. (2017). Diversifying Likes: Relating reactions to commenting and sharing on newspaper Facebook pages. Journalism Practice, 1–18.
Lin, T. M., Lu, K. Y., & Wu, J. J. (2012). The effects of visual information in eWOM communication. Journal of Research in Interactive Marketing, 6(1), 7–26. Link Humans (2015). How Burberry Uses Social Media [Case Study]. Retrieved from:
http://linkhumans.com/case-study/burberry.
Liu, X., Burns, A. C., & Hou, Y. (2013). Comparing online and in-store shopping behavior towards luxury goods. International Journal of Retail & Distribution Management, 41(11/12), 885–900.
Moro, S., Cortez, P., & Rita, P. (2017). A framework for increasing the value of pre-dictive data-driven models by enriching problem domain characterization with novel features. Neural Computing and Applications, 28(6), 1515–1523. Moro, S., Cortez, P., & Rita, P. (2018). A divide and conquer strategy using feature
relevance and expert knowledge for enhancing a data mining approach to bank telemarketing. Expert Systems, 35(3), e12253.
Moro, S., Rita, P., & Vala, B. (2016). Predicting social media performance metrics and evaluation of the impact on brand building: A data mining approach. Journal of Business Research, 69, 3341–3351.
Nielsen. (2016). First-quarter 2016 comparable metrics report.. Retrieved from: http://www.nielsen.com/us/en/insights/news/2016/television-is-still-top-brass-but-viewing-differences-vary-with-age.html
Park, J., Ciampaglia, G. L., & Ferrara, E. (2016). Style in the Age of Instagram: Predict-ing Success within the Fashion Industry usPredict-ing Social Media. In Paper presented at the 19th ACM Conference on Computer-Supported Cooperative Work & Social Computing (pp. 64–73).
Parrott, G., Danbury, A., & Kanthavanich, P. (2015). Online behaviour of luxury fashion brand advocates. Journal of Fashion Marketing and Management, 19(4), 360–383.
Phua, J., Jin, S. V., & Kim, J. J. (2017). Uses and gratifications of social networking sites for bridging and bonding social capital: A comparison of Facebook, Twitter, Instagram, and Snapchat. Computers in Human Behavior, 72, 115–122. PwC. (2016). Total Retail Survey 2016.. Retrieved from:https://www.pwc.com/
gx/en/industries/retail-consumer/global-total-retail.html
Rodriguez, J. D., Perez, A., & Lozano, J. A. (2010). Sensitivity analysis of k-fold cross validation in prediction error estimation. IEEE Transactions on Pattern Analysis and Machine Intelligence, 32(3), 569–575.
Silva, A. T., Moro, S., Rita, P., & Cortez, P. (2018). Unveiling the features of suc-cessful eBay smartphone sellers. Journal of Retailing and Consumer Services, 43, 311–324.
Tong, X., Su, J., & Xu, Y. (2018). Brand personality and its impact on brand trust and brand commitment: an empirical study of luxury fashion brands. International Journal of Fashion Design, Technology and Education, 11(2), 196–209.
Waterloo, S. F., Baumgartner, S. E., Peter, J., & Valkenburg, P. M. (2018). Norms of online expressions of emotion: Comparing Facebook, Twitter, Instagram, and WhatsApp. New Media & Society, 20(5), 1813–1831.
Zafarani, R., Abbasi, M. A., & Liu, H. (2014). Social media mining: an introduction. United Kingdom: Cambridge University Press.
Zhang, Y., Tang, J., Yang, Z., Pei, J., & Yu, P. S. (2015). Cosnet: Connecting hetero-geneous social networks with local and global consistency. In In Proceedings of the 21th ACM SIGKDD International Conference on Knowledge Discovery and Data Mining (pp. 1485–1494). ACM.