Alzheimer’s disease: development of an
immunosensor for amyloid beta
detection
Pedro Jorge da Silva Carneiro
Supervisor: Prof. Dr. Maria do Carmo Silva Pereira Co-Supervisor: Prof. Dr. Simone Barreira Morais
Master’s Program in Biomedical Engineering
i
Abstract
Alzheimer’s disease (AD) is a neurodegenerative pathology that becomes increasingly common with aging, characterized by extracellular accumulation of senile plaques (Aβ), intracellular appearance of neurofibrillary tangles and neuronal loss.
AD affects about 35 million people worldwide, and if current trends continue with no medical advancement, one in 85 people will be affected by 2050. Thus, there is an urgent need to develop a cost-effective, easy to use sensor platform to facilitate the diagnostic process, identify patients at an earlier stage and allow monitorization of biochemical effects of the treatments.
Since the quantification of amyloid beta (Aβ) has been established as a reliable test to diagnose AD through human clinical trials, an electrochemical immunosensor was designed and developed for detection of this biomarker in biological fluids and is the focus of this work. It is based on a gold electrode modified with mercaptopropionic acid self-assembled monolayer, electrodeposited gold nanoparticles and Aβ antibody. Antibodies act as the biorecognition element of the sensor and selectively capture and bind Aβ42 to the electrode surface. The antibodies were immobilized on gold nanoparticles that offered excellent properties for electroanalytical assays. Cyclic and square-wave voltammetry, as well as electrochemical impedance spectroscopy were used to characterize the construction of the biosensor. The optimum values for the relevant experimental variables were determined.
Using the proposed immunosensor, Aβ42 can be specifically detected within a range of 0.451–9028 ng/mL with a 264 pg/mL detection limit. The immunosensor enables real-time, rapid and highly sensitive detection of Aβ with low-cost and opens up the possibilities for diagnostic ex vivo applications and research-based in vivo studies.
Keywords: Alzheimer’s disease, amyloid beta, electrochemical immunosensor,
ii
Acknowledgements
First and foremost, I would like to give my most sincere appreciation to my supervisors, Prof. Maria do Carmo Silva Pereira and Prof. Simone Barreira Morais for their continued support and guidance throughout my research project and in helping me develop scientific thinking and research knowledge.
Moreover I would like to give my thanks to Thiago Mielle from REQUIMTE for his essential support and assistance in the laboratory, Sílvia Coelho and Joana Loureiro from LEPAE for their help in the gold nanoparticles synthesis and antibody treatment, respectively. I am also grateful to all REQUIMTE and LEPAE team for their assistance and great work environment.
Finally I would like to give thanks to my parents, girlfriend and friends for their continued support and encouragement throughout this year.
iii
List of Publications
Most of the content presented in this thesis was submitted or accepted for publication in:
1. Carneiro, P., Delerue-Matos, C., Morais, S., Pereira, M, Electrochemical Immunosensor for Amyloid Beta-Peptide Detection: Preliminary Study, 3rd Portuguese Bioengineering Meeting - Bioengineering National Congress, Braga February 2013.
2. Carneiro, P., Delerue-Matos, C., Morais, S., Pereira, M, Alzheimer disease: development of an immunosensor for biomarker detection, 6º Encontro de Investigação Jovem da Universidade do Porto, Porto February 2013.
iv
Contents
List of Figures ... vi List of Abbreviations ... x 1. Introduction ... 1 1.1 Main Objectives ... 2 1.2 Thesis structure ... 32. State of the Art ... 4
2.1 Alzheimer’s disease – The amyloid cascade hypothesis ... 4
2.2 Biomarkers for Alzheimer’s disease ... 6
2.2.1 Biological biomarkers of Aβ-related mechanism... 8
2.3 Electrochemistry ... 11
2.3.1. Mass transfer ... 13
2.3.2 The electrical double layer ... 14
2.3.3 Electrode materials ... 15
2.3.4. Electrochemical Techniques ... 16
2.3.4.1 Cyclic voltammetry ... 16
2.3.4.2 Square-wave voltammetry ... 17
2.3.4.3 Electrochemical Impedance Spectroscopy ... 19
2.4 Biosensors ... 21
2.5 Electrochemical immunosensors ... 23
2.5.1 The antibody-antigen interaction ... 24
2.5.2 Immunoassays ... 25
2.5.3 Antibody immobilization techniques ... 28
2.5.3.1 Biotin-(strept)avidin interaction ... 28
2.5.3.2 Antibody-binding proteins ... 29
2.5.3.3 Conducting polymers ... 30
2.5.3.4 Antibody fragments ... 30
2.5.3.5 Self-assembled monolayers ... 31
2.5.4 Nanomaterials based immunosensors ... 35
3. Materials and Methods ... 39
3.1 Reagents and equipments ... 39
3.2 Electrochemical analyses ... 40
v
3.2.2 Self-assembled monolayers ... 42
3.2.3 Synthesis and electrodeposition of gold nanoparticles ... 42
3.2.4 Antibody immobilization ... 43
3.2.5 β-Amiloyd (1-42) detection ... 43
4. Results and Discussion ... 45
4.1 Characterization of the electrode surface ... 45
4.2 Biosensor construction ... 46
4.2.1 Modification of the AuE with self-assembled monolayers ... 46
4.2.2 Deposition of gold nanoparticles onto the MPA/AuE ... 50
4.2.3 Antibody immobilization onto the AuNPs/MPA/AuE ... 54
4.3 Amyloid β (1-42) detection ... 58
5. Conclusion and Future directions ... 64
vi
List of Figures
Figure 1 - The amyloid cascade hypothesis [6]. ... 5
Figure 2 - Biomarkers for each step in the amyloid cascade [3]. ... 7
Figure 3 - Proteolytic cleavages of APP [4]. ... 8
Figure 4 - Model for Aβ misfolding and aggregation [4]. ... 9
Figure 5 - Proposed model of Aβ-induced synaptotoxic effects and synapse elimination in AD [22]. ... 10
Figure 6 - Three methods for mass transfer in electrochemical systems [25]. ... 13
Figure 7 - Schematic representation of the electrical double layer. IHP-inner Helmholtz plane; OHP-outer Helmholtz plane [29]. ... 14
Figure 8 - Typical excitation signal for CV - a triangular potential waveform with switching potentials at V1 and V2 [31]. ... 17
Figure 9 - Schematic waveform for square-wave voltammetry [31]. ... 18
Figure 10 - a) A schematic diagram of an idealized Randles electrical equivalent circuit [29]; b) Nyquist plot showing the high and low frequency components [34]. ... 20
Figure 11 - Components of typical biosensor [35]. ... 21
Figure 12 - A schematic illustrating the “Y”-shaped structure of an antibody [48]. ... 25
Figure 13 - Schematic representation of (a) competitive and (b) non-competitive immunoassay formats [48]. ... 27
Figure 14 - Schematic diagram of an ideal, single-crystalline SAM of alkanethiolates supported on a gold surface. The anatomy of the SAM is highlighted [84]. ... 32
Figure 15 - Examples of sulfur compounds that form self-assembled monolayers on metals and semiconductors: (a) alkanethiol; (b) arenethiol; (c) alkanedithiol; (d) dialkyldisulfide; (e) dialkylsulfide. Red: sulfur atom, blue: carbon atom, white: hydrogen atom [82]. ... 33
Figure 16 - Scheme of a decanethiol molecule adsorbed on gold. Red: sulfur atom; blue: carbon atom; white: hydrogen atom [82]. ... 34
Figure 17 - The formation process of self-assembled monolayers. ... 35
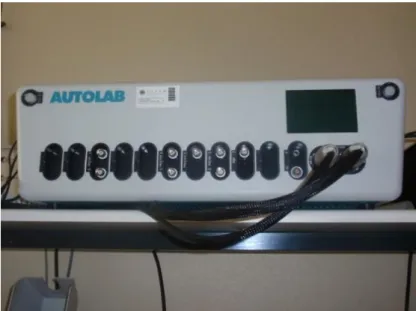
Figure 18 – Potentiostat PGSTAT-30 (Autolab). ... 40
Figure 19 – a) Electrochemical cell assembly. Red: Working electrode; Black: Counter electrode; Blue: Reference electrode; b) Working electrode (gold electrode). ... 41
Figure 20 - Typical cyclic voltammogram obtained with a gold electrode in 0.5 mol/L H2SO4 aqueous solution at a 100 mV/s scan rate. ... 45
vii Figure 21 - Comparison of the different square-wave voltammograms before (AuE) and after the modification with the different self-assembled monolayers (12 h immersion): cystamine SAM (CYS); cystamine and mercaptoethanol mixed SAM (CYS+ME); mercaptopropionic acid SAM (MPA); mercaptopropionic acid and mercaptoethanol mixed SAM (MPA+ME). Profiles obtained in a 0.1 mol/L PBS solution pH=7.4 containing 0.01 mol/L Fe(CN)63-/4- at a 0.405 V/s scan rate. ... 47 Figure 22 – Square-wave voltammograms obtained for different immersion periods of the gold electrode (AuE) on the 1 mmol/L mercaptopropionic acid solution. Profiles obtained in a 0.1 mol/L PBS solution pH=7.4 containing 0.01 mol/L Fe(CN)63-/4- at a 0.405 V/s scan rate. ... 48 Figure 23 - Square-wave voltammograms obtained for different concentrations of MPA solution for a 2 h immersion period. Profiles obtained in a 0.1 mol/L PBS solution pH=7.4 containing 0.01 mol/L Fe(CN)63-/4- at a 0.405 V/s scan rate. ... 49 Figure 24 - Nyquist plot of electrochemical impedance spectra for bare gold electrode (AuE) and MPA SAM modified gold electrode. Profiles obtained in a 0.01 mol/L Fe(CN)63-/4- solution by applying a frequency range from 10-1 to 105 Hz with an amplitude perturbation of 5 mV. ... 50 Figure 25 - Absorption spectrum of the gold nanoparticles prepared by the Turkevich-Frens method. ... 51 Figure 26 - Square-wave voltammograms obtained for the bare gold electrode (a), after modification with the 5 mmol/L MPA SAM (b), and electrodeposition of AuNPs synthesized by the Turkevich-Frens method during 600 s (c) and by the potential application during 200 s (d). Profiles obtained in a 0.1 mol/L PBS solution pH=7.4 containing 0.01 mol/L Fe(CN)63-/4- at a 0.405 V/s scan rate. ... 52 Figure 27 – Square-wave voltammograms obtained with the bare gold electrode (AuE) and AuNPs/MPA/AuE biosensor for different AuNPs electrodeposition periods. Profiles obtained in a 0.1 mol/L PBS solution pH=7.4 containing 0.01 mol/L Fe(CN)63-/4- at a 0.405 V/s scan rate. ... 53 Figure 28 - Nyquist plot of electrochemical impedance spectra for bare gold electrode (AuE), MPA/AuE and AuNPs/MPA/AuE. Profiles obtained in a 0.01 mol/L Fe(CN)6 3-/4-solution by applying a frequency range from 10-1 to 105 Hz with an amplitude perturbation of 5 mV. ... 54 Figure 29 – Square-wave voltammograms obtained for AuNPs/MPA/AuE and AuNPs/MPA/AuE modified with different antibody concentrations for a 12 h
viii incubation time. Profiles obtained in a 0.1 mol/L PBS solution pH=7.4 containing 0.01 mol/L Fe(CN)63-/4- at a 0.405 V/s scan rate. ... 55 Figure 30 - Nyquist plot of electrochemical impedance spectra for AuNPs/MPA/AuE and AuNPs/MPA/AuE modified with different antibody concentrations. Profiles obtained in a 0.01 mol/L Fe(CN)63-/4- solution by applying a frequency range from 10-1 to 105 Hz with an amplitude perturbation of 5 mV. ... 55 Figure 31 - Square-wave voltammograms obtained with the AuNPs/MPA/AuE and the AuNPs/MPA/AuE modified with different antibody (1.0 µg/mL) incubation times. Profiles obtained in a 0.1 mol/L PBS solution pH=7.4 containing 0.01 mol/L Fe(CN)63-/4- at a 0.405 V/s scan rate. ... 56 Figure 32 - Nyquist plot of electrochemical impedance spectra for the AuNPs/MPA/AuE modified with different antibody (1.0 µg/mL) incubation times. Profiles obtained in a 0.01 mol/L Fe(CN)63-/4- solution by applying a frequency range from 10-1 to 105 Hz with an amplitude perturbation of 5 mV. ... 57 Figure 33 - Nyquist plot of electrochemical impedance spectra for the AuE, MPA/AuE, AuNPs/MPA/AuE and Anti-Aβ42/AuNPs/MPA/AuE. Profiles obtained in a 0.01 mol/L Fe(CN)63-/4- solution by applying a frequency range from 10-1 to 105 Hz with an amplitude perturbation of 5 mV. ... 58 Figure 34 - Square-wave voltammograms obtained with the Anti-Aβ42/AuNPs/MPA/AuE immunosensor after expositions to different Aβ42 concentrations (0 to 9028 ng/mL). Profiles obtained in a 0.1 mol/L PBS solution pH=7.4 containing 0.01 mol/L Fe(CN)63-/4- at a 0.405 V/s scan rate. ... 59 Figure 35 - Nyquist plot of electrochemical impedance spectra observed with the Anti-Aβ42/AuNPs/MPA/AuE immunosensor after expositions to different Aβ42 concentrations (0 to 9028 ng/mL). Profiles obtained in a 0.01 mol/L Fe(CN)6 3-/4-solution by applying a frequency range from 10-1 to 105 Hz with an amplitude perturbation of 5 mV. ... 59 Figure 36 - The several steps for the biosensor construction. ... 60 Figure 37 - Nyquist plot of electrochemical impedance spectra for the different stages of the immunosensor construction. Profiles obtained in a 0.01 mol/L Fe(CN)63-/4- solution by applying a frequency range from 10-1 to 105 Hz with an amplitude perturbation of 5 mV. ... 61 Figure 38 - Effect of the Aβ42 concentration (ng/mL) on the peak current (A) of the immunosensor. Error bars correspond to three replicates. ... 62
ix Figure 39 - Analytical curve of Aβ42 obtained with the developed immunosensor. Error bars correspond to two replicates. ... 62
x
List of Abbreviations
ABTS - 2,2′-Azino-bis(3-ethylbenzothiazoline-6-sulfonic acid) diammonium salt Ab2 – Secondary antibody
AC – Alternate current AD – Alzheimer’s disease
AFM – Atomic force microscopy AICD – APP intracellular domain
AMPA - α-amino-3-hydroxy-5-methyl-4-isoxazolepropionic acid receptor Anti-Aβ42 – Antibody against Aβ42
apoE - Apolipoprotein E APOE34 – Apolipoprotein E34 APOJ – Apolipoprotein J
APP – Amyloid precursor protein AuE – Gold electrode
AuNPs – Gold nanoparticles Aβ – Amyloid beta peptide
BACE - Beta-site APP-cleaving enzyme BSA – Bovine serum albumin
Cd – Double layer capacitor CNS – Central nervous system CR1 – Complement receptor 1 CSF – Cerebrospinal fluid CV – Cyclic voltammetry
xi CYS - Cystamine
CYS+ME – Cystamine + Mercaptoethanol C99 – 99 amino acid C-terminal fragment of APP DNA – Deoxyribonucleic acid
EDC - N-(3, Dimethylaminopropyl)-N-ethyl-carbodiimide hydrochloride EDTA - Ethylenediaminetetraacetic acid
EIS – Electrochemical impedance spectroscopy ELISA – Enzyme-linked immunosorbent assay FDG - Fluorodeoxyglucose
GPES – General Purpose Electrochemical system for Windows software HPLC – High-performance liquid chromatography
Ig - Immunoglobolin
IHP - Inner Helmholtz plane LOD – Detection limit LOQ – Quantification limit LTD – Long-term depression LTP – Long-term potentiation MPA – Mercaptopropionic acid
MPA+ME – Mercaptopropionic acid + Mercaptoethanol MRI – Magnetic resonance imaging
MTA – Medial temporal atrophy NHS - N-hydroxysuccinimide NMDA - N-methyl-D-aspartic acid
xii NSB – Nonspecific binding
OHP - Outer Helmholtz plane PBS - Phosphate buffer saline PEG - Polyethylene glycol
PET – Positron emission tomography
PICALM - Phosphatidylinositol binding clathrin assembly protein PS1 – Presenilin 1
PS2 – Presenilin 2
Rct – Charge transfer resistance Rp – Polarization resistance Rs – Solution resistance
SAM – Self-assembled monolayer SEM – Scanning electron microscopy
SORL1 - Sortilin-related receptor, L(DLR class) A repeats containing STM – Scanning tunneling microscopy
SWV – Square-wave voltammetry
TEM – Transmission electron microscopy
TOMM40 - Translocase of outer mitochondrial membrane 40 homolog Zw – Warburg impedance
1
1. Introduction
Alzheimer’s disease (AD) is the most common form of dementia in the elderly [1, 2]. AD is a neurodegenerative disorder that causes global, progressive and irreversible deterioration of many cognitive functions as memory, concentration, speaking capability, thought and eventually causes death. This deterioration leads to changes in behavior, personality and functional capacity, which hampers the daily life of the patient. As the population ages, AD is rapidly becoming an urgent public health problem. Nowadays, it affects 35 million individuals worldwide and it is projected to affect 115 million by 2050 [3]. In Portugal this number is estimated to be 90 000 [2]. Without the prevention and development of new therapies for AD, both health care and socioeconomic systems will not be able to support the financial needs of AD in the future [4].
Pathological hallmarks of AD include extracellular deposits of amyloid β peptides (Aβ) (senile plaques), intraneuronal inclusions of hyperphosphorylated tau protein in neurofibrillary tangles, together with downstream processes such as inflammation and oxidative stress, all of which contribute to loss of synaptic integrity, effective neural network connectivity and progressive neurodegeneration [3-5].
Research gives support to the “amyloid cascade hypothesis”, which advocates that an imbalance between the production and clearance or degradation of Aβ in the brain is the initiating event in AD, leading to synaptic and neuronal dysfunction and degradation resulting, consequently, in cognitive disturbances [6].
The current diagnostic procedures of AD are difficult and are made in an advanced stage of the disease [4]. Therefore it is clinically important to find accurate markers for AD by new non-invasive methods that may facilitate the diagnostic process, identify patients at an earlier stage and monitor biochemical effects of the treatments [4].
There is a continuing demand for fast and simple analytical methods for the determination of many clinical and biochemical parameters. The requirement for immunologically based biosensors is generally considered to be in the diagnostic field and particularly in the home diagnostic field. Immunoassays and immunosensors rely on the antibody-antigen interactions providing promising means of analysis due to their specificity and sensitivity. The high specificity is achieved mainly by the molecular recognition of the target analytes by the antibodies or antigens forming stable
2 immunocomplexes [7-9]. On the other hand, sensitivity depends on several factors, including the affinity of antibodies, the amount of immobilized immunological recognition elements, and the choice of transducer and signal probe [8]. The improvement of immunoassay and immunosensor performance mainly relies on the development of antibody preparation techniques, the improvement of immobilization and tagging methods, and the adoption of a high-performance transduction method [8]. Electrochemical detection overcomes problems associated with other immunoassays and immunosensors detection techniques, such as the short half-life of radioactive agents and concerns of health hazards, while limited sensitivity in the analysis of colored or turbid samples is achieved in immunoassays coupled with optical detection [10].
Electrochemistry is the science concerned with the physical and chemical properties of ionic conductors as well as with phenomena occurring at the interfaces between ionic conductors and electronic conductors or semiconductors, or even insulators (including gases and vacuum) [11, 12]. In other words, electroanalytical methods are a class of techniques in analytical chemistry which studies the relationship between electrical and chemical parameters enabling the detection of the analyte of interest by measuring the potential and/or current in an electrochemical cell. Such electroanalytical measurements have been found to have a vast range of applications, including biomedical analysis, quality control, and environmental monitoring. Electrochemical transducers for immunoassays and immunosensors are very attractive due to their high sensitivity, inherent simplicity and miniaturization, low cost and power requirements [8, 9, 13]. Furthermore, electrochemistry is an interfacial process in which the relevant reactions take place at the electrode-solution interface, rather than in bulk solution [12]. Therefore, in conjunction with developments in micro- and nano-electrochemical sensors, electrochemistry offers an added bonus of detecting analytes in very small volumes [8, 10].
1.1 Main Objectives
The aim of this research is to develop a sensitive gold label free immunosensor for the Alzheimer’s disease main biomarker, amyloid-beta peptide, in order to facilitate and enable early AD diagnosis. The immunosensor construction comprises three main steps:
3 1. Formation of a self-assembled monolayer on the gold surface in order to control the electrode interface. Several self-assembled monolayers (SAMs) were tested and experimental conditions were optimized in order to promote the best immobilization on the gold surface.
2. Electrodeposition of gold nanoparticles on the modified SAM/gold electrode. Gold nanoparticles enhanced the biosensor response and allowed antibody immobilization. Different methods for gold nanoparticles synthesis were tested and compared.
3. Immobilization of the antibody on the gold nanoparticles/SAM/gold electrode. Concentration of the antibody and time of incubation were optimized in order to promote the desired immobilization.
The electroanalytical behavior of the developed biosensor was characterized in terms of calibration data. Finally, it was successfully applied to synthetic solutions of Aβ.
1.2 Thesis structure
This thesis is divided in 6 chapters.
In Chapter 1, the key issues are introduced. The motivations to the work performed, as well as, the main objectives of the work are presented.
In Chapter 2 the theoretical aspects concerning the main topics of this work are presented. The following subjects are discussed: the formation of extracellular deposits of Aβ and consequently development of AD, the main electrochemical technique principles, the characteristics of biosensors and immunoassays, properties of nanomaterials and their importance in the development of biosensors. In this section the recent studies related with this theme are also referred.
Chapter 3 describes the reagents, equipments and methods used in the performed experiments.
In Chapter 4, the results attained are presented and discussed. The topics include the characterization of the gold electrode, the SAMs formation, synthesis and electrodeposition of gold nanoparticles, antibody immobilization and finally detection of Aβ.
Chapter 5 is the final chapter of the thesis in which the main conclusions and future perspectives for the work are referred.
4
2. State of the Art
2.1 Alzheimer’s disease – The amyloid cascade hypothesis
AD is a neurodegenerative pathology characterized by extracellular deposits of Aβ peptide (senile plaques), intracellular appearance of neurofibrillary tangles and neuronal loss.
The amyloid cascade hypothesis defends that the deposition of the Aβ peptide in the brain parenchyma is a crucial step that ultimately leads to AD (Figure 1) [6, 14]. Autosomal dominant mutations that cause early onset familial AD occur in three genes: amyloid precursor protein (APP), presenilin 1 (PS1) and presenilin 2 (PS2) [6, 14]. The first genetic mutations causing AD were discovered in the APP gene [6]. Most of the mutations cluster at or very near the sites within APP that are normally cleaved by proteases called α-, β-, and γ- secretases [6]. These mutations promote generation of Aβ by favoring proteolytic processing of APP by β- or γ-secretase [4, 6, 14]. Besides the mutations in the PS1 and PS2 genes that alter the APP metabolism through a direct effect on the γ-secretase, four important observations were given to support the amyloid cascade hypothesis. Firstly, the deposition of tau protein in neurofibrillary tangles in the brain occurs without deposition of amyloid [6]. The conclusion is that even the most severe consequences of tau alteration namely, neurofibrillary tangle formation leading to neurodegeneration, are not sufficient to induce the amyloid plaques [6]. This way, the formation of neurofibrillary tangle of tau is likely to be deposited after changes in Aβ metabolism and initial plaque formation, rather than before [6]. Secondly, studies suggest that altered APP processing occurs before tau alterations in the cascade of AD, a notion bolstered by the observation that Aβ toxicity is tau dependent [6]. Thirdly, studies where APP transgenic mice were crossed with apolipoprotein E (apoE) deficient mice, cerebral Aβ deposition was reduced in the offspring, providing strong evidence that the pathogenic role of genetic variability at the human apoE locus is very likely to involve Aβ metabolism [6, 14]. At last, evidence indicates that genetic variability in Aβ catabolism and clearance may contribute to the risk of late-onset AD [6]. These four findings reinforce the theory that cerebral Aβ accumulation is the primary event in AD.
These studies have identified multiple steps potentially vulnerable to pharmacologic manipulation that resulted in the development of new drug candidates with disease-modifying potential [4]. This predicts a new type of causal mechanistic
5 treatment beyond symptomatic therapy [3, 4]. This new type of disease-modifying drugs is expected to be most effective if administrated very early in the disease process, before the neurodegenerative process is too severe [3, 4]. However, with the current techniques, the clinical diagnosis of AD can only be made when it is in an advanced stage. Thus, there is a great need for improved diagnostic tools and biomarkers appear as huge promise for the early identification of AD [3-5]. Biomarkers can provide a faster and more convenient responses to some questions and are playing increasingly diverse roles in drug development [3].
6
2.2 Biomarkers for Alzheimer’s disease
“A biomarker (biological marker) is defined as a characteristic that is objectively measured and evaluated as an indicator of normal biological processes, pathogenic processes, or pharmacologic responses to a therapeutic intervention” [3]. In other words, the term biomarker is used to describe any neurochemical agent that is used to evaluate the risk or presence of disease. In this case, biomarkers may facilitate the ability to reliably diagnose AD in very early and perhaps even pre-clinical disease stages [4, 5]. They may also provide objective and reliable measures of drug safety and disease-modifying treatment efficacy in clinical drug trials in AD. Since the neuropathological changes and symptoms of AD take years to be noticed, the ideal therapy would be to treat the neuropathology as early as possible and biomarkers of pre-clinical AD are likely to play a fundamental role in the development of new therapies [4, 5]. Biomarkers can provide new insights into the neurobiology of AD and generate new and novel therapeutic targets. Disease-related biomarkers can assist in patient selection, sample stratification, course prediction and defining disease severity [3]. Biomarkers may assist in decision making in early clinical development, may inform corporate decisions regarding go or non-go decisions and may decrease cycle time and decrease costs [3].
The key features of an ideal AD biomarker are that it should detect a fundamental feature of the neuropathology, and have a diagnostic sensitivity for AD exceeding 80% together with specificity above 80% for distinguishing AD from other dementias [4]. It should also be reliable, reproducible, non-invasive, simple to perform, and inexpensive [3, 4]. The steps to establish a biomarker consist of confirmation by at least two independent studies conducted by qualified investigators with the results published in peer-reviewed journals, and validation in neuropathologically confirmed cases [4]. Beyond these criteria it would also be important if the biomarker could follow natural disease progression even as the effects of disease-modifying therapies [3-5].
Disease biomarkers may have important roles in three areas: as markers of trait, state, and rate [3, 15]. Trait markers represent risk factors and do not change with the presence of the disease [3, 15]. Trait biomarkers that are representative of an increased risk of AD include the apolipoprotein E 34 (APOE 34) allele [3, 16, 17], APOJ [3, 18, 19], CR1 [3, 19], PICALM [3, 18], SORL1 [3, 20], and TOMM40 [3]. State markers indicate the presence of the disease process and include medial temporal atrophy (MTA) on magnetic resonance imaging (MRI), amyloid imaging, and cerebrospinal fluid (CSF)
7 Aβ and tau protein measures [3]. Rate biomarkers follow disease progression; progressive atrophy detected by MRI and hypometabolism observed on fluorodeoxyglucose (FDG) positron emission tomography (PET) are rate biomarkers that correlate with disease severity [3].
Biomarkers can be collected from a variety of biological compartments (e.g., imaging of brain [3], cerebrospinal fluid Aβ and tau levels [3, 21]) and each compartment provides a different perspective on the pathological processes of AD (Figure 2) [3]. Imaging biomarkers provide insight into the topographic distribution of pathologic changes. Fluid biomarkers may appear in the central nervous system (CNS) compartments by diffusion and are subject to metabolism and excretion; the status of these mechanisms will also affect the relationship of the biomarker to the brain disease [3].
Figure 2 - Biomarkers for each step in the amyloid cascade [3].
The levels of Aβ42 in the CSF in AD are reduced due to deposition of the peptide in Aβ plaques in the brain and the levels of Aβ40 remain unchanged or may be moderately increased. Several studies have examined plasma levels of Aβ in AD but the findings were contradictory [3, 4]. Some groups reported high levels of Aβ40 and Aβ42 in plasma [4]. On the other hand other groups found no change in the Aβ plasma levels [4]. Tau protein levels in CSF increase during the development of AD [3]. Clusterin levels have been found to be increased in brain and CSF of patients with AD, and plasma clusterin was recently reported to be associated with brain atrophy, baseline disease severity, and rapid clinical progression in patients with AD [3]. In this study Aβ is the biomarker that will be explored.
8
2.2.1 Biological biomarkers of Aβ-related mechanism
As reported earlier, Aβ is generated by proteolytic cleavage (enzymatic digestion involving β- and γ-secretase activities [22]) of the type I transmembrane spanning glycoprotein amyloid precursor protein (APP) (Figure 3) [4, 5, 14, 22]. APP is cleaved at the N-terminus after position 671 by a protease referred to as β-secretase, also known as beta-site APP-cleaving enzyme (BACE) [4, 5, 14, 22]. This cleavage results in the release of a large N-terminal derivative called β-secretase-cleaved soluble APP (β-sAPP). At last, the 99 amino acid C-terminal fragment of APP (C99) is cleaved by the γ-secretase complex releasing free Aβ [4, 5, 14, 22].
Figure 3 - Proteolytic cleavages of APP [4].
Once released, the Aβ peptide can be identified in cerebrospinal fluid and plasma, what makes the various species of Aβ really interesting as candidates to biomarkers [4]. The mechanism that enables Aβ monomers to aggregate is not well understood but Aβ can exist as monomers, dimmers, oligomers, protofibrils, fibrils and fibrillar aggregates (Figure 4) [3, 4]. Furthermore, the tendency of Aβ to aggregate seems to be related with the peptide’s primary sequence as Aβ42 variant, which constitutes less than 10% of total Aβ, seems more prone to aggregate than more abundant Aβ40, contributing to the modification of the ratio Aβ40/Aβ42 [4].
9
Figure 4 - Model for Aβ misfolding and aggregation [4].
Three main synaptotoxic effects of Aβ have been recognized: inhibition of long-term potentiation (LTP), removal of synaptic glutamate receptors and elimination of glutamate synapses (Figure 5) [22]. Glutamate synapses constitute 85-90% of the synapses in the mammalian cortex and their plasticity is thought to be the basis for learning and memory [22]. The postsynaptic membrane of the glutamate synapse is typically equipped with ionotropic AMPA and NMDA receptors [22]. The AMPA receptors are responsible for the normal, fast electrical signaling while the NMDA receptors, which are highly permeable for calcium, are required for the induction of LTP and its counterpart long-term depression (LTD) at these synapses [22]. LTP, a lasting increase in synaptic efficacy, typically involves an expansion of the synapse with more AMPA receptors, whereas the opposite is typical for LTD [22]. The inhibitory action of Aβ on NMDA receptor-dependent LTP has been shown in different experimental settings, including genetic modifications leading to overproduction of Aβ in human CSF and Aβ oligomers from AD brains [22].
10
11
2.3 Electrochemistry
Electrochemistry involves chemical phenomena associated with charge separation. Often this charge separation leads to charge transfer, which can occur homogeneously in solution, or heterogeneously on electrode surfaces [23]. Electrodes are linked by conducting paths both in solution (via ionic transport) and externally (via electric wires etc.) so that charge can be transported [23]. If the cell configuration permits, the products of the two electrode reactions can be separated.
Electroanalytical techniques analyze the relationship between the measurements of electrical quantities, such as current, potential, or charge, and the chemical parameters [24]. The oxidation/reduction process involves the exchange of electrons from one specie to another. Electrochemical processes take place at the electrode-solution interface [23, 25]. The electrochemical analyses usually require the use of three electrodes - the working electrode, reference electrode and counter electrode – and a contacting solution (electrolyte) containing the analyte [26]. The working electrode can be of various materials and geometries and gives response to the target analyte [26]. The electrode surface is thus a junction between an ionic conductor and an electronic conductor. The reference electrode has constant potential and is independent of the properties of the solution [26].
Different types of electrical signal used for quantification reflect the differences between electroanalytical techniques [11, 23, 25, 27]. Such electroanalytical measurements have been found to have a vast range of applications, where it could be highlighted the biomedical analysis.
The objective of controlled-potential electroanalytical experiments is to obtain a current response that is related to the concentration of the target analyte [25]. This objective is accomplished by monitoring the transfer of electron(s) during the redox process of the analyte:
where O and R are the oxidized and reduced species, respectively. Electrode reactions are heterogeneous and take place in the interfacial region between electrode and solution, the region where charge distribution differs from that of the bulk phases [11, 23, 25, 27].
12 The resulting current-potential plot, also known as voltammogram, is a display of current signal versus the potential signal [28]. The exact shape and magnitude of the voltammetric response is controlled by the processes involved in the electrode reaction. The resulting current from a change in oxidation state of the electroactive species is termed the faradaic current because it obeys Faraday’s law [23, 25]. The faradaic current is a direct measure of the rate of the redox reaction. The total current is a result of the sum of the faradaic currents for the sample and blank solutions, as well as the nonfaradaic charging background current [23, 25].
13
2.3.1. Mass transfer
Mass transfer is the movement of material from one location to another in solution. The rate of an electrode reaction is affected not only by the electrode itself but also by the transport of species to and from bulk solution [11, 23, 25]. It is important to consider the movement of ions in electrolyte solutions between anode and cathode as solvated ions move at different velocities, according to their size and charge. Diffusion is due to a concentration gradient, and migration to electric field effects [11, 23, 25]. Thus, whilst diffusion occurs for all species, migration affects only charged species (effectively, owing to the existence of dipoles, or induced dipoles in neutral species, a small electric field effect is observed) [11, 23, 25]. Forced convection considerably increases the transport of species. Natural convection, due to thermal gradients, also exists, but conditions where this movement is negligible are generally used [25].
In electrochemical systems, three modes of mass transport are generally considered (Figure 6):
• Diffusion: the spontaneous movement under the influence of concentration gradient that is from region of high concentration to region of lower concentration aimed at minimizing concentration differences [25].
• Convection: transport to the electrode by a gross physical movement; such fluid flow occurs with stirring or flow of the solution and with rotation or vibration of the electrode (forced convection) or due to density gradients (natural convection) [25]. • Migration: movement of charged particles along an electrical field [25].
14
2.3.2 The electrical double layer
The electrical double layer (Figure 7) is the array of charged particles and/or oriented dipoles that exists at every material interface. In electrochemistry, such a layer reflects the ionic zones formed in the solution to compensate for the excess of charge on the electrode. A positively charged electrode thus attracts a layer of negative ions (vice versa) [11, 23, 25, 27].
Figure 7 - Schematic representation of the electrical double layer. IHP-inner Helmholtz plane; OHP-outer Helmholtz plane [29].
The inner layer (closest to the electrode), known as the inner Helmholtz plane (IHP), contains solvent molecules and specifically adsorbed ions, which are not fully solvated [25]. It is defined by the locus of points for the specifically adsorbed ions. The next layer, the outer Helmholtz plane (OHP), reflects the imaginary plane passing through the center of solvated ions at their closest approach to the surface [25]. The solvated ions are nonspecifically adsorbed and are attracted to the surface by long-range coulomb forces [25]. Both Helmholtz layers represent the compact layer. Such a compact layer of charges is strongly held by the electrode and can survive even when the electrode is pulled out of the solution [23, 25]. However, the Helmholtz model does not take into account the thermal motion of ions, which loosens them from the compact layer [23, 25].
The outer layer, referred to as the diffuse layer, is a three dimensional region of scattered ions, which extends from the OHP into the bulk solution. Such an ionic
15 distribution reflects the counterbalance between ordering forces of the electrical field and the disorder caused by a random thermal motion [23, 25].
2.3.3 Electrode materials
The choice of an electrode material depends on a great extent on the useful potential range of the electrode in the particular solvent employed and the purity of the materials [11, 23, 25, 27]. The usable potential range is limited by one or more of the following factors: decomposition of the supporting electrolyte and electrode dissolution or formation of a layer of an insulating/semiconducting substance on its surface [23].
Additionally, solid electrodes can be adversely affected by poisoning through contact with solutions containing contaminants [11, 23, 27]. Of the many solid materials that can be used as working electrode the most frequently used are platinum, carbon and gold. One of the most important factors when working with solid materials is that the analysis is dependent of the surface state of the electrodes [23]. This way these electrodes need to go through a process of pretreatment and polishing to obtain reproducible results [23].
Gold is most often used as redox electrode for studying electron transfer kinetics and mechanism, and determining thermodynamic parameters, due in large part to its inertness [23, 27]. Still, in certain electrochemical conditions gold can be highly active [23]. A general advantage of metal electrodes is that their high conductivity results in low background currents [11, 23, 27]. Their surfaces can be modified by electrodeposition or chemical modification. Another advantage of the use of metal electrodes is the ease of construction of the electrode assembly, and ease of polishing [11, 23, 27]. At last, gold has unique properties to provide a suitable microenvironment for biomolecules immobilization retaining their biological activity, and to facilitate electron transfer between the immobilized proteins and electrode surfaces.
16
2.3.4. Electrochemical Techniques
2.3.4.1 Cyclic voltammetry
Cyclic voltammetry (CV) is the most used technique to obtain qualitative information about electrochemical reactions and it is often the first applied technique for the electrochemical study of a compound, a biological material, or an electrode surface [23-26]. The application of CV results from its capability for rapidly detect the redox behavior over a wide potential range and to provide information on kinetics of heterogeneous electron-transfer reaction and on coupled chemical reactions or adsorption processes [23-26]. It enables the electrode potential to be rapidly scanned in search of redox couples. Once located, a couple can be characterized from the potentials of peaks on the cyclic voltammogram and from changes caused by variation of the scan rate [23-25].
CV consists of cycling the potential of an electrode and measuring the resulting current [23, 25, 28]. The excitation signal for CV is a linear potential scan with a triangular waveform (Figure 8) [28, 30]. The potential excitation signal sweeps the potential of the electrode between two values, designed the switching potentials [28]. The excitation signal causes, in the first place, the potential to scan positively versus the reference electrode at which point the scan direction is reversed causing a negative scan back to the original value (Figure 8) [28].
The peak current for a reversible couple at a normal-sized planar electrode is described (at 298 K) by the Randles–Sevcik equation [30]:
(2)
where the peak current ip is in amperes, n is the number of electrons transferred in redox
events, the electrode area A is in cm2, the diffusion coefficient D is in cm2/s, v is in V/s and the bulk concentration of the reactant c is in mol/cm3.
17
Figure 8 - Typical excitation signal for CV - a triangular potential waveform with switching potentials at V1 and V2 [31].
2.3.4.2 Square-wave voltammetry
Square-wave voltammetry (SWV) is a further improvement of staircase voltammetry, which is itself a derivative of linear sweep voltammetry [23, 25, 26, 32]. In linear sweep voltammetry the current at a working electrode is measured while the potential between the working electrode and a reference electrode is swept linearly in time. SWV is a large amplitude differential technique in which a waveform is composed by symmetrical square waves [23, 25, 26]. The excitation signal in SWV (Figure 9) consists of a symmetrical square-wave pulse of amplitude superimposed on a staircase waveform, where the forward pulse of the square wave coincides with the staircase step [23, 25, 26]. The current is sampled twice during each square-wave cycle, once at the end of the forward pulse and once at the end of the reverse pulse. The current is measured at the end of each potential change so that the contribution to the current signal from the capacitive charging current is minimized [25, 32]. The net current is obtained by taking the difference between the forward and reverse currents and is centered on the redox potential [25]. The peak height is directly proportional to the concentration of the electroactive species and direct detection limits as low as 10–8 mol/L are possible [23, 25]. The fact that net current is large compared to either forward or backward current and coupled with effective discrimination against the charging current, allows the achievement of excellent sensitivity in SWV [24, 25].
SWV has several advantages, namely excellent sensitivity and the minimization of background currents [23-26]. One of the major advantages is also its speed [24]. The effective scan rate is of the order of 500 mV/s and as a result, the analysis time is drastically reduced [24]. Frequencies of 1 to 100 square-wave cycles per second permit
18 the use of extremely fast potential scan rates [24]. The analysis time is reduced and a complete voltammogram can be recorded within a few seconds [24]. Another advantage of this technique is the minimization of oxygen interference. In stripping voltammetry during the preconcentration step the dissolved oxygen is irreversibility reduced at potentials sufficiently negatives and it is depleted from the electrode surface. During the stripping step at elevated scan rates and high frequencies, oxygen does not have enough time to reach again the electrode surface. The detection limits of this technique can be compared to those of chromatographic and spectroscopy techniques [23, 25, 32].
SWV is the most used voltammetric technique for quantification and it is applied in the study of electrode kinetics with regard to preceding, following, or catalytic homogeneous chemical reactions, determination of some species at trace levels, and it is used with electrochemical detection in HPLC [23, 25, 33].
19
2.3.4.3 Electrochemical Impedance Spectroscopy
Electrochemical Impedance Spectroscopy (EIS) or AC impedance methods have seen tremendous increase in popularity in recent years [34]. Initially applied to the determination of the double layer capacitance, they are now applied to the characterization of electrode processes and complex interfaces [34]. EIS studies the system response to the application of a periodic small amplitude AC signal. These measurements are carried out at different AC frequencies and analysis of the system response contains information about the interface, its structure and reactions taking place there [34]. By varying the excitation frequency of the applied potential over a range of frequencies, one can calculate the complex impedance, sum of the real and imaginary impedance components, of the system as a function of the frequency (i.e. angular frequency, w) [35]. Therefore, EIS combines the analysis of both real and imaginary components of impedance, namely the electrical resistance and reactance [29, 34, 35].
EIS possesses the ability to study any intrinsic material property or specific processes that could influence the conductivity/resistivity or capacitivity of an electrochemical system. Therefore, EIS is a useful tool in the development and analysis of materials for biosensor transduction, such as the study of polymer degradation [35]. However it is a complementary technique and other methods must also be used to elucidate the interfacial processes [34, 35].
The electric equivalent circuit first proposed by Randles, shown in figure 10, is commonly used in EIS for interpretation of impedance spectra [29]. It includes a solution resistance (Rs), a double layer capacitor (Cd) and a charge transfer (Rct) or polarization resistance (Rp). When the charge transfer takes place at the interface, the mass transports of the reactant and product take on roles in determining the rate of electron transfer, which depends on the consumption of the oxidants and the production of the reductant near the electrode surface [29]. The mass transport of the reactants and the products provides another class of impedance, Warburg impedance (ZW), which can be exploited by electroanalytical chemists because it shows up in the form of a peak current in a voltammogram or a current plateau in a polarogram [29].
In addition, to be a useful model in its own right, the Randles model is the starting point for other more complex models [29]. The double layer capacity is parallel with the impedance due to the charge transfer reaction [29]. Figure 10 shows an example of a Nyquist plot for a Randles cell. The solution resistance can be found by
20 reading the real axis value at the high frequency intercept, which is the intercept near the origin of the plot [29]. The value at the right side of the real axis (low frequency region) is the sum of the charge transfer resistance and the solution resistance [29]. The intermediate-frequency component (circle) arising from the Rp and Cd is located in
between [29]. In a simple situation, the Warburg element manifests itself in EIS spectra by a line with an angle of 45 degrees in the low frequency region [29].
Figure 10 - a) A schematic diagram of an idealized Randles electrical equivalent circuit [29]; b) Nyquist plot showing the high and low frequency components [34].
For electrochemical sensing, impedance techniques are useful to monitor changes in electrical properties arising from biorecognition events at the surfaces of modified electrodes. For example, changes in the conductivity of the electrode can be measured as a result of protein immobilization and antibody-antigen reactions on the electrode surface [35].
EIS has become a mature and well understood technique. It is now possible to acquire, validate and quantitatively interpret the experimental impedances. However, the most difficult problem in EIS is modeling of the electrode processes. There is almost an infinite variety of different reactions and interfaces that can be studied (corrosion, coating, conducting polymers, batteries and fuel cells, etc.) and the main effort is now applied to understand and analyze these processes [35].
21
2.4 Biosensors
Biosensors are, by definition, sensing devices including a biological component (enzyme, antibody, animal or plant cell, oligonucleotide, lipid, microorganisms, etc.) intimately connected to a physical transducer (electrode, optical fiber, vibrating quartz, etc.) (Figure 11) [35, 36]. This dual configuration permits a quantitative study of the interaction between the analyte and an immobilized biocomponent [36, 37]. Designed for the purpose, biosensors are generally highly selective due to the possibility to tailor the specific interaction of compounds by immobilizing biological recognition elements on the sensor substrate that have a specific binding affinity to the desired molecule [35-38]. Typical recognition elements used in biosensors are: enzymes, antibodies, nucleic acids and cells. Ideally, biosensors should be readily implemented and allow for low reagent and energy consumption [35, 36, 39-42].
Nowadays, a lot of biosensors can be found in laboratories around the world but only one is known by its great ratio efficiency/cost and that is the glucose sensor. The major limitation, in several cases, in developing sensing devices is associated with the ability to miniaturize the transduction principle and the lack of cost-effective production method [37, 41]. Biosensors have an important role due to their inherent advantages as robustness, easy miniaturization, excellent detection limits, possibility of using small analyte volumes, and ability to be used in turbid biofluids with optically absorbing and fluorescing compounds [35].
22 In order to construct a successful biosensor a number of conditions must be met [35]:
1. The biocatalyst must be highly specific for the purpose of the analysis, be stable under normal storage conditions and show a low variation between assays. 2. The reaction should be as independent as manageable of such physical
parameters as stirring, pH and temperature. This will allow analysis of samples with minimal pre-treatment. If the reaction involves cofactors or coenzymes these should, preferably, also be co-immobilized with the enzyme.
3. The response should be accurate, precise, reproducible and linear over the concentration range of interest. It should also be free from electrical or other transducer induced noise.
4. If the biosensor is to be used for invasive monitoring in clinical situations, the probe must be tiny and biocompatible, having no toxic or antigenic effects. Furthermore, the biosensor should not be prone to inactivation or proteolysis. 5. For rapid measurements of analytes from human samples it is desirable that the
biosensor can provide real-time analysis.
6. The complete biosensor should be cheap, small, portable and capable of being used by semi-skilled operators.
23
2.5 Electrochemical immunosensors
Immunosensors are affinity ligand-based biosensing devices that couple immunochemical reactions to appropriate transducers [43]. In recent decades, immunosensors have received rapid development and wide applications with various detection formats. The general working principle of the immunosensors is based on the fact that the specific immunochemical recognition of antibodies (antigens) immobilized on a transducer to antigens (antibodies) in the sample media can produce analytical signals dynamically varying with the concentrations of analytes of interest [43-45]. The merits of immunosensors are related to selectivity and affinity of the antibody-antigen reaction [46]. Here, the highly specific binding between the antibody and the antigen involves different types of interaction forces, basically hydrophobic and electrostatic interactions, van der Waals forces and hydrogen bonding. The antigen–antibody reaction is reversible and, owing to the relative weakness of the forces holding the antibody and antigen together, the complex formed would dissociate in dependence upon the reaction environment (e.g. pH and ion strength) [43]. High specificity is achieved by the molecular recognition of target analytes (usually the antigens) by antibodies (biological recognition element) to form a stable complex on the surface of an immunoassay system or an immunosensor [40, 43, 47-49]. On the other hand, sensitivity depends on several factors including the use of high affinity analyte-specific antibodies, their orientation after being immobilized on the immunoassay or immunosensor surface and the appropriate detection system for measuring the analytical signal [48, 49]. This recognition reaction defines the high selectivity and sensitivity of the transducer device [43]. The electronic part is used to amplify and digitalize the physicochemical output signal from the transducer devices such as electrochemical (potentiometric, conductometric, capacitative, impedance, amperometric), optical (fluorescence, luminescence, refractive index), and microgravimetric devices [43].
Electrochemical immunosensors have been applied to several fields of science including medical diagnosis [44, 45, 50], environmental analysis [51, 52] and biological process monitoring [53]. In the biological area, considerable efforts have been devoted to the development of precise, rapid, sensitive, and selective immunosensors by measurement of the markers or pathogenic microorganisms responsible for the diseases, such as proteins, enzymes, viruses, bacteria, and hormones [47, 54-57]. This technology gains practical usefulness from a combination of selective biochemical recognition with
24 the high sensitivity of electrochemical detection [58]. With the development of technology, such biosensors profit from miniaturized electrochemical instrumentation and are thus very advantageous for some sophisticated applications requiring portability, rapid measurement and use with a small volume of samples [58]. Several reviews confirm the attractive advantages of electrochemical biosensors [9, 10, 59-62].
2.5.1 The antibody-antigen interaction
The fundamental basis of all immunosensors is the specificity of the molecular recognition of antigens by antibodies to form a stable complex. Antibodies are a family of glycoproteins known as immunoglobulins (Ig). There are generally five distinct classes of glycoproteins (IgA, IgG, IgM, IgD, and IgE) with IgG being the most abundant class (approximately 70%) and most often used in immunoanalytical techniques [48, 63]. IgG is a “Y”-shaped molecule based upon two distinct types of polypeptide chains (Figure 12). The molecular weight of the smaller (light) chain is approximately 25 kDa, while that of the larger (heavy) chain is approximately 50 kDa. In each IgG molecule, there are two light and two heavy chains held together by disulfide linkages [48, 63].
Antibodies show very high specificity and binding constants toward their corresponding antigens. An antigen has been defined as any agent that gives rise to antibody formation specific for that agent when transferred to a living cell system containing cells of the immunologically competent type [48, 63].
25
Figure 12 - A schematic illustrating the “Y”-shaped structure of an antibody [48].
2.5.2 Immunoassays
Immunoassay is the predominant analytical technique for quantitative measurements, being used over a wide range of concentrations, in many different biological matrices, and in a range of delivery formats. Immunoassays are the quantitative methods of analysis where antibodies are the primary binding agents for the antigen (which is often the analyte) of interest [9, 43, 46, 48].
All immunoassays depend on measuring the fractional occupancy of the recognition sites. Usually, immunoassays are heterogeneous, which means that either the antibody or the antigen is immobilized on a solid carrier and an immunocomplex is formed upon contact with a solution containing the other immunoagent while homogeneous immunoassays take place in the solution phase. Compared to homogeneous immunoassays, the heterogeneous immunoassays are easily designed and constructed. The unbound proteins are removed by washing and the response obtained from the labels is proportional to the amount of protein bound. However, such a measurement can rely on either the evaluation of occupied sites or, indirectly, on measuring unoccupied sites. This leads to the development of either a “competitive” or a “non-competitive” immunoassay format [46, 48].
In a competitive immunoassay (Figure 13), unlabeled analyte in the test sample is measured by its ability to compete with the labeled antigen for a limited number of
26 antibody-binding sites [46, 48]. In electrochemical immunoassays, an enzyme label or an electroactive label is commonly used. Quantitative analysis can be achieved by determining the amount of labeled analyte that interacted at the binding sites [48]. Therefore, with a fixed number of antibody sites, a smaller signal is expected when the ratio between the quantities of sample to labeled analyte is large [48]. In contrast, a larger signal is obtained when there is a small quantity ratio. Therefore, the signal produced by the bound labeled analyte is usually inversely proportional to the amount of sample analyte [46, 48].
Non-competitive immunoassays (also known as a “sandwich” immunoassay) give the highest level of sensitivity and specificity because of the use of a couple of match antibodies. In this format the sample analyte is captured by an excess of a capture antibody, separating it from the bulk sample [48]. The captured analyte is then exposed to an excess of second signal antibody (secondary antibody (Ab2)), which will only bind to the existing capture antibody-analyte complex [48]. This structure is a classic two-site immunoassay complex in which the analyte is sandwiched between two antibodies (Figure 13). High-affinity antibodies and appropriate labels are usually employed for the amplification of electrochemical signal [46, 48]. Enzyme-labeled antibodies are often used as detection antibodies that result in amplification of the measurement signal [46, 48]. In an ideal non-competitive immunoassay, no signal would be produced in the absence of any analyte because there are no appropriate sites available for binding to the signal antibody [48]. However, in practice, this is not the case due to nonspecific interactions between the signal antibody and other components of the immunoassay [48]. Therefore, it is always desirable to use a blocking reagent to reduce these nonspecific interactions. Nonspecific adsorption also needs to be considered when determining the quantity of signal antibody for use in a system [48]. Although this immunoassay format often offers superior specificity, it can only be used for the quantification of analytes with two antigenic determinants that can be simultaneously recognized [46, 48]. Several studies using both competitive and non-competitive immunoassays have been reported [64-67].
Electrochemical detection of immunointeraction can be performed both with and without labeling. A frequently used format in electrochemical immunosensing is an amperometric immunosensor, where proteins are labeled with enzymes producing an electroactive product from an added substrate [9].
27 Direct detection without labeling can be performed by cyclic voltammetry, chronoamperometry, impedimetry, and by measuring the current during potential pulses (pulsed amperometric detection). These methods are able to detect a change in capacitance and/or resistance of the electrode induced by binding of protein. These immunosensors have been developed using various substrates [9].
Figure 13 - Schematic representation of (a) competitive and (b) non-competitive immunoassay formats [48].
A critical issue in immunoassays is minimization of nonspecific binding (NSB) of interfering species in samples such as serum or blood, as well as NSB of the labeled Ab2 that arises when this signal producing species is bound to non-antigen sites on the sensor [68]. In labeled assays, non-enzyme Ab2 bound to sites other than the analyte protein still gives a signal, but it is not proportional to the analyte protein concentration. This can increase detection limits and degrade sensitivity [68]. NSB is usually minimized by washing with a cocktail that includes casein or bovine serum albumin and detergents in NSB blocking steps. Another solution consists in tailoring the sensor surface with appropriate chemical groups that can also inhibit protein adsorption, and one of the most effective surfaces features polyethylene glycol (PEG) moieties [69, 70]. Such functionalized surfaces, although useful, may still permit small amounts of NSB that could significantly increase background in the pg to ng/mL analyte concentration ranges [68].
28
2.5.3 Antibody immobilization techniques
Since immunosensors usually measure the signals resulting from the specific immunoreactions between the antigens and the antibodies, it is clear that the immobilization procedures of the antibodies on the surfaces of transducers should play an important role in the construction of immunosensors.
The manner in which a capture antibody is immobilized on a solid phase is a critical aspect that requires careful consideration in the design of an immunoassay system, whether it is competitive or non-competitive. A desirable feature of the chosen method is that it results in an immobilized capture antibody that is oriented with minimal steric hindrance to interact favorably with its target antigen. Equally important, it is highly desirable to immobilize the antibody without a significant change in its ability to bind its antigen. Clearly, all these features have a direct bearing on the level of sensitivity and dynamic range achievable by an immunosystem. There are several strategies for immobilizing a capture antibody on a solid phase including covalent attachment, physical adsorption or electrostatic/physical entrapment in a polymer matrix. These commonly used immobilization strategies are described below [48].
2.5.3.1 Biotin-(strept)avidin interaction
Specific affinity interactions for antibody immobilization have been widely used in immunoassay systems in recent years. The (strept)avidin–biotin interaction is one such example. This technique may be used to immobilize various types of biomolecules such as nucleic acids, polysaccharides and proteins, including the capture antibody in immunoassay/immunosensor systems. The technique usually involves biotinylating the capture antibody and coating a solid phase with either avidin or streptavidin [48, 71].
The avidin-biotin and biotin–streptavidin interactions are the strongest known non-covalent interactions, presenting dissociation constants of the order of 10-15 mol/L, between a protein and ligand [72]. The complexes formations are very rapid, and once formed withstand high temperatures, pH variations, and are resistant to dissociation when exposed to chemicals such as detergents and denaturing agents [48, 73]. Equally important, the use of this immobilization technique maintains the biological function of the immobilized antibody. In some cases, neutravidin, which is an almost neutrally charged variation of avidin, is used to minimize any non-specific binding by charged species to maintain high binding affinity for biotin [48, 71].
29 Despite the several mentioned advantages the biotin-(strept)avidin complex is not amenable to multiplex experiments. Because any biotinylated molecule will bind to any biotin-binding protein, these reagents must be used in combination with other detection-probe systems (i.e., primary-secondary antibodies) for multiplex experiments. Also, because biotin is a biological molecule, endogenous biotin can cause background and specificity issues when performing assays with certain biotin-rich tissues and extracts (i.e., brain, liver, milk, eggs, corn). In addition, the strength of the interaction between biotin and avidin may also influence the application for which this binding is required, as the harsh conditions required to break the avidin-biotin bonds may denature target proteins.
2.5.3.2 Antibody-binding proteins
Another commonly used affinity-based immobilization technique for capture antibodies in immunoassay systems involves a bacterial antibody-binding protein. Protein A and Protein G are the two most common [48]. These proteins bind specifically to antibodies through their non-antigenic (Fc) regions, which allow the antigen binding sites of the immobilized antibody to be oriented away from the solid phase and be available to bind the target analyte. As these proteins interact directly with the Fc region of antibodies, there is no need for antibody biotinylation [48].
Protein A has a molecular weight of approximately 42 kDa and was originally isolated from the cell wall of Staphylococcus aureus [74]. It is known to contain five Fc binding domains located towards its -NH2 terminal [48]. Optimal binding occurs at pH 8.2, although binding is also effective at neutral or physiological conditions (pH 7.0 to 7.6). However, the interaction between Protein A and IgG is not equivalent for all species. Even within a species, Protein A interacts with some subclasses of IgG and not others [48]. The binding capacity of Protein A is limited to three human IgG subclasses (IgG 1, 2 and 4) [75]. Also, Protein A will not bind to goat and rat IgG, and only weakly to mouse IgG [76].
The second bacterial antibody binding protein, Protein G, is a cell surface protein of group C and G streptococcus with three Fc binding domains located near its C-terminal, and has specificity for subclasses of antibodies from many species [75]. Optimal binding occurs at pH 5.0, although binding is also effective at pH 7.0 to 7.2. Protein G has greater affinity than Protein A for most mammalian IgGs. However there are inconsistencies in reported binding properties of IgG to Protein G. Variations in
![Figure 5 - Proposed model of Aβ-induced synaptotoxic effects and synapse elimination in AD [22]](https://thumb-eu.123doks.com/thumbv2/123dok_br/19172872.941962/23.892.137.766.110.400/figure-proposed-model-induced-synaptotoxic-effects-synapse-elimination.webp)
![Figure 7 - Schematic representation of the electrical double layer. IHP-inner Helmholtz plane; OHP-outer Helmholtz plane [29]](https://thumb-eu.123doks.com/thumbv2/123dok_br/19172872.941962/27.892.309.601.304.690/figure-schematic-representation-electrical-double-layer-helmholtz-helmholtz.webp)
![Figure 8 - Typical excitation signal for CV - a triangular potential waveform with switching potentials at V 1 and V 2 [31]](https://thumb-eu.123doks.com/thumbv2/123dok_br/19172872.941962/30.892.203.707.111.320/figure-typical-excitation-triangular-potential-waveform-switching-potentials.webp)
![Figure 10 - a) A schematic diagram of an idealized Randles electrical equivalent circuit [29]; b) Nyquist plot showing the high and low frequency components [34].](https://thumb-eu.123doks.com/thumbv2/123dok_br/19172872.941962/33.892.133.758.332.546/schematic-idealized-randles-electrical-equivalent-nyquist-frequency-components.webp)
![Figure 11 - Components of typical biosensor [35].](https://thumb-eu.123doks.com/thumbv2/123dok_br/19172872.941962/34.892.164.780.783.1114/figure-components-of-typical-biosensor.webp)
![Figure 12 - A schematic illustrating the “Y”-shaped structure of an antibody [48].](https://thumb-eu.123doks.com/thumbv2/123dok_br/19172872.941962/38.892.247.639.112.479/figure-schematic-illustrating-y-shaped-structure-antibody.webp)
![Figure 13 - Schematic representation of (a) competitive and (b) non-competitive immunoassay formats [48].](https://thumb-eu.123doks.com/thumbv2/123dok_br/19172872.941962/40.892.237.698.323.626/figure-schematic-representation-competitive-non-competitive-immunoassay-formats.webp)