UNIVERSIDADE DA BEIRA INTERIOR
Ciências da Saúde
Phenotypic changes induced by IL-15 in human
CD8
+
T cells in vitro
Diogo Ministro Ferreira
Dissertação para obtenção do Grau de Mestre em
Ciências Biomédicas
(2º ciclo de estudos)
Orientador: Prof. Doutor Fernando Arosa
Coorientadora: Profª. Doutora Elsa Cardoso
Agradecimentos
Em primeiro lugar agradeço ao meu orientador, Professor Doutor Fernando Arosa, por toda a ajuda prestada e pela oportunidade que me deu para poder trabalhar durante o último ano numa área científica pela qual tenho bastante interesse. Um muito obrigado pelas horas de dedicação e por partilhar comigo os seus conhecimentos ao longo do ano. Agradeço ainda todo o cuidado que teve na correção da minha dissertação nestes últimos meses. Agradeço também à Professora Doutora Elsa Cardoso pela simpatia e pelos preciosos ensinamentos no trabalho laboratorial. À Raquel, por toda a ajuda e paciência na minha adaptação ao CICS e também pela colaboração importante na revisão desta dissertação.
Ao Centro Hospitalar Cova da Beira (Covilhã), em particular ao Dr. Jorge Martinez, pela colaboração e por fornecer as amostras utilizadas para o desenvolvimento do meu projeto. A todos os funcionários do Serviço de Imunohemoterapia do Centro Hospitalar Cova da Beira pela disponibilidade e simpatia, em particular ao Sr. Rui por me fazer sentir como mais uma pessoa pertencente àquela “casa”.
À minha família e em especial aos meus pais, por tudo. Por festejarem comigo as minhas vitórias e por me apoiarem nos momentos menos bons. Por acreditarem sempre em mim. Por tornarem tudo isto possível e por ainda hoje contribuírem todos os dias para a minha educação.
À minha irmã, pelas conversas e pela amizade. Por me ver como um modelo para ela própria, o que me enche de orgulho mas também de responsabilidade. Por nem sempre dizer o que gosto de ouvir.
À Daniela, por ser a minha força, sobretudo no último ano. Por me ouvir e compreender, por estar sempre presente e disponível para ajudar. Por ser o meu exemplo de determinação e por festejar as minhas conquistas como se dela se tratassem. Obrigado por todo o carinho, amizade e apoio.
Ao João Martins e ao Tiago Festas, por todas as conversas e por todos os momentos. Obrigado por serem, na verdade, dois irmãos que levo para a vida.
A todos os elementos do “#9”, com quem partilhei grande parte da minha vida académica e sem os quais estes anos não teriam sido os mesmos.
Resumo Alargado
As respostas e o desenvolvimento/comportamento do Sistema Imunológico são dependentes de citocinas. Dentro das várias citocinas, a Interleucina-15 (IL-15), pertencente à família c, tem um papel essencial no desenvolvimento, homeostase e funções nas células NK e nas células T CD8+. A IL-15 é uma citocina produzida por múltiplos tecidos e células incluindo células do estroma da medula óssea, células epiteliais e monócitos/macrófagos. Estudos recentes demonstraram que a IL-15 tem o potencial de diferenciar células T CD8+ naïve em células T CD8+ do tipo NK (do inglês “NK-like CD8+ T cells”). Este conjunto de células, recentemente descoberto, constitui um tipo de células T capaz de suprimir a expressão de marcadores de células T naïve (por exemplo, CD28) e, por outro lado, expressar recetores anteriormente associados apenas a células NK (CD56, CD94/NKG2A, KIR, etc.). Estas células T CD8+ com recetores de células NK são atualmente importante objeto de estudo em Imunologia não só por serem uma importante parcela das células CD3+ circulantes em indivíduos idosos mas também por estarem aumentadas em pacientes com inflamações crónicas e distúrbios metabólicos. Além disso, estudos recentes associaram este tipo de células a uma população capaz de se tornar leucémica quando estimulada com IL-15. Por todas estas razões, a IL-15 pode vir a ter um papel importantíssimo enquanto alvo terapêutico.
O objetivo principal deste trabalho foi estudar, in vitro, o efeito da IL-15 na diferenciação de células T CD8+ isoladas nomeadamente na expressão de recetores de células NK como o CD16, CD56, CD57 e CD335 e do recetor de linfócitos T CD8+, CD8. Nesse sentido, foram analisadas dez amostras de linfócitos T CD8+CD56- isoladas a partir de flebotomias de pacientes com sobrecarga de ferro ou com eritrocitose a serem seguidos no serviço de Imunohemoterapia no Centro Hospitalar da Cova da Beira. O procedimento experimental dividiu-se em quatro fases essenciais: 1) isolamento das células T CD8+ a partir de amostras de sangue e com recurso a um protocolo de isolamento de células mononucleares seguido de isolamento de células T CD8+CD56- por separação magnética; 2) Marcação das células com CFSE para posterior análise da divisão celular; 3) Cultura de doze dias em meio RPMI com 5% de soro humano inativado e 10 ng de IL-15 recombinante. O estímulo de IL-15 foi adicionado ao dia 0 e ao dia 6 da cultura. 4) Análise da expressão de CD16, CD56, CD335/NKp46 e CD8 por citometria de fluxo após os 12 dias de cultura com IL-15. Esta análise foi posteriormente comparada com a análise controlo realizada antes da cultura.
Os resultados mostraram que a purificação de células T CD8+CD56- apenas atingiu purezas na ordem dos 56%, sendo que em algumas experiências a pureza atingiu os 80%. Devido ao facto de a pureza não se aproximar dos 100% e de existirem células CD3-CD8+ (presumivelmente células NK), a análise dos recetores foi efetuada apenas dentro das regiões selecionadas para este tipo de células no software de análise de citometria de fluxo. A posterior análise em
células CD3-CD8+ serviu como controlo positivo para o estudo de alguns recetores. A cultura em meio com IL-15 levou a alterações significativas ao dia 12 em células CD3+CD8+, nomeadamente ao aumento de células com os recetores CD56 e CD57 e à diminuição da expressão do corecetor CD8 quando comparado com o dia 0, ou seja, antes da cultura. Para os recetores CD16 e CD335/NKp46 não se verificaram alterações significativas.
No conjunto, os resultados obtidos sugerem que a IL-15, uma citocina altamente expressa em situações de inflamação crónica, pode ter um papel crucial no desenvolvimento de células T CD8+ do tipo NK, demonstrado pelo aparecimento de recetores NK e diminuição do recetor CD8 em células T CD8+. Apesar de existirem ainda poucas informações quanto a este tipo de células e qual o seu papel no envelhecimento e desenvolvimento de diversas doenças (por exemplo, leucemia), vários estudos apontam para o possível envolvimento da IL-15 nestas situações e consequentemente para o enorme potencial desta interleucina enquanto alvo terapêutico.
Palavras-chave
Abstract
Interleukin-15 (IL-15) is a type I cytokine that belongs to the common cytokine-receptor -chain family and that plays a role in development, homeostasis and immune functions of NK and CD8+ T cells. Recent studies have shown that IL-15 is capable of differentiating human naïve CD8+ T cells into NK-like CD8+ T cells displaying a multifunctional phenotype. NK-like CD8+ T cells constitute a subset of mainstream T lymphocytes that down-regulate expression of naïve T cell markers (e.g., CD8, CD28) and, in contrast, express receptors previously thought to be expressed exclusively by NK cells (e.g. CD56, CD94/NKG2A, KIR, etc.). Under many different designations, these NK-like CD8+ T cells are the focus of intensive research because they not only constitute a significant proportion of circulating CD3+ T cells in healthy elderly individuals, including centenarians, but also in patients suffering from a variety of chronic inflammatory and metabolic disorders associated with aging. Regarding these data, the aim of this work was to study the effect of IL-15 on parameters of CD8+ T cell differentiation in vitro, namely expression of CD8 receptor and NK receptors such as CD16, CD56, CD57 and CD335. In order to achieve that, blood samples from ten patients with erythrocytosis or increased levels of serum ferritin being followed at the Immunohemotherapy service of CHCB were included in the study. CD8+CD56+ T cells were obtained from peripheral blood mononuclear cells (PBMC) after magnetic cell purification, labeled with CFSE and cultured for 12 days. IL-15 was added to the cultures on days 0 and 6. The percentage of CD16+, CD56+, CD57+, CD335+ and CD8β+ within dividing CD3+CD8+ T cells after the 12-day culture period was determined by flow cytometry. Student t-test was used to assess statistical differences in the expression of the studied receptors. Results showed that IL-15 induced a statistically significant increase in CD3+CD8+CD56+ and CD3+CD8+CD57+ T cells by day 12 when compared to day 0. In contrast, a statistically significant decrease in the percentage of CD3+CD8+ T cells was observed at day 12 when compared to day 0. No statistical differences were observed in the percentage of CD3+CD8+CD16+ and CD3+CD8+CD335+ T cells. All together, these results suggest that IL-15, a cytokine highly expressed during chronic inflammation, may have a role in the generation of NK-like CD8+ T cells. Given the growing role of these CD8+ T cells in health and disease they may be turn up to be therapeutic targets.
Table of Contents
I. Introduction
1. IL-15 signaling and functions 1.1. IL-15 functions
1.2. Trans-presentation model
1.3. IL-15 signaling: roles in health and disease 2. IL-15 and NK-like T cells
2.1. NKT cells versus NK-like T cells
2.2. NK cell receptors and subsets in the context of CD8+ T cells
II. Aims of the study III. Materials and Methods
1. Subjects in study 2. Reagents and antibodies
3. Isolation of Peripheral Blood Mononuclear Cells 4. Magnetic CD8+ cell purification
4.1. Magnetic Labeling
4.2. Magnetic Separation using LS columns 5. CFSE labeling
6. Cell culture conditions 7. Flow Cytometry Analysis 8. Statistical Analysis
IV. Results
1. Isolation of CD8+ T cells from PBMC samples
2. Proliferation of CD8+ T cell preparations after long-term culture with IL-15 3. Phenotypic changes in CD8+ T cells after long-term culture with IL-15
V. Discussion VI. Conclusions 1. Future Perspectives VII. References 1 1 2 3 5 7 7 9 12 14 14 14 15 16 16 17 17 18 18 19 21 21 23 26 33 38 38 40
List of Figures
Figure 1. IL-15 production and functions Figure 2. Trans-presentation of IL-15
Figure 3a. Intracellular signaling by IL-15 Figure 3b. Therapeutic approaches for IL-15 Figure 4. PBMC Isolation from phlebotomy bags Figure 5. Representative scheme of culture plates
Figure 6. Schematic representation of the isolation of CD8+ T cells from a representative PBMC sample
Figure 7. Lymphocyte:Monocyte ratio among all samples studied Figure 8. Effect of IL-15 on lymphocyte growth
Figure 9. Effect of IL-15 on lymphocyte viability
Figure 10. Percentage of live lymphoblasts and dead lymphocytes after 12-day culture
with IL-15
Figure 11. IL-15 induced lymphocyte proliferation
Figure 12. Schematic representation of the analysis of NK markers and CD8 in IL-15-stimulated lymphocytes
Figure 13. Effect of IL-15 on the expression of CD8, CD16, CD56, CD57 and CD335 by CD8+ T cells
Figure 14. Effect of IL-15 on the expression of CD8, CD16, CD56, CD57 and CD335 by NK cells 3 4 5 6 16 18 21 22 23 24 24 25 26 27 30
List of Tables
Table 1. Invariant NKT cells versus NK-like T cells in humans
Table 2. Mouse anti-human fluorochrome-conjugated monoclonal antibodies used Table 3. CD3+CD8+ T cell percentage for each experiment at day 0
Table 4. Percentage of cells regarding NK and naïve markers at day 0 and at day 12
within CD3+CD8+ cells
Table 5. Percentage of NK and naïve markers in small cells and blasts at day 12
8 15 22 29 30
Abbreviations
Ab ALL AML BC Bcl-2 BSA CD CFSE CIK CTCL DC DN EDTA FACS FBS HH HIV HSA HTLV-1 IEL IFN iHS IL JAK LGL KIR MACS MAPK NF-kB NK NKR NKT PBL PBMC PBS PI AntibodyAcute Lymphoblastic Leukemia Acute Myeloid Leukemia Buffy Coat
B-cell Lymphoma 2 Bovine Serum Albumin Cluster of Differentiation
5-(and -6) Carboxyfluorescein diacetate succinimidyl ester Cytokine-induce killer
Cutaneous T-cell Lymphoma Dendritic Cells
Double Negative
Ethylenediaminetetraacetic Acid Fluorescence Activated Cell Sorter Fetal Bovine Serum
Hereditary Hemochromatosis Human Immunodeficiency Virus Human Serum Albumin
Human T-cell Lymphotrophic Virus-1 Intestinal Intraepithelial Lymphocytes Interferon
Inactivated Human Serum Interleukin
Janus Associated Kinases Large Granular Leukemia
Killer cell immunoglobulin-like receptors Magnetic-Activated Cell Sorting
Mitogen-Activated Protein Kinase Nuclear factor-kappa B
Natural Killer
Natural killer Receptor Natural Killer T Cells
Peripheral Blood Lymphocytes Peripheral Blood Mononuclear Cells Phosphate Buffer Saline Solution Propidium Iodide
PI3K PHA PSA PV RA RBC RNA SH STAT TCR Tf TNF WB c Phosphoinositide 3-kinase Phytohemagglutinin Penicillin/Streptomycin/Amphotericin B Polycythemia Vera Rheumatoid Arthritis Red Blood Cells Ribonucleic Acid
Secondary Hemochromatosis
Signal Transducer and Activator of Transcription T Cell Receptor
Transferrin
Tumor Necrosis Factor Wash Buffer
Phenotypic changes induced by IL-15 in human
I. Introduction
1.
IL-15 signaling and functions
Interleukin-15 (IL-15) was discovered in 1994 by two independent research groups and defined as a type I cytokine (1,2). Type I cytokines are a group of -helical bundle structures that include several interleukins as well as some growth and hematopoietic factors. One important family of type I cytokines is the common cytokine-receptor -chain (c) family, which consists of IL-2, IL-4, IL-7, IL-9, IL-21 and, as mentioned, IL-15 (3,4). Common c cytokines have critical roles in the development, proliferation, survival and differentiation of multiple cell lineages of both the innate and adaptive immune system (3,5). In Humans with X-linked severe combined immunodeficiency (X-SCID) the association of a mutation in the gene encoding c and the lack of T cells and Natural Killer (NK) cells suggest that the c receptor is crucial for the development of these cells. In addition, the fact that these immune defects in patients with X-SCID are much more severe than those lacking IL-2/15, supported the idea that c was shared by multiple cytokines (6).
IL-15 is considered a pleiotropic cytokine (7), with an important role in NK cell development, lymphocyte homeostasis and peripheral immune functions (8). Particularly, it is essential for the development of NK cells, and it is the defective signaling transmitted by the IL-15 receptor that results in the failure of NK-cell development in both X-SCID and Janus Associated Kinase 3 (JAK3)-deficient SCID (6). Whereas the roles of IL-15 in lymphocyte homeostasis are clear, its functions during immune activation are not. IL-15 and IL-15R expression are often upregulated during numerous types of infections, immune activation, and inflammatory diseases (9). IL-15 mRNA is produced by multiple tissues and cell types, including placenta, skeletal muscle, kidney, lung, heart, epithelial cells, fibroblasts, keratinocytes, nerve cells, monocytes, macrophages and dendritic cells (2,10–13). However, there is a discrepancy between the wide expression of IL-15 mRNA and the limited production of protein, which might be explained by the tightly regulated program at the level of transcription, translation, and intracellular trafficking, to avoid excessive protein production and secretion. The translation of IL-15 mRNA into protein is limited by the presence of multiple AUG initiation sites in the 5’-UTR region, a long signal peptide, and a negative regulatory element in the C-terminus of IL-15 mature protein sequence (4,12,14). In addition, multiple isoforms of IL-15R contribute to IL-15 regulation (4).
1.1. IL-15 functions
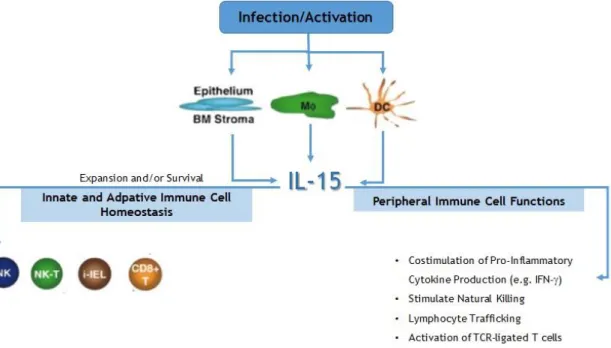
IL-15 is a homeostatic cytokine, with important activity on memory CD8+ T cells that express high levels of IL-2R (CD122) (3), as evidenced by data suggesting that IL-15 signals are not only essential for the differentiation of memory T cells but also for maintenance of this population. In fact, several lines of evidence suggest that co-stimulation of naïve precursors with IL-7 and IL-15 can lead to differentiation of CD8+ cell into memory T cells (15). The influence of IL-15 on antigen-independent expansion and differentiation of human CD8+ T cells was directly assessed by van Lier and collaborators (16). The results of this study revealed that both naïve and primed human T cells were able to divide in response to IL-15. Furthermore, naïve cells acquired the ability to produce Interferon-IFN- and Tumor Necrosis Factor (TNF-), expressed perforin and granzyme B and acquired cytotoxic properties. In addition, another in vitro study reported that hepatocytes and IL-15 seem to create a favorable micro environment for CD8+ T cells to survive and acquire NK receptors (17). One of the key features of memory T cells is their ability to survive as lineages of expanded cells in the absence of antigen- or TCR-mediated signals. Memory CD8+ T cells are selectively expanded by IL-15, which is consistent with the higher expression levels of IL2/15Rβ present on these cells in comparison with naïve CD8+ T cells or CD4+T cells. The expression of IL-15 and IL-15R was also found in the thymus, where it is believed that IL-15 signals may support the intrathymic differentiation of T cells. IL-15 was also associated with the expression of B-cell lymphoma 2 (Bcl-2) and CD44 in CD8+ thymocytes contributing to the regulation of CD8+ T cell differentiation (18). Although IL-15 does not play an essential role in the homeostatic expansion of memory CD4+ T cells, its absence affects the development of anti-viral CD4+ memory T cells (19). Other IL-15 reported functions include the regulation of T cell homeostasis, maintenance of Treg cells, T cell survival and proliferation through dendritic cells (DC) (3). Earlier works by Kennedy and colleagues and also by Lodolce and colleagues presented evidences that seems to corroborate some of the previous mentioned functions of IL-15 showing that IL-15-/- and IL-15R-/- mice both exhibit selective losses of memory phenotype CD8+ T cells, NK Cells, NKT cells, and subsets of Intra Epithelial Lymphocytes (IEL), suggesting that IL-15 may be responsible for triggering essential homeostatic signals in these subsets of cells. Figure 1 summarizes the different functions of IL-15.
Figure 1. IL-15 production and functions. Multiple cell types elaborate IL-15, including activated
monocytes/macrophages, dendritic cells and epithelium as well as constitutive production by bone marrow stromal cells. IL-15 has a critical role in the development of the NK lineage, as well as in its survival, expansion, and function. Other innate lymphocytes depend upon IL-15. Besides that, IL-15 also plays multiple roles in peripheral innate and adaptive immune cell function. Adapted from (8).
1.2. Trans-presentation model
The current theory of trans-presentation proposes that intracellular IL-15 binds to a high affinity IL-15 binding protein (i.e. IL-15R) that is shuttled to the cell surface where it stimulates IL-15 signaling components on neighboring cells through a cell-cell interaction (20). Different studies revealed that coordinated expression of IL-15 and IL-15R by the same cell type is needed for IL-15 responses by memory CD8 T cells, NK cells, and IEL giving further credibility to the model of trans-presentation (20).
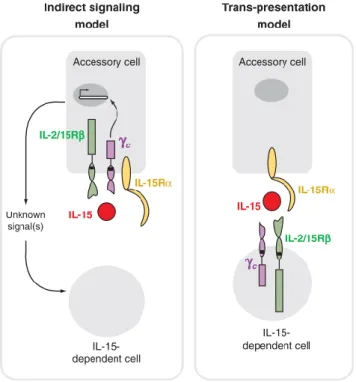
The surprising finding that IL-15R supports memory CD8+ T cells could be explained by at least two general models (Figure 2). In the first model, it is believed that IL-15 could bind to IL-15R receptors on accessory cells which in turn could produce proteins that will support IL-15 dependent cells, such as memory CD8+ T cells. A second model, may involve trans-presentation of IL-15 by IL-15R on the surface of accessory cells to IL-2/15R and c receptor chains on the surface of memory CD8+ T cells (9,18,20). Trans-presentation was first proposed in 2002 after the experimental observation that monocytic cell lines that expressed cell surface IL-15 and IL-15R could stimulate proliferation in neighboring T cells (21). Many recent studies have presented experimental evidences supporting the trans-presentation theory and its consequent involvement in the functions of IL-15. For instances, IL-15
trans-presentation has been implied in CD4+ homeostasis, and it is believed that trans-presentation of IL-15 is required for IL-15-mediated regulation to occur directly on CD4+ T cells (22). Despite the number of studies that have shown that IL-15R expression is not required by IL-15 dependent cells (i.e. CD8 T cells, NK cells and IEL), it is still unclear why some of these lymphocytes express high levels of IL-15R. The expression of IL-15R on these lymphocytes could result from the left over from an earlier evolutionary mechanism of IL-15 delivery that predates trans-presentation. When analyzing the crystal structure of IL-15R, it was found that the threonine/proline rich region, located between the transmembrane domain and the IL-15-binding domain, possesses potential flexibility (20). This implied that IL15R, in addition to trans-presenting IL-15, could also present IL-15 to an adjacent IL-15R/c on the same surface; this would constitute cis-presentation as opposed to trans-presentation (23). This method would be more feasible in cell types that are a source of IL-15 (i.e., DC).
More recently, a study reported that all the IL-15 detected in serum of melanoma patients treated with chemotherapy was present in the form of IL-15R/IL-15 complexes (24). However, it is currently uncertain whether IL-15 is ever present solely in a soluble form (9).
Figure 2. Trans-presentation of IL-15. IL-15R has two general mechanisms that may explain the
noncell-autonomous role of IL-15R in supporting IL-15 dependent cells. In indirect signaling (left), IL-15 binds to heterotrimeric IL-15 receptors on accessory cells and triggers signals that lead to the production of additional proteins, stimulating the survival and/or proliferation of IL-15 responsive cells. In the trans-presentation model (right), IL-15R on the surface of accessory cells alone binds IL-15 and presents to IL-2/15R and c receptor chains on the surface of IL-15-responsive cells. The interaction
1.3. IL-15 signaling: roles in health and disease
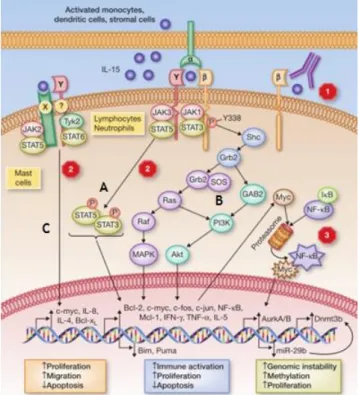
IL-15 initiates signal transduction events responsible for cellular activation through JAK and STAT proteins as a mean of initiating signal transduction for cellular activation. In lymphocytes, binding of IL-15 to the IL2/15R heterodimer induces JAK1 activation that subsequently phosphorylates STAT3, via the -chain and JAK3/STAT5 activation, via its -chain. STAT3 and STAT5 proteins form heterodimers that then translocate to the nucleus, where they activate transcription of the antiapoptotic Bcl-2 and proto-oncogenes (myc, c-fos, c-jun) as shown in Figure 3a (pathway A). On the other hand, IL-15-mediated Grb2 phosphorylation regulates both PI3K and MAPK pathways. These signaling mechanisms induce expression and activation of downstream effector molecules such as c-myc, c-fos, c-jun, Bcl-2, and Nuclear factor-kappa B (NF-B) as represented in figure 3a (pathway B) (25). In contrast with lymphocytes, mast cells express a distinct receptor to activate the JAK2/STAT5 pathway (26). IL-15 seems to engage the IL-2/15Rγ chain to induce rapid phosphorylation of Tyk2/STAT6 for Th2 type immune responses (27) as shown in Figure 3a (pathway C).
Figure 3a. Intracellular signaling by 15. In one scenario (A and B) 15 binds to its high-affinity
IL-15R expressed on an antigen-presenting cell and in turn is presented in trans to the IL-2/15R heterodimer. From there, effector cell activation can proceed via three distinct pathways: one involves JAK/STAT activation with the phosphorylated STAT proteins forming a heterodimer and trafficking to the nucleus for transcriptional activation; a second pathway involves the recruitment of Shc to a phosphorylated site on the IL-2/15R chain followed by activation of Grb2. From there, Grb2 can proceed down the PI3K pathway to phosphorylate Akt, or can bind the guanine nucleotide exchange factor SOS to activate RAS-RAF and ultimately MAPK. Each contributes to effector cell survival and activation. In mast cells (C), IL-15 signals through a unique receptor chain, IL-15RX to activate the JAK2/STAT5 pathway or can also bind to the common c to transmit its signals via Tyk2/STAT6 for
initiation of a survival (Bcl-XL) and a Th2 immune response. Numbers correspond to potential
The role of IL-15 has been considered extremely relevant in several human diseases. Besides the impact on cancer, discussed below, this cytokine may have a role in autoimmune and inflammatory diseases, such as Rheumatoid Arthritis (RA) (28), Sarcoidosis (29), Inflammatory bowel disease (30) among others (31). In addition, it is believed that IL-15 may also play a role in infectious diseases such as Human immunodeficiency virus (HIV), other viral and bacterial pathogens, and even in rejection of transplanted organs (8).
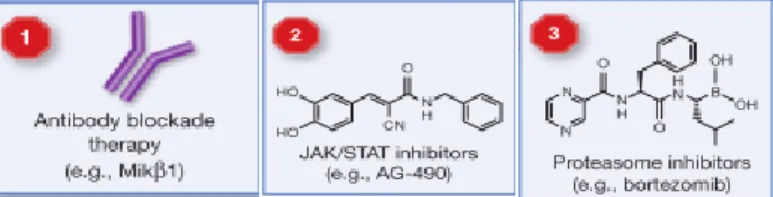
IL-15 participates in the development of important immune antitumor mechanisms including the formation of antitumor antibodies as well as the protection of T effector cells from the action of T regulatory cells (25,32,33). In pre-clinical studies IL-15 has been found to potentiate antitumor effects following pre-association with IL-15R, or when used in combination with chemotherapy, adoptive therapy, monoclonal antibodies, and tumor vaccines (32). Indeed, IL-15 is at the top of the National Cancer Institute’s list of agents with the greatest potential use in tumor therapy (34). The ability of IL-15 to activate many immune antitumor mechanisms makes it a good candidate for application in tumor therapy, considering that the most important cells engaged in IL-15 antitumor activity seem to be T cells, in particular CD8+ T cytotoxic cells and NK cells (32). The use of human recombinant IL-15 either alone or in combination with other regimens is currently being investigated in phase I/II clinical trials for the treatment of various types of cancer (35). On the other hand, it was recently shown that chronic stimulation with IL-15 is associated with malignant transformation of T and NK cells in experimental systems and clinical data from patients with cutaneous T-cell lymphoma (CTCL) (36), T-cell lymphotrophic virus-1 (HTLV-1) (37) and large granular lymphocytes (LGL) leukemia (38) seem to support its oncogene properties. To overcome this problem, different therapeutic approaches are being developed using anti-IL-15R antibody that prevents binding and signaling of IL-15 through its receptor. Pharmacologic inhibitors targeting the JAK/STAT pathway prevent activation and translocation of the STAT heterodimer to the nucleus. And finally, the use of proteasomal inhibitors such as bortezomib may also be helpful, preventing the action of NF-kB and Myc. These potential approaches are represented in Figure 3b.
Figure 3b. Therapeutic approaches for IL-15. (1) Using anti-IL15R antibody preventing binding and
signaling of IL-15 through its receptor. (2) Pharmacologic inhibitors targeting the JAK/STAT pathway prevent activation and translocation of the STAT heterodimer to the nucleus. (3) Proteasomal inhibitors such as bortezomib prevent activation of NF-κB and Myc. Each of these therapies targets IL-15 signaling in malignant cells but may have consequences for normal cells dependent upon IL-15. Adapted from
2.
IL-15 and NK-like T cells
Several studies have highlighted the importance of IL-15 for NK-like T cells. For instance, a recent study suggest that IL-15 and hepatocytes create a favorable microenvironment for T cells to survive and differentiate (17). This study showed that IL-15 was capable of inducing antigen-independent up-regulation of Natural Killer Receptors (NKR) and de novo expression of CD56 and NKp46 in CD8+CD56- T cells. This was confirmed afterwards, in a work that suggested clearly that IL-15 is capable of differentiating CD8+ T cells into NK-like T cells displaying a regulatory phenotype (39). Therefore, it is crucial to define and unveiled what is known about these NK-like T cells.
2.1. NKT Cells versus NK-like T Cells
In recent years the so-called natural killer T cells (NKT) have emerged as important regulators of the immune response. The existence of NKT-cell subsets, and other types of T cells that resemble NKT cells, is an ongoing source of confusion in the literature. The term ‘NK-T cells’ was first published in 1987 (40) and was used to define a subset of mouse T cells that shared some characteristics with NK cells, particularly the expression of the NK1.1 marker (later on designated as CD161c). The term “NKT cells” is now well accepted and is applied to mice, humans and other species. However, the classification of NKT cells has always been complicated by the fact that most commonly used mouse strains do not express the NK1.1 marker. Furthermore, as the field of NKT-cell research develops, it is becoming increasingly clear that the simplistic definition of NKT cells as NK1.1+ T cells is not only inaccurate, but also potentially misleading (41).
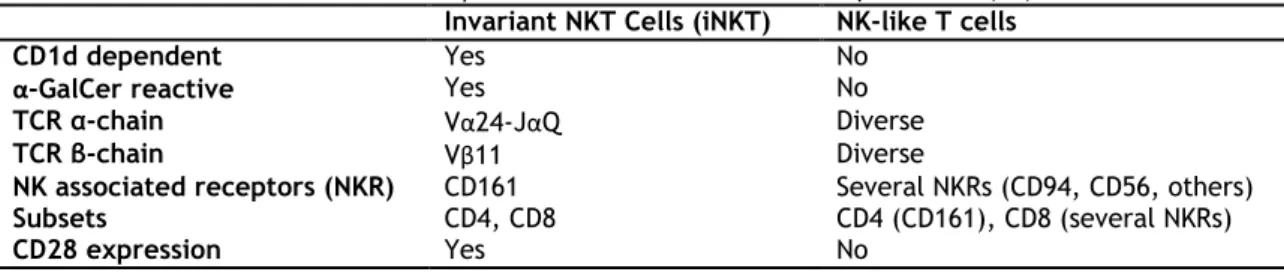
The term “NKT cell” has been applied to name subsets of T lymphocytes that have clear differences in their phenotype, functional capacities and tissue distribution. In humans, at least, two clear distinct subpopulations of T cells can be distinguished (Table 1): (a) a lineage of T cells expressing a semi-invariant TCR (V24J18), that are often referred as “classical”, “glycolipid-reactive”, “CD1d restricted” or “invariant” NKT cells; (b) a subset of conventional T lymphocytes that express NKR that have been called “non-classical”, “CD1d independent” NKT cells or “NK-like T cells” cells and that represent highly differentiated T cells that can express NKR (42).
Table 1. Invariant NKT Cells versus NK-like T cells in Humans. Adapted from (42).
Invariant NKT Cells (iNKT) NK-like T cells
CD1d dependent Yes No
α-GalCer reactive Yes No
TCR α-chain Vα24-JαQ Diverse
TCR β-chain Vβ11 Diverse
NK associated receptors (NKR) CD161 Several NKRs (CD94, CD56, others)
Subsets CD4, CD8 CD4 (CD161), CD8 (several NKRs)
CD28 expression Yes No
To further introduce confusion in the literature, some authors have subdivided NKT cells into type I and type II NKT cells, which are characterized by recognizing complexes of CD1d and galactosylceramide (-GalCer, a marine-sponge-derived glycolipid) and complexes of CD1d with glycolipids other than GalCer, respectively (43,44). For the sake of this thesis, however, the term NK-like T cells, that is CD8+ T cells expressing NKR and restricted by complexes of MHC class I molecules and peptides will be used throughout.
NK-like T cells constitute a subset of mainstream T lymphocytes that express some NKR (like CD16, CD56, CD57, CD161, CD94 and NKG2A). These cells are virtually absent in newborns (45), whereas they constitute a significant proportion of CD3+ T cells in elderly individuals, healthy senior donors including centenarians (46).
The phenotypic analysis of the T cells that expresses NKR demonstrated that the majority of these cells are CD8+ T cells that lack the expression of CD28, a marker generally associated with naïve lymphocytes (47). The preferential expression of NKR on CD8 T cells that are CD28 -both in young and elderly individuals, may indicate that NK-like T cells likely have a role in regulating cytotoxicity and cytokine production by CD8+ T cells (42). The increased percentage of CD28-CD8+ T cells constitutes a hallmark of immunosenescence (47). Thus, the increased frequency of NK-like T cells in elderly individuals is likely the consequence of the increased number of CD8+CD28- T cells characteristic of aging. These cells are often considered “senescent” T cells as they have high levels of expression of mitotic inhibitors, have short telomeres, are highly resistant to apoptosis and show a decreased proliferative capacity (48,49). Moreover, loss of CD28 expression in CD8+ T cells during aging is accompanied by altered expressions of co-stimulatory and NK cell receptors. Importantly, IL-15 has been shown to contribute to the generation and accumulation of CD28-CD8+ T cells (16,50–52). Overall, these data suggest that the regulation of the expression of particular NKR on CD8+ T cells is physiologically programmed rather than a random event of the aging process (53).
Although elderly people are usually used as a model to investigate NK-like T cells, these characteristics can also be found in other clinical conditions involving chronic activation of the immune system such as viral infections, rheumatic and autoimmune diseases or tumors (42,54,55).
2.2. NK cell receptors and subsets in the context of CD8
+T cells
In order to study the generation of NK-like T cells, it is important to understand which are the NKR usually expressed by CD8+ T cells. NKR include Killer cell immunoglobulin-like receptors (KIR), C-type lectins (CD94, NKG2A/NKG2C), natural cytotoxicity receptors (NKp44, NKp30, and NKp46), CD16, NKG2D, and other receptors (56,57).
As discussed before, NK-like T cells have distinctive phenotypic characteristics that include typical NKR such as CD16, CD56, CD335 (NKp46) and CD57. Human peripheral blood NK cells are divided in two functionally distinct subsets: CD56dim and CD56bright NK cells (58–60).The majority (approx. 90%) of human blood NK cells present low-density surface expression of CD56dim, expresses high surface density of CD16 and have a low proliferative capacity. In turn, CD56bright NK cells represent a minor subset (approx. 10%) of human blood NK cells that are low or negative for CD16 expression and are capable of high proliferation (60,61). In recent years, it became clear that CD56dim NK cells can be further subdivided based on the expression of CD62L, CD57, or CD94/NKG2A (62). Additionally, there is a developmental relationship between the different subpopulations, suggesting a differentiation of mature NK cells starting from CD56bright via CD56dim (CD57
-, CD62L+, CD94/NKG2A+) to the more differentiated CD56dim (CD57+
, CD62L-, CD94/NKG2A-) (63). CD57 is of particular interest because it is considered a marker of terminal differentiation on human CD8+ T cells. Very few newborn or fetal NK cells express CD57, and the frequency of CD57-bearing NK cells increases with age. CD57+ NK cells express a repertoire of NK-cell receptors, suggestive of a more mature phenotype, and proliferate less when stimulated with target cells and/or cytokines. In addition, CD57 expression is induced on CD57-CD56dim NK cell after activation with IL-2/15 (64).
One common feature of CD8+ NK cells and CD8+ T cells is the expression of the CD8 receptor. However, there are differences regarding the chains that made up the receptor. Thus, the CD8 receptor consists of two polypeptide chains expressed either as a homodimer (CD8) or as a heterodimer (CD8) (65). While CD8+ NK cells express exclusively CD8 homodimers, CD8+ T cells leaving the thymus express only CD8heterodimers. Yet, a variable proportion of circulating CD8+ T cells expresses both CD8heterodimers and CD8 homodimers (66). In a study conducted by Werwitzke et al., CD8+ T cells were divided into three different subpopulations according to the expression of the CD8chain: CD8βhighCD28+, CD8βlowCD28+ and CD8βlowCD28- cells. Phenotypic and functional characterization of these CD8+ T cell
subsets revealed significant differences, namely that CD8βlowCD28- cells express CD16, CD56, CD94 and some KIR. This, and a similar study, suggested that CD8highCD28+ cells can differentiate into CD8lowCD28+ and CD8βlowCD28- upon TCR stimulation (67,68). Recent studies present evidences that support the notion that CD8 appear to act like other “tuning” molecules to aid survival, in a manner analogous to the expression of KIR or other NK cell associated receptors on T cells. Indeed, previous phenotyping of CD8low cells support this idea through the increased expression of CD161, CD16, CD158 and NKB1 (69). Accumulation of CD8-expressing CD27-CD28-CD57+CD8+ memory T cells would be predicted in the elderly and also in patients with autoimmune conditions (70–73).
All together, these data appears to support the existence of a close relationship between IL-15, the expression of NK receptors in CD8+ T cells and the phenotypic changes seen in CD8+ T cells regarding expression of CD8. The accumulating evidence pointing to IL-15 as a cytokine highly expressed during chronic inflammation, together with its possible role in the generation of NK-like CD8+ T cells, has led to a growing interest in studying these CD8+ T cells in health and disease.
Aims of the study
The main objective of this work was to study the effect of IL-15 on parameters of CD8+ T cell differentiation in vitro, namely expression of CD8 and NK receptors such as CD16, CD56, CD57 and CD335.
The specific aim for this work were:
- To analyze the phenotypic changes in isolated CD8+CD56- T cells after stimulation with IL-15, particularly the development of NK-like T cells
III. Materials and Methods
1. Subjects
Blood samples (i.e., phlebotomies) from hereditary hemochromatosis (HH) patients (n=7; all males; mean age 48 years; range 31-57), secondary hemochromatosis (SH) patients (n=2; mean age 67 years; both man and same age) and one polycythemia Vera (PV) patient (male; 72 years old) attending the Immunohemotherapy Service of Centro Hospitalar Cova da Beira (CHCB) were used as the biological material to obtain peripheral blood mononuclear cells (PBMC, see below). It was also intended to use blood samples from healthy donors. However, these samples were usually 2-3 days old which resulted in a significant contamination by low buoyant granulocytes, which interfered with the subsequent purification of the CD8+ T cells by magnetic beads.
HH patients were diagnosed taking into account abnormal elevate values of serum transferrin (Tf) saturation (>50% to 55% in men and >45% in women) (74), serum ferritin (>300μg/L in men and >200μg/L in women) (74,75) and the presence of the C282Y HFE mutations. SH patients also presented elevated levels of Tf saturation and serum ferritin, similarly to HH patients. However, HFE mutations were not present in these patients and the raised iron levels were associated in most of the cases with the presence of liver disorders. The diagnosis of PV was established according to the World Health Organization diagnosis criteria (76).
This study was approved by the Ethics Committee of Centro Hospitalar Cova da Beira and informed consent was obtained from all subjects following the guidelines of local institutions.
2. Reagents and Antibodies
Phytohemagglutinin (PHA, from Phaseolus vulgaris, in PHA-P form), Bovine Serum Albumin (BSA), Human Serum Albumin (HSA), Trizma Base, Ammonium Chloride and the antibiotic-antimitotic solution (PSA) were from Sigma-Aldrich (Madrid, Spain). Fetal Bovine Serum (FBS) and Inactivated Human Serum (iHS) were obtained from Biochrom (Berlin, German). RPMI-1640 medium (25mM HEPES/L-Glutamine) was from Life Technologies (Carlsbad, USA). Lymphoprep was from STEMCELL Technologies (Grenoble, France). IL-15 was from R&D
was obtained from Amresco (Solon, USA). CellTrace Carboxyfluorescein Succinimidyl Ester (CFSE) Proliferation Kit was from Molecular Probes (Amsterdam, Netherland).
All parameters were studied by flow cytometry using an Accuri C6 flow cytometer (Becton & Dickinson, USA). The characteristics of the antibodies used in this study are listed in Table 2.
Table 2. Mouse anti-human fluorochrome-conjugated monoclonal antibodies used
Antigen Clone Isotype Conjugate Company Dilution
CD3 UCHT-1 IgG1 APC BD 2:5
CD3 UCHT-1 IgG1 APC Immunotools 1:10
CD8 SK1 IgG1 PerCP BD Biosciences 2:5
CD8- 2ST8.5H7 IgG2a PE Novus Biologicals 1:25
CD16 B73.1 IgG1 PE eBioscience 1:10
CD56 B-A19 IgG1 PE Immunotools 1:10
CD57 TB01 IgM PE eBioscience 1:10
CD335 (NKp46) 9E2 IgG1 PE Biolegend 1:10
3. Isolation of Peripheral Blood Mononuclear Cells
As already mentioned, patients phlebotomies were used to isolate PBMC (Figure 4). Briefly, blood from the phlebotomies bags was distributed into 50 ml conical tubes and centrifuged at 2200xg (approx. 3400rpm) for 15 minutes. Then, the interphase containing leucocytes was harvested with a sterile Pasteur pipette together with some plasma and red blood cells (RBC), pooled and designated as buffy-coats (BC). The resultant BC was carefully layered over an equal volume of Lymphoprep and centrifuged at 1100g (approx. 2200rpm) for 30 minutes. Then, the interphase containing PBMC was collected carefully with a sterile plastic pipette and transferred to a new tube, diluted with Phosphate Buffered Saline solution (PBS) and then centrifuged at 700xg (approx. 1800rpm) for 10 minutes. PBMC were washed twice with PBS followed by new centrifugation at 500xg (approx. 1500rpm) for 10 minutes. Contaminating RBC present in the PBMC preparations were lysed in pre-heated (approx. 37ºC) RBC lysis solution (10 mM Trizma Base, 150mM Ammonium Chloride, pH 7.2) and then centrifuged at 500xg for 10 minutes. PBMC were washed with PBS solution again, centrifuge at 500xg and then counted in Trypan Blue Solution (0,1%).
Figure 4. PBMC Isolation from phlebotomy bags. A whole blood sample was taken from patients in
Centro Hospitalar Cova da Beira (Covilhã). The sample had approximately 400ml, and it was divided into 8 tubes of 50ml with 40ml each and then centrifuged at 2200xg, 15 minutes. The resultant BC rings were transferred to other 50ml tubes and then centrifuged over Lymphoprep (two 50ml tubes, with 20ml Lymphoprep and 20ml of sample each). After centrifugation at 1100xg during 30min, PBMC were collected and used for CD8+ T cell purification.
Prior to CD8+ T cell purification, 50x106 PBMC in a final volume of 10ml of complete medium (RPMI/5% FBS/1% PSA) were plated on Petri dishes and incubated for an hour at 37ºC, 5% CO2 to remove adherent cells (i.e., monocytes and B cells). After that, the Petri dish was carefully agitated and the supernatant enriched for non-adherent peripheral blood lymphocytes (PBL), mainly T cells, was recovered. PBL were washed with PBS, by centrifugation at 300xg (approx. 1300rpm) for 10 minutes and counted.
4. Magnetic CD8
+Cell Purification
After PBL enrichment, purified T CD8+ were obtained by Magnetic Cell Purification with the CD8+ T cell isolation Kit (Human) from Miltenyi Biotec as previously described (39). This kit has been developed to isolate untouched CD8+ T cells. Non-CD8+ cells, i.e., CD4+ T cells, monocytes, neutrophils, eosinophils, B cells, stem cells, dendritic cells, NK cells, granulocytes, and T cells are labeled by using a cocktail of biotin-conjugated antibodies. The cocktail contains biotin-conjugated monoclonal anti-human antibodies against CD4, CD15, CD16, CD19, CD34, CD36, CD56, CD123, TCR , and CD235a. A second cocktail (CD8+ T cell MicroBead Cocktail) containing Microbeads conjugated to monoclonal anti-CD14, anti-CD61 and anti-biotin antibodies was used and non-target cells are magnetically labeled. Isolation of highly pure CD8+CD56- T cells was achieved by depletion of magnetically labeled cells using MACS columns and the MACS separator (adapted from manufacturers web page).
4.1 Magnetic Labeling
The magnetic labeling step was done following manufacturer instructions. Briefly, approx. 100x106 PBL were centrifuged at 300xg (aprox. 1300rpm) during 5 minutes. Then, the supernatant was completely aspirated and the cell pellet resuspended in 400μL of Wash Buffer (WB) (PBS, 0.5% BSA, 2mM EDTA, pH 7.2) and 50μL of CD8+ T Cell Biotin-Antibody Cocktail added. The tube was well mixed and incubated for 5 minutes in the refrigerator (2-8ºC). After that, 300μL of WB and 100μL of CD8+ T Cell MicroBead Cocktail was added to the mix and incubated for 10 minutes at 4ºC with two-to-three shakes. After completion of this step, labeled cells were ready for magnetic separation. Depending on the PBL isolated, the volumes referred above were adjusted accordingly. For magnetic separation, a minimum of 500μL was required. Whenever necessary, WB was add to the mix to reach this volume.
4.2 Magnetic Separation using LS columns
After magnetic labeling, the mix was separated using LS columns. The columns were placed in the magnetic field of a magnetic-activated cell sorter (MACS) separator (MidiMACS). The column was prepared by rinsing with 3mL of WB. The magnetic labeled cell suspension was applied onto the column (e.g. 100x106, 850μL) and the unlabeled cells that passed through were collected. The column was washed with 3mL of WB, and the unlabeled cells were collected in the same tube, representing the enriched CD8+ T Cells.
5. CFSE Labeling
After CD8+ T cell isolation, cells were counted and washed in PBS to proceed for CFSE-DA labeling. CFSE-DA passively diffuses into cells. It is colorless and nonfluorescent until the acetate groups are cleaved by intracellular esterases to yield highly fluorescent carboxyfluorescein succinimidyl ester (CFSE). The succinimidyl ester group reacts with intracellular amines, forming fluorescent conjugates that are well retained. Excess unconjugated reagent and by-products passively diffuse to the extracellular medium, where they can be washed away. The dye–protein adducts that form in labeled cells are retained by the cells throughout development and meiosis, and can be used for in vivo tracing. The label is inherited by daughter cells after either cell division or cell fusion, and is not transferred to adjacent cells in a population (77).
For CFSE labeling, 10x106 cells were resuspended in 1ml of PBS and incubated in the dark with 5μM of CFSE for 10 minutes at 37ºC, with one mixing after 5 minutes. After labeling, cells were washed twice with PBS/20% FBS and resuspended in culture media.
6. Cell Culture Conditions
Due to the fact that CFSE-DA labeling results in a loss of 10-20% of the initial cells, after labeling, CD8+ T cells were centrifuged and resuspended in 8mL of medium (RPMI 1640/5%HSi 1%PSA). Then, CD8+ T cells were plated in 24-well plates (approx. 1x10⁶ cells per well in a final volume of 1mL) and culture for 12 days at 37ºC, 5% CO2 and 95% humidity in the presence of 10ng of IL-15 (Figure 5). An additional amount of IL-15 (10ng) in fresh medium was added to the cultures on day 6. At day 12, cells were harvested, centrifuged and analyzed by flow cytometry.
Figure 5. Representative scheme of culture plates. In a 24-well plate, 8 wells were stimulated with
10ng of IL-15 at day 0 and then at day 6. After 12 days, cells were all centrifuged and analyzed by Flow Cytometry.
7. Flow Cytometry Analysis
Flow cytometry was used to analyze the phenotype and purity of the isolated CD8+ T cells prior to the culture. After the 12-day culture, CD8+ T cells were labeled with the antibodies listed in Table 2. In some experiments PBMC and PBL preparations were also analyzed.
The antibody labeling procedure was always identical. Briefly, approximately 0.5x10⁶ CD8+ T cells were plated on a 96-round bottom well plates. The final volume was adjusted to 150μL with staining solution (PBS/0.2% BSA/0.1% NaN3) and cells centrifuged at 350xg (approx. 1100rpm) for 2 minutes. Cells were resuspended in staining solution and centrifuged again. The supernatant was discarded and the antibodies added (antibodies and staining solution accounted 50μL). Cells were incubated for 30 minutes in the dark (on ice). Due to financial restrictions, cells incubated with 50μL of staining solution only (no antibody added) were used
IL
-1
5
(
1
0
ng)
labeling, cells were washed twice with staining solution and once with PBS. After that, cells were transferred to FACS (Florescence Activated Cell Sorter) tubes at a final volume of 500μL. Then, cells were acquired in a BD Accuri C6 (BD Biosciences, New Jersey, USA). For each sample, and whenever possible, 10000 events (10000 viable cells) were acquired and analyzed by using the FlowJo v10 (Oregon, USA).
8. Statistical Analysis
Statistical analysis was performed using GraphPad Prism 6 (San Diego, USA). Student T-test (for paired samples) was used to determine the significance of the difference between day 0 and day 12 means. Statistical significance was determined as P<0.05.
IV. Results
1. Isolation of CD8
+T cells from PBMC samples
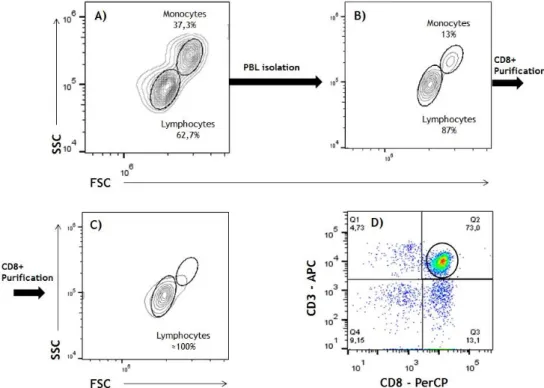
As described in Chapter II, after the isolation of PBMC, cells were counted and plated on Petri Dishes. After no less than an hour of incubation as described before, non-adherent cells, mostly PBL were recovered. PBMC obtained from phlebotomy samples had very few contaminating granulocytes and this step was mostly required to increase the purity of lymphocytes and decrease the number of monocytes and B cells. PBL preparations were then used for to CD8+ T cell purification using magnetic beads separation. The main propose of this step was specifically to obtain CD8+ T cells for our experiments. Then, we labeled these lymphocytes with antibodies against the CD3 and CD8 receptors to assess the purity. A representative experiment illustrating all these steps is shown in Figure 6. In this particular experiment, it can be seen that the adherent step raised the lymphocyte:monocyte ratio from 1,7 to 4,8 (compare Fig. 6A and 6B).
Figure 6. Schematic representation of the isolation of CD8+ T cells from a representative PBMC
sample. (A) Dot-plot showing lymphocyte and monocytes, according to FSC/SSC characteristics, after
PBMC isolation. (B) Dot-plot showing lymphocyte and monocytes, according to FSC/SSC characteristics, after the adherent step. (C) Dot-plot showing lymphocyte and monocytes, according to FSC/SSC characteristics, after magnetic beads purification. (D) Dot-plot showing CD3 versus CD8 expression in the lymphocyte preparation shown in Figure 6C. All markers under investigation were analyzed in the CD3+CD8+ gate (circle) shown in Fig. 6D.
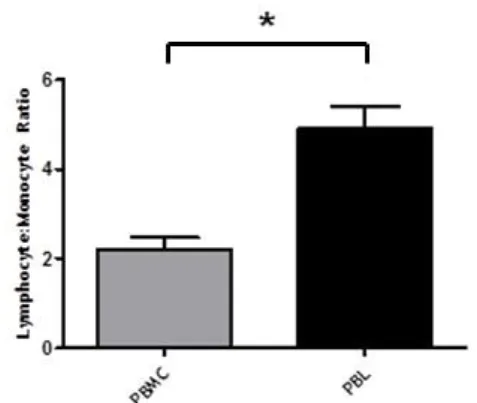
Overall, the adherent step significantly improved lymphocyte recovery by increasing, on average, the lymphocyte:monocyte ratio by 2.5-fold, as illustrated in Figure 7. Unfortunately, and even though that lymphocytes were the predominant, if not the only population observed, after CD3+CD8+ magnetic separation, according to FSC/SSC characteristics (see Figure 6C), the efficiency of CD3+CD8+ T cell purification after magnetic isolation was not very high (see Figure 6D). As summarized in Table 3, the purity of the CD3+CD8+ T cells obtained after the whole procedure ranged between 30 and 80% (Table 3).
Figure 7. Lymphocyte:Monocyte ratio among all samples studied. The graph shows the comparison
between the Lymphocyte:Monocyte ratio (mean±SEM) in PBMC and PBL samples (n=10). P value is shown (*p<0.05), paired samples student T-test.
Of note, contaminating CD3+CD4+cells, CD3-CD8- cells (possibly B cells) and CD3-CD8+ cells (most likely NK cells), were observed in most experiments, being the latter the most predominant contaminating population. Rather than being a problem, this contamination turned out to be an advantage because it allowed us to have a positive control for the NK cell markers under study. In order to avoid any bias in the results from the contaminating cells, all data regarding expression of the receptors under study was exclusively analyzed in CD3+CD8+ T cells.
Table 3. CD3+CD8+ T cell percentage for each experiment at day 0. After magnetic CD8+ purification
cells and within the lymphocyte region, CD3+CD8+ yield was calculated and the table below shows the
percentage for all experiments.
Experiment 01 02 03 04 05 06 07 08 09 10
CD3+CD8+
2. Proliferation of CD8
+T cell preparations after long-term
culture with IL-15
Several groups have previously shown that IL-15 is mitogenic for CD8+ T cells. In accord with these data, the 12-day culture conditions used in our study (IL-15 added at day 0 and day 6) allowed lymphocytes to grow and proliferate. As illustrated in Figure 8, a population of lymphocytes with a clear increase in the size and complexity (lymphoblasts) was observed after the 12-day culture period akin to a population with a decreased size, as determined by FCS/SSC characteristics (compare Figure 8A and 8B).
Figure 8. Effect of IL-15 on lymphocyte growth. Representative flow cytometry data of lymphocytes
before (day 0, left dot-plot) and after (day 12, right dot-plot) 12-day culture with IL-15.
To ensure that the lymphoblast cells obtained after the 12-day culture period were live cells, we labeled some samples with propidium iodide (PI), a vital cell marker. As shown in Figure 9, lymphoblast cells were PI negative, therefore live cells (right gate) while the lymphocytes with a reduced size were largely positive for PI, therefore dead cells (left gate). The IL-15-induced blast transformation was consistently observed in all experiments (see Figure 10).
Figure 9. Effect of IL-15 on lymphocyte viability. PBMC were stimulated with 10ng/ml of IL-15 as
indicated in material & Methods. At day 12, cells were harvested, stained with Propidium iodide and collected in a FACSCalibur according to FSC/SSC characteristics (left dot-plot). Right histogram show PI fluorescence in the two regions indicated in the left dot-plot.
Figure 10. Percentage of live lymphoblasts and dead lymphocytes after 12-day culture with IL-15.
The graph shows the percentage (mean±SEM) of live dead and blast lymphocytes at day 0 and at day 12 after IL-15 stimulus (n=10). P values are shown (*P<0.05).
When T cell proliferation in the lymphoblast region was examined, IL-15 was seen to induce lymphocyte proliferation, as determined by a decrease in CFSE fluorescence (Figure 10). Importantly, both small and blast cells showed a halving in CFSE fluorescence (see Figure 10B).
Figure 11. IL-15 induced lymphocyte proliferation. PBMC were labeled with CFSE and stimulated with
10ng/ml of IL-15 as indicated in material & Methods. At day 12, cells were harvested, collected in a FACSCalibur and CFSE fluorescene determined in the lymphocyte gate. Left histograms shows CFSE-fluorescence at days 0 and 12. Right histograms shows CFSE-CFSE-fluorescence in lymphoblasts (thick line)) and small cells (dashed line), as indicated in Figure 8B.
Blasts Small cells
CFSE
A)
B)
Day 12 Day 03. Phenotypic changes in CD8
+T cells after long-term culture
with IL-15
Next, we wanted to ascertain whether IL-15 could influence expression of markers associated with differentiation of CD8+ T cells, namely CD16, CD56, CD57, NKp46 (CD335) and CD8, in order to assess the possibility that this cytokine is involved in the generation of NK-like CD8+ T cells.
For the phenotypic studies, an electronic gate was created on the live lymphocyte gate shown in figure 8B, including both small and blast cells. Then, expression of all the receptors under study was done after gating on CD3+CD8+ T cells, both at day 0 and after the 12-day culture period in the presence of IL-15 (see Figure 12).
Figure 12. Schematic representation of the analysis of NK markers and CD8 in IL-15-stimulated
lymphocytes. CFSE-labeled lymphocytes isolated at day 0 (upper dot-plot) and after 12-day culture with
IL-15 (lower dot-plot) were stained with CD3-APC, CD8-PerCP and either CD8-PE, CD16-PE, CD56-PE, CD57-PE and CD335-PE mouse anti-human monoclonal antibodies, and acquired in a FACSCalibur as indicated in Material & Methods. Then, electronic gates were created around CD3+CD8+ T lymphocytes
Gate in CD3-CD8+ (POSITIVE CONTROL) CFSE x CD16 CFSE x CD56 CFSE x CD335 Gate in CD3+CD8+ CFSE x CD16 CFSE x CD56 CFSE x CD335 CFSE x CD57 CFSE x CD8 Gate in CD3-CD8+ (POSITIVE CONTROL) CFSE x CD16 CFSE x CD56 CFSE x CD335 Gate in CD3+CD8+ CFSE x CD16 CFSE x CD56 CFSE x CD335 CFSE x CD57 CFSE x CD8
Most interestingly, the percentage of CD3+CD8+ T cells diminished from day 0 (start of the culture) to day 12 (end of the culture) and this was observed in the majority of experiments. The reduction in CD3+CD8+ T cells at day 12 was accompanied by an increase in CD3-CD8+ cells, most likely NK cells, perhaps because the residual NK cells at day 0 proliferated more than CD8+ T cells in the presence of IL-15 (see discussion).
Then, we analyzed the expression receptors described in Figure 12 on the CD3+CD8+ gate in combination with CFSE fluorescence. This was possible due to four different fluorochormes: CFSE, PE/FL2 (CD8, CD16, CD56, CD57, CD335), PerCP/FL3 (CD8) and APC/FL4 (CD3). As shown in Figure 13, there were some NK markers whose expression by CD3+CD8+ T cells was very low or even not detected at day 0 (e.g., CD16, CD56 and NKp46). CD56, but not CD16 or NKp46/CD335 expression increased when the CD3+CD8+ T cells entered cell division. In contrast, the CD57 marker was already expressed at high levels at day 0 in the majority of the samples and this expression also increased with cell division. As for the CD8 marker, we observed a small but significant decrease in expression after the 12-day culture with IL-15 (Figure 13).
The absence of expression of CD16, CD56 or NKp46 by CD3+CD8+ T cells was not an artifact or a defect of the antibodies used because analysis of these receptors on the CD3-CD8+ gate (NK cells, see figure 12) revealed normal levels of expression (Figure 15).
CFSE
CFSE
CFSE
CFSE
Figure 13. Effect of IL-15 on the expression of CD8, CD16, CD56, CD57 and CD335 by CD8+ T cells.
Dot-plots show expression of the different markers under study in CFSE-labeled CD3+CD8+ T cells before
(left dot-plots) and after 12-day culture with IL-15 (right dot-plot) after gating in CD3+CD8+ T cells as
indicated in the legend of Figure 12. (A) CFSE vs CD16. (B) CFSE vs CD56. (C) CFSE vs CD335. (D) CFSE vs CD57. (E) CFSE vs CD8.
Table 4 shows a summary of the differences in the expression of the different receptors studied between days 0 and 12. Analysis of the data allowed us to conclude statistically significant differences in the expression of CD56, CD57 and CD8.
Table 4. Percentage of cells regarding NK and naïve markers at day 0 and at day 12 within CD3+CD8+
cells.
Markers Day 0 (n=10) Day 12 (n=10) P value
CD16+ 2.50±0.62 4.16±0.77 NS
CD56+ 1.26±0.36 23.04±5.89 <0.05
CD335+ 1.74±0.53 1.68±0.27 NS
CD57+ 42.36±7.61 53.68±7.38 <0.05
CD8 97.67±0.81 88.80±2.40 <0.05
*Values represent the mean±SEM. Differences between day 0 and day 12 (paired samples Student T-test) are indicated. n, number of subjects, NS, not significant.
Comparing the expression of the NK receptors as well as of CD8between small or blast CD3+CD8+ T cells allowed us to conclude that there were no significant differences (Table 5).
Table 5. Percentage of NK and naïve markers in small cells and blasts at day 12.
Markers Small Cells Blasts
CD16+ 4.89±1.23 3.81±0.54
CD56+ 21.01±5.71 25.63±5.86
CD335+ 1.43±0.38 2.13±0.24
CD57+ 52.65±11.18 54.72±7.98
CD8β+ 83.71±1.30 91.45±2.38
*Values represent the mean±SEM. n, number of subjects. All not significant for P≥0.05 (paired samples student T-test)
As mentioned before, it was important to assure that low expression of some receptors (e.g. CD16, CD56 and NKp46/CD335) was not due to a defect of the antibodies or some artifact (Figure 14). For that reason, expression of these receptors was analyzed within CD3-CD8+ cells region. Analysis was made for day 0 and day 12 once again.
CFSE
CFSE
Figure 14. Effect of IL-15 on the expression of CD8, CD16, CD56, CD57 and CD335 by NK cells.
Dot-plots show expression of the different markers under study in CFSE-labeled CD3-CD8+ cells before (left
dot-plots) and after 12-day culture with IL-15 (right dot-plot), as indicated in the legend of Figure 12.
(A) CFSE vs CD16. (B) CFSE vs CD56. (C) CFSE vs CD57.