Sustainability of the Chinese nuclear expansion: The role of ADS to
close the nuclear fuel cycle
F. Fiori
*, Z. Zhou
INET, Tsinghua University, Beijing 100084, China
a r t i c l e
i n f o
Article history:Received 3 December 2014 Received in revised form 3 March 2015
Accepted 10 March 2015 Available online 2 April 2015
Keywords:
China nuclear fuel cycle ADS
Nuclear energy policy Nuclear energy sustainability
a b s t r a c t
The civil nuclear energy deployment in China is important for future“Nuclear Renaissance”of China and worldwide. Compared to the other nations that developed their nuclear power energy system in last century, China can take advantage of the research and mistakes made by those states with regards to the back-end of the nuclear fuel cycle (NFC). The spent fuel accumulated by decades of operations of civil nuclear power is today a big burden for the nuclear industry. China must carefully plan the NFC for a sustainable development of the nuclear energy with special consideration to closing the fuel cycle. The present paper addresses the NFC option and implication of a LWR reactors scenario development and of a fast reactor park developed after 2035 and 2050, and covers the historical development of nuclear energy in China (i.e. from thefirst criticality of thefirst reactor) to the year 2100. The paper studies the partition and transmutation strategy with the use of accelerator driven system (ADS) to burn the MA to under-stand the ADS impact on the NFC and to estimate the number and the necessary deploying schedule of the ADS reactors to limit the minor actinides stock build up. The code INFCIS developed by the Inter-national Atomic Energy Agency (IAEA) is used in the present study.
©2015 Elsevier Ltd. All rights reserved.
1. Introduction
The rapid development of China and the consequent shortage of energy need to be answered in a sustainable way in order to reduce the environmental impact of human activities. In this respect, traditional energy sources such as coal and oil pose a heavy burden on the quality of life of the population due to the detrimental environmental effects that the wastes arising from the burning of fossil fuel have i.e. global warning, air pollution, burden of trans-portation etc (Zhou, 2010)…. To make nuclear energy environ-mentally friendly and sustainable, it is necessary to close the fuel cycle. A more rational solution than the once-through fuel cycle should be found. In this respect, China is committed to partitioning and transmuting the spent fuel and to developing a nuclear park with a regional center of transmutation of HLW. The present study focuses the attention on the nuclear power development scenario until the year 2100, taking into account the nuclear power plant operation since the beginning of Chinese civilian use of nuclear
energy. Three main strategies are analyzed (Section4) namely the MOX-TRU strategy (OECD/NEA, 2006) and the ADS-MA (OECD/NEA, 2006) with gradual switch to FRs in 2035 and 2050. For all the three NFC options, the effect of PU recycling as MOX fuel in LWRs has been evaluated. This studyfirst highlights the necessity for China to find a solution to close the nuclear fuel cycle, showing that a once-through option will pose a huge burden on the final geological repository. The LWR scenario development option with recycle of Pu in the form of MOX and the transmutation of MA in dedicated ADS system in case of low, medium and high speed development of nuclear energy in China has been studied and it is considered as the reference scenario. The gradual switch to fast reactor technology in 2035 and 2050 has been studied with thefixed target of 400 GWe installed by 2050 and the results have been compared with the LWR reference scenario. In all the three cases, the reprocessing capacity up to 2035 isfixed to the most updated available literature prediction (Zhou, 2011; Chen et al., 2012). Thereafter, it is increased to answer the increase of material that needs to be reprocessed, thus assuming that China has enough manufacturing capabilities in thefield to cope with the needs. In the present study the main focus is the stock reduction of the MA and of the SF, while the consid-eration of Pu accumulation, natural resources utilization are dis-cussed in a separated paper (Fiori and Zhou). The results of this *Corresponding author. Energy Science Building B207, Tsinghua University,
Beijing 100084, China. Tel.:þ86 1369 1145 937. E-mail address:filippofi[email protected](F. Fiori).
Contents lists available atScienceDirect
Progress in Nuclear Energy
j o u r n a l h o m e p a g e : w w w . e l s e v i e r . c o m / l o c a t e / p n u c e n e
study give a clear indication of the overall material flow for the three scenarios studied. The main achievement is the estimation of the number of ADS and the time of commercial operation of each new ADS necessary to control the MA stock buildup.
2. IAEA nuclear fuel cycle simulation system
2.1. Background
The IAEA in 1980 began the development of the Nuclear Fuel Cycle Information System (NFCIS) as an international database of civil nuclear facilities around the world. Nowadays the database has been computerized and is accessible via its website since 2001. It comprises data from 650 civil nuclear facilities in 53 countries
(IAEA, 2009). A simulation system, named NFCSS (formerly known
as VISTA), was developed in 1996. It was then intensively used to quantify the different scenariosfixed by the IAEA working groups. The INSCIS from this preliminary version with new options and capabilities thereafter was developed. The code homepage (IAEA, 2009) nowadays states:“With its capacity to estimate future fuel cycle material and service requirements NFCSS can be utilized as a tool for Innovative Nuclear Reactors and Fuel Cycles (INPRO). It has already been announced to INPRO participants in several technical meetings”.
2.2. INFCIS code
Nuclear Fuel Cycle can be defined as a set of processes to make use of nuclear materials and to return it to a normal state. It starts with the mining of unused nuclear materials from nature and ends with the safe disposal of used nuclear material to nature. To produce energy from uranium in a nuclear reactor, it must pass through a series of different processes. The complete set of pro-cesses to make nuclear fuel from uranium ore is known as front end of the nuclear fuel cycle. The processes in the front end of the nuclear cycle are mining and milling, conversion, enrichment and fuel fabrication. After producing energy in the reactor, nuclear fuel becomes spent fuel. Spent fuel also has to be processed in a storage facility or in a reprocessing facility if it is being recycled. Temporary storage, reprocessing, long-term storage, or final
storage of spent fuel are called the back end of the nuclear fuel cycle.
The INFCIS is a code capable of calculating NFC requirements for all types of reactors by year over a long period (IAEA-INFCIS, 2011). The range of calculation is valid from a single reactor to the entire world's reactor park. The code can cover the entire fuel cycle, from the front end: natural uranium requirement, conversion and enrichment, to the back end: reprocessing of the primary and second coolant if any (i.e. MOX fuel), spent fuel disposal, ILW and HLW production. Furthermore, quantities and qualities of the unloaded fuels can be evaluated allowing the user to apply the desired recycling strategy. The code is simplified (i.e. less input data requirement) and the calculation speed is quick enough to enable making comparisons among various fuel cycle strategies. Historical data are obtained mainly from the Agency database PRISM. Fresh fuel requirements and spent fuel isotopic composition can be input by the user or automatically calculated from a set of internal pa-rameters that have been selected by experts and introduced in the program. The user may then choose to use spent fuel stockpiles to develop a recycling strategy. The estimation of accumulation of actinides including minor actinides is one of the capabilities of the simulation. Those accumulation estimations might be used to compare any future fuel cycle options for transmutation of minor actinides. A schematization of the NFCSS code input and output parameters can be found inFig. 1.
Abbreviations
ADS Accelerator Driven System
ADS-MA Double Strata fuel cycle
BR Breeding Ratio
CAS Chinese Academy of Science
CCFR Chinese Commercial Fast Reactor
CDFBR Chinese Demonstration Fast Breeder Reactor CEFR Chinese Experimental Fast Reactor
CLEAR Chinese LEAd Reactor
CIEA Chinese Institute of Atomic Energy CNNC China Nuclear national Corporation CNPE China Nuclear Power Engineering
FBR Fast Breeder Reactor
FP Fission Product
HLW High Level Waste
HM Heavy Metal
HTR High Temperature Reactor
HTGR High Temperature Gas cooled Reactor
ILW Intermediate Level Waste
INET Institute of Nuclear and New Energy Technology INFCIS Integral Nuclear Fuel Cycle Information System INPRO Innovative Nuclear Reactors and Fuel Cycles
LBE Lead Bismuth Eutectic
MA Minor Actinide
MOX Mixed OXide Fuel
MOX-TRU MOX recyclingeTRU burning fuel cycle
NDRC National Development and Reform Commission
NFC Nuclear Fuel Cycle
NFCIS Nuclear Fuel Cycle Information System NFCSS Nuclear Fuel Cycle Simulation System
NPP Nuclear Power Plant
OT-NFC Once Through Nuclear Fuel Cycle P&T Partition and Transmutation
SF Spent Fuel
SNTPC State Nuclear Power Corporation
SoA State of The Art
SWU Separative Working Unit
TOTe TOTal electricity produced
TRU TRansUranic elements
3. Nuclear power strategy and long term perspective
3.1. Status of the nuclear power
The beginning of the nuclear power development in China started for military purposes during the 60s of last century. Under the military umbrella, China developed a comprehensive technol-ogy in thefield of nuclear energy. The civil nuclear power devel-opment started only many years later, at the end of 1970s, and the first reactor came online only in 1994 (Qinshan phase 1 NPP), a historical phase defined as“The Slow Transition”by Y. Zhou (Zhou
et al., 2011). In 2004, China has an installed capacity of 9.1 GWe
(WNA, 2013) producing 2.3% of the nation's electricity generation
(NSBC). It was only at the beginning of this century that China strongly committed to the development of civil nuclear power. In 2006, China's State Council approved the National Development and Reform Commission (NDRC)'s“Medium- and Long-term nuclear Power Development Plan (2005e2020)”that called for an installed capacity of 40 GWe in 2020. A 2007 State Council Information Office White Paper,“China's Energy Conditions and Policies”, increased the target for the installed capacity to 60 GWe (Zhou et al., 2011). As of June 2014 mainland China has 20 nuclear power reactors in oper-ation, 28 under construction, and more that are about to start construction (WNA, 2013). As a consequence of the Fukushima accident the construction of inland NPPs has been halted by the government with a decision pending in 2015. In the case that the inland construction of nuclear power plants is allowed there will be a boost in the installed capacity that could reach 70-80 GWe by 2020. Predictions for the medium-long term future called for an installed capacity of 250 GWe in 2035 and 400 GWe in 2050. Before 2050 the Chinese reactorfleet will be mostly of LWRs of the size from 1.0 GWe to 1.6 GWe. In addition to the domestic CPR-1000, ACP-1000 developed by CGNPC (China General Nuclear Power Co.) and CNNC (China National Nuclear National Corporation) based on the AREVA M310 reactor, there will be the construction of AP1000 from Westinghouse and EPR from AREVA and VVER reactor of Russian design. Among the indigenous design, the CAP1400 developed by SNTPC in cooperation with Westinghouse, on the basis of the AP1000 reactor has been predicted to be a potential favorable future. The Chinese nuclearfleet includes an in-house design prototype High Temperature Gas cooled Reactor built in 2003 designed by INET of Tsinghua University, and in 2012 the construction of a demonstration HTR reactor of 210 MWe started and it will reach criticality in 2019. In the fast reactor sector, China is committed to developing its own design, the CDFR, which is slated to become critical in 2025 with an installed power of 1000 MWe. A CDFBR with 1200MWe and breeding ratio 1.2 is projected for 2028, followed by the commercial fast reactor version called CCFR, with an installed power of 1000 MWe and metal fuel, to become critical in 2030. The first milestone in the fast reactor field has been reached with the criticality of the Chinese Experimental Fast Reactor (CEFR) of 25 MWe in operation at the Chinese Institute of Atomic Energy (CIEA) (Xu, 2008). In addition to the above, two BN-800 Russian reactors are planned for construction at Sanmin site of Fujian Province. These reactors are referred to by CIAE as Chinese Demonstration Fast Reactors (CDFRs), with construction originally to start in 2013 and commissioning 2018e19. However, the con-struction is delayed as the agreement on thefinal price has not been reached so far (Wang, 2009).
3.2. Future development of nuclear power and nuclear fuel cycle
The back end of the nuclear fuel cycle is still an open topic in many countries in the world. The astonishing growth of nuclear power capacity in China calls for rational thinking tofind a solution
on how to close the nuclear fuel cycle as early as possible in order to avoid an accumulation of large amounts of spent fuel for reproc-essing. Different studies have recently been published on the topic
(Zhou, 2011; Wang, 2009; Zhou and Zhang, 2010). Although every
study called for the reprocessing SF, a common direction on which way to pursue the management of the Minor Actinide (MA) and Fission Product (FP) has not been identified. The report of the Chinese Academy of Engineering (CAE, 2011) says“
…
Nuclear fuelcycle technology roadmap and policies describes the year 2025 as the timing to begin the transition from open to closed fuel cycle. In year 2035 begin the shift to fast breeder fuel cycle, in order to pro-gressively reinforce the proliferation resistance and increase the sustainability supply of nuclear fuel, high-level radioactive waste separation e transmutation, will be deployed to achieve an ecological and sustainable development…”. From the above state-ment, the commitment of the Chinese industry to close the fuel cycle by adopting a Partition and Transmutation (P&T) strategy is clear. However, the means to do so are still under investigation. Recently, China has committed to the development of the Accel-erator Driving System reactor as a means to burn the MA before geological disposal of the waste (Bai, 2011). A research ADS facility called CLEAR-I (Chinese LEAd Reactor) is planned to be built in 2017 with a power of 10 MWth, to be followed by CLEAR-II as an experimental facility with a power of 100 MWth in 2020 and subsequently, CLEAR-III as a demo facility with a power of 1000 MWth (Wu, 2013). The reprocessing of the spent fuel is a necessary step before any kind of recycling of the fuel in any form or the transmutation of the FP and MA. China currently lacks a comprehensive reprocessing and recycling infrastructure. Thefirst reprocessing plant of about 50e80 tHM/year capacity has been commissioned in 2009 and started operation in 2010. As proposed
in (Chen et al., 2012), a commercial reprocessing facility of
800 tHM/year plus an advanced demonstration plant of the ca-pacity of 400 tHM/year could start operation in 2025 followed by a pilot reprocessing plant for FBR spent fuel and a second large reprocessing plant around 2035. The Pu can be store to be used in the futurefleet of FBR or can be recycled as MOX in LWR. It is suggested in (Chen et al., 2012) to burn the MA in the future fast reactor, but the use of dedicated burner such as the ADS reactor is another valuable option for their flexibility on core composition and inherent safety. Moreover, as long as the supply of uranium fuel for LWR is economical, the transition to a fast reactor nuclear park is not as urgent as the need to burn the MA. In the present study, the Pu recovered from the LWR spent fuel reprocessing is recycled in the new generation of LWR under construction and of future con-struction (seeFig. 8). For the simulation of the FR transition in 2035 and 2050 both the option of MOX recycling in the availablefleet of LWR and of storage of the excess Pu for future need are investigated (see Section4).
3.3. Nuclear fuel cycle for the future
3.3.1. The once-through option for the LWR development scenario
Thefirst objective of the present study is to assess the amount of MA, Pu and fission product that will be accumulated under the foreseen nuclear energy development and reprocessing capacity installed discussed respectively in Section3.1and Section3.2. The second and more important objective is to study a possible way to reduce the Pu stock and MA stock in order to reduce the non-proliferation risk, increase the fuel utilization in LWR and to reduce the HLW burden on future generations. For the LWR reactor development scenario, three schemes have been considered ac-cording to the development plan discussed in Section3, amedium
capacity. Thelowdevelopment scenario is a conservative approach. Considerations such as cash shortage, public opposition and a new financial crisis such the one of 2008 can hamper the ability to foster the medium scenario foreseen above. As a consequence of the Fukushima accident, the central government halted the construc-tion of the inland reactors with a new decision is expected in 2015. In the probable case that the government and the licensing au-thority allow the construction of the proposed inland reactors, the installed capacity will speed up compared to themediumscenario. For this reason, ahighdevelopment scenario is also taken into ac-count.Fig. 2shows the installed electric capacity as a function of time in the three scenarios considered andFig. 3the Spent Fuel accumulation (SF) under the hypothesis that a once-through fuel cycle will be used until a future decision is made. Considering the gargantuan amount of SF produced even under the low case sce-nario, it is clear that there is a need for a solution for the back-end fuel cycle. Storing the SF at the reactor site (i.e. the approach adopted in the USA until now) is a not feasible option due to the costs (construction and maintenance of the temporary storage pools) and risk associated (i.e. terrorist attack as well as natural disasters). The natural uranium needed for the foreseen develop-ment is shown inFig. 4, and the consideration on the sustainability and the capability of China to supply this huge quantity of fuel will be discussed in a separate paper (Fiori and Zhou).
4. Three scenario studied
4.1. The three scenarios
Three fuel cycles have been studied in the present paper. The main objective is to assess the impact that the three more probable scenarios for the future development of the nuclear energy in China will have on the overall fuel cycle. Thefirst scenario is the called
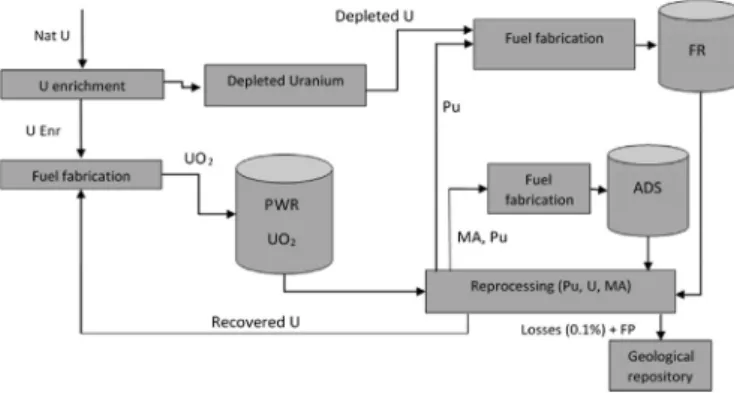
“MOX recyclingeTRU burning”(OECD/NEA, 2002), in the following indicated as MOX-TRU. With reference to the scheme inFig. 5, it can be seen that after the fuel that is discharged from the LWR is reprocessed one time, then the stream of Pu, U and MA are sepa-rated from the FP that are sent to the waste treatment plant. Part of the Pu and the U are burned in LWRs as MOX fuel, and the MA and part of the Pu are burned in dedicated ADS reactors. The fuel dis-charged from the ADS is then reprocessed and the FP are treated as HLW. In the present calculation, the recycling of the reprocessed fuel in LWRs is limited to one time so as to not degrade the core neutron economy property with the accumulation of U and Pu
minor isotopes. The second and third scenarios, identified as
“Double Strata” in (OECD/NEA, 2002) and identified in the following as ADS-MA, differ only in the recycling of Pu as a MOX fuel in LWR (one time) in the latter. The scheme for the two sce-narios is shown respectively inFig. 6andFig. 7. For the last cases, two different FR deployment times have been analyzed. Thefirst is the gradual switching to FR starting from the year 2035, while the second from 2050. In literature, it is advocated that the need to accumulate Pu is preferable to meet the demands of thefirst load for the future FRs.
This study demonstrated (see Section4.3) that with a target of 400 GWe in 2050, the Pu recovered from LWRs and FRs is enough to meet the future FRs demand, both in case of a BR of 1.0 and 1.2. The option of recycling the Pu as MOX in LWRs in the second and third studied scenarios has been considered to assess the possibility of limiting the Pu stock accumulation in order to reduce the prolif-eration risk without compromising the availability of Pu as afirst
Fig. 2.NPP capacity anticipated evolution for the three scenarios for OT-NFC.
Fig. 3.Spent fuel accumulation fort the three scenarios for OT-NFC.
Fig. 4.Yearly natural uranium needed and cumulative natural uranium consumption
for OT-NFC.
load for the new FR. For all the above scenarios studied, the target of 400 GWe installed capacity by 2050 is assumed. Afinal variation of the ADS-MA fuel cycle with the gradual switching to FR in 2035 has been made to determine how many new FRs it would be possible to fuel with the recycled Pu from LWR and FR. This scenario can be seen as the FRs maximum expansion scenario. The different fuel cycle scenarios analyzed are summarized inTable 1.
4.1.1. Front end fuel cycle considerations
This paper does not focus on the front end of the fuel cycle and the Uranium fuel requirement, but rather the back end of the nu-clear fuel cycle. The sustainability of each particular nunu-clear fuel cycle in terms of natural uranium requirement, efficient
consumption of uranium resources, energy independence and environmental impact due do the mining tailing and energy usage in terms of SWU are discussed in a separate paper (Fiori and Zhou) together with consideration of proliferation risk.
4.1.2. NFC assumptions and input data for the INFCIS code
The INFCIS allows the user to set the main parameters that characterize the nuclear fuel cycle. A summary of these parameters and the selected values are shown inTable 2.
As discussed in (OECD/NEA, 2002), the loss in Enrichment, Fabrication and reprocessing have been set to 0.1%. The other pa-rameters have been set to their default values. The loss in conver-sion is used to calculate the natural uranium requirement for a determined set of enriched uranium while the volume of waste generated in reprocessing used to calculate the volume of the waste once treated is outside the interest of the present paper.
4.1.3. The nuclear reactor types
The present study on the Chinese nuclear fuel cycle is limited to the commercial NPPs. The research reactors have not been included in the models herein set up and the influence on the overall material flow of the fuel load and discharge from the research reactors has been assumed negligible. Eight reactor types have been imple-mented in the computational model to take into account three different phases of the Chinese LWR development: the early phase from 1994 to 2013 covers the reactors that are already constructed and in operation, the second phase from 2014 to 2020 covers the currentfleet of reactors under construction and proposed until 2020, and the long term phase from 2020 until 2100 follows the expected Chinese nuclear power development discussed previously in Section 3. Only PWR are assumed to support the future nuclear LWRs growth. CANDU reactors, fast reactor and ADS are other kinds of reactor used in the calculations (see Table 3). The reactor capacity factor is assumed to be increasing with the new generation of power reactors and with the increase in operational experience. The data used are derived from (OECD/NEA, 2006). The last column ofTable 3shows that the total fuel discharged from the reactor will be stored in the temporary spent fuel pool according to the specific cooling time and reprocessing capacity available for the specific fuel. The HTR reactor under design in China has not been included in the present NFC study for the sake of simplification. However, the capacity in the present HTR plan is negligible considering the national nuclear energy target of 400 GWe operating in 2050 on which this paper is based. Thefirst ADS reactor to come online is expected to be in 2030 (Wu, 2013). To be more conservative, we assumed thefirst ADS reactor to become operative only in 2035 with the second following eight years later. Further ADS reactors have been assumed to become operative in time to minimize the amount of stored MA. The assumption is justified considering that the manufacturing capability of China together with the standardized design of the reactor contribute to a fast deploy-ment of the reactor itself when needed. The data for the ADS reactor has been taken from (OECD/NEA, 2002) and (OECD/NEA, 2006) (see
Table 4). The core is fed by the MA output of both the LWRs and the
Fig. 6.“Double strata”cycle: LWR and fast reactor with dedicated MA burner scenario.
Fig. 7.“Double strata”cycle: LWR with MOX recycling and fast reactor with dedicated
MA burner scenario.
Table 1
Summary of the fuel cycle studied.
NFC type NFC scenario Scenario ID MOX in LWR FR BR ADS burner
O-T LWR Low ( 30%) NA NA No
Reference NA NA No
High (þ30%) NA NA No MOX-TRU LWR&ADS Low ( 30%) Yes NA Yes
Reference Yes NA Yes
High (þ30%) Yes NA Yes ADS-MA FR2035&ADS BR1.0 No 1.0 Yes BR1.0_MOX Yes 1.0 Yes
BR1.2 No 1.2 Yes
BR1.2_MOX Yes 1.2 Yes ADS-MA FR2050&ADS BR1.0 No 1.0 Yes BR1.0_MOX Yes 1.0 Yes
BR1.2 No 1.2 Yes
BR1.2_MOX Yes 1.2 Yes ADS-MA FR2035&ADS BR1.0FAST No 1.0 Yes
BR1.2FAST No 1.2 Yes
Table 2
Assumptions for the nuclear fuel cycle calculation parameters.
Data Value
Loss in conversion: 0.5%
Loss in enrichment: 0.1%
Loss in fabrication: 0.1%
Loss in reprocessing: 0.1%
Volume of HLW generated in reprocessing: 0.15 m3/tHM Volume of ILW generated in reprocessing: 0.35 m3/tHM
FRs. The equilibrium core composition results in a tangible Pu con-tent due to both the feed and the transmutation of minor actinides. The calculated equilibrium ADS fuel isotopic composition can be seen
inTable 5. The data shows that the irradiated fuel has slightly less
than two thirds of the original concentration of MA, down from a content of 41.7% of the fresh loaded core to 27.6% after cooling. A multiple reprocessing and transmutation cycles are therefore necessary to burn the MA and to close the fuel cycle.
4.2. The reference nuclear fuel cycle: MOX recyclingeTRU burning
In the present study, we assumed a “MOX recycling e TRU
burning” as described in (OECD/NEA, 2002) that can be seen in
Fig. 5. The present scenario assumed that part of the PWR reactors
will use a determined core share of MOX fuel while the partitioned MA are burned in dedicated ADS burners. The use of MOX fuel is nowadays a standard practice in countries with reprocessing ca-pacity (i.e. France and Japan) and in countries as a means to reduce the amount of weapon grade Pu. MOX recycling increases the total fuel efficiency thus reducing the amount of natural uranium need and SWU (Separative Work Unit). The benefits of dedicated ADS burner reactors, compared to FR burner, to reduce the MA stock and the burden of ILW and HLW storage on future generations have been deeply discussed in (OECD/NEA, 2002), which span from a higher reactor safety of the subcritical core, to more fuelflexibility due to the abundance of neutron originating from spallation target. The main input data necessary to set up the NFC study has been summarized in Table 2. The “loss in reprocessing” have been
imposed equal to 0.1%, according to (OECD/NEA, 2002), that is the maximum loss allowed during reprocessing in a partition & transmutation (P&T) scenario in order to have a radioactivity reduction of the HLW below the ore level in the order of 300.0 years. It is stated that any loss higher than that will jeopardized the scope of the P&T in terms of residual radioactivity reduction. It is difficult to predict exactly which will be the Chinese reprocessing capacity in the long term, for the present study we assumed that until 2035 the reprocessed capacity is the one discussed in Section 3.2. After that, we assumed that the reprocessing capacity can be increased accordingly as required by considering that the tech-nology will be at that point mature and ready to be deployed. The same holds true for the ADS-MA scenario discussed in Section4.3.
4.2.1. Results and discussion
The scope of the section is to evaluate the ADS capacity to reduce the MA and Pu stock in a MOX-TRU scenario aimed at reducing both the Pu and MA stock. This section discusses the re-sults of the calculation in the regard of the MA stock reduction. The calculated data shown here covers the time from the start of the nuclear power in China to the year 2100. The number of LWR in operation has been input following the discussion in Section3and new reactors (PWR type 3 and type 4) will come online to replace the reactor reaching the end of life.
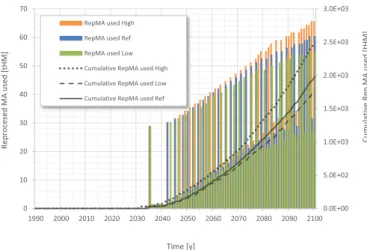
The ADS reactors will come online as soon as there are enough MA for thefirst core load. In the present study we assumed that the total MA inventory should not exceed50 tHM. The share of the MOX fuel used in thePWR type 4reactors is increased gradually in 10% steps from 10% of the total fuel in the core for thefirst ten years of operation with MOX fuel to the maximum of 50% according to the need to reduce the Pu storage build up to reduce the diversion risk. The total electrical installed capacity together with the operating ADS capacity are shown inFig. 8. Deviation from the 400 GWe of installed capacity in 2050 are due to the new ADS that come online as long as more MA needs to be burned.Fig. 9shows the reproc-essed MA used yearly and the cumulative one, in which each spike corresponds to a new ADS becoming operational.Fig. 10 demon-strates that the reprocessed MA stock is always lower than the target of 50 tHM. In order to achieve this goal, more ADS reactors need to be operated in the“high”development case compared to the“reference”case.
4.3. Double Strata NFC with gradual switch from LWR to FR and ADS-MA burner
The present section discusses the assumptions and results for the ADS-MA scenario simulation and the related variants Table 3
Nuclear reactor type and main input parameters.
Period of timea
ereactor type Efficiency [%] Load factor [%] U235[%] enrichment MOX fuel BU [GWd/tHM] Reprocessingc[%] Core Blanket
1994e2034aCANDU 33.0 90.0 0.711 No 8.0 0.0
1994e2013bPWR type 1 33.5 82.0 3.7 No 45.0 100.0
2013e2020 PWR type 2 34.0 90.0d 4.5 No 55.0 100.0
2020e2100 PWR type 3 35.0 90.0 4.5 No 60.0 100.0
2020e2100 PWR type 4e 35.0 90.0 4.5 Yes 60.0 100.0
2025e2100 FR BR1 (data from 0) 40.0 90.0 23.75 e 160 80 100.0
2025e2100 FR BR1.2 (data from 0) 40.0 90.0 23.75 e 140 50 100.0
2035e2100 ADS reactor (data from 0) 32.0 82.0 e e 250.0 100.0
aPeriod of time is the period of time when the reactor came online. bIt considered the lifetime of the reactor, hence the shutdown time.
c Reprocessing is the percentage of the discharged fuel that is sent to the reprocessing facilities. d Thefirstfive years of exercise have been considered having a load factor of 87.0%.
eThe reactor is the same as the PWR type 3 but the core is loaded with a variable in time percentage of MOX fuel.
Table 4
List of heavy nuclide in kg/TWhE for ADS at equilibrium.
Core type ADS
Fuel matrix Oxide
Fuel design Pin
U235 7.12
U236 5.62
U238 0.01
Np237 5.41
Pu238 79.40
Pu239 22.66
Pu240 117.29
Pu241 11.68
Pu242 49.62
Am241 88.96
Am242m 8.49
Am243 57.87
Cm242 0.02
introduced in 4.1. First the gradual switch from LWR to FR in 2035 is discussed followed by the results for the gradual transition in 2050. The models set up for the two scenarios rely on the same NFC as-sumptions and considerations. The only difference between the two models is the timing of the FR deployment. When used, the percentage of MOX fuel loaded in the LWR is increased up to 50% of the total fuel in the core in steps of 10% in order to keep the Pu stock at an acceptable level while still keeping a necessary reserve for the fresh core of the new FRs.
4.3.1. From LWR to FR in 2035
4.3.1.1. Breeding ratio 1.2. The results of the simulation of the transition scenario to FR in 2035 are summarized here. In a recent
presentation Prof. Xu Mi of the Chinese Institute of Atomic Energy advocated that the world needs to switch gradually to FR in 2035 with a BR kept constant at 1.2 until 2100 or until a conspicuous amount of Pu is stored in order to support the deployment of future FRs. Only after 2100 he called for a breeding ratio reduction to 1.0
(Xu, 2014). In the present study, we considered firstly that a
breeding ratio of 1.2 and then later also the option of BR1.0 has been simulated to understand if it is possible to reach the goal of 400 GWe installed in 2050 to reduce the stock of Pu, thus limiting the proliferation issue (see Sections4.3.1.2 and 4.3.2.1).
Fig. 11shows the total electrical capacity installation (blue bars,
in web version) together with the LWR&ADS capacity and the FR capacity (orange bars, in web version). The share of the installed capacity for the two reactor types is shown in the same picture on the secondary axis. Considering the 60 year design lifetime of the LWRs (see Section4.1.3), the last LWR is shut down only in 2100. Therefore at the end of the considered time span, more than 90% of the installed generating capacity is of FR with the remaining 10% of ADS reactors (seeFig. 11). The plateau in the FR installed capacity between the years 2055e2080 is due to the fact that in order to maintain the goal of around 400 GWe of installed capacity in 2050, old LWRs must reach the end of life and be shut down before adding new FRs capacity. In the present calculation, the transition between LWR and FR will begin in 2035 when thefirst FR is con-nected to the grid. From the average of around 11 GWe of new LWRs capacity installed from 2025 to the year 2035, the new LWRs ca-pacity is gradually reduced to zero GWe in year 2040 and replaced by FR. The study shows that the LWR cycle produces about 25% more MA compared to the FR development scenario thus requiring a higher number of ADS to cope with the MA (seeTable 6). The evidence can be seen inFig. 12(this picture represents the MA used, Table 5
ADS Fuel Isotopes composition.
Isotope Beginning of cycle [%] End of cycle [%] After cooling [%] Isotope Beginning of cycle [%] End of cycle [%] After cooling [%]
U235 1.4129 0.6971 0.6973 Am243 11.4898 8.8639 8.8614
U236 1.11598 1.06456 1.07035 Cm242 0.004 0.30603 0.00576
U238 0.002 0.00181 0.00186 Cm244 9.8299 7.1857 6.40588
Np237 1.07398 0.75992 0.81 Tot Pu 55.7224 44.0186 44.48761
Pu238 15.7648 12.0357 12.056 Tot MA 41.7465 28.4429 27.6613
Pu239 4.4989 2.28925 2.2915 Fis Pu 6.8179 4.62992 4.31745
Pu240 23.2877 18.191 18.9522 Tot Am 30.838 20.1912 20.4398
Pu241 2.31897 2.34063 2.0259 Tot Cm 9.8339 7.49179 6.41145
Pu242 9.8519 9.16184 9.16179 Tot U 2.5309 1.76350 1.76954
Am241 17.6628 10.46 10.7238 Tot HM 100 74.2251 73.9184
Am242m 1.68598 0.86725 0.85455 Tot FP 0 25.7749 26.0815
Fig. 8.NPP capacity and ADS capacity for the three scenarios.
Fig. 9.Reprocessed MA burned yearly and cumulative for the three scenarios.
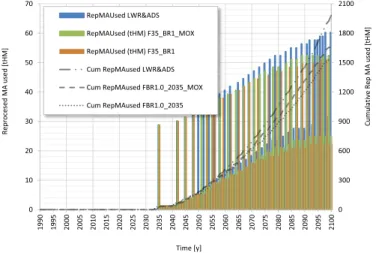
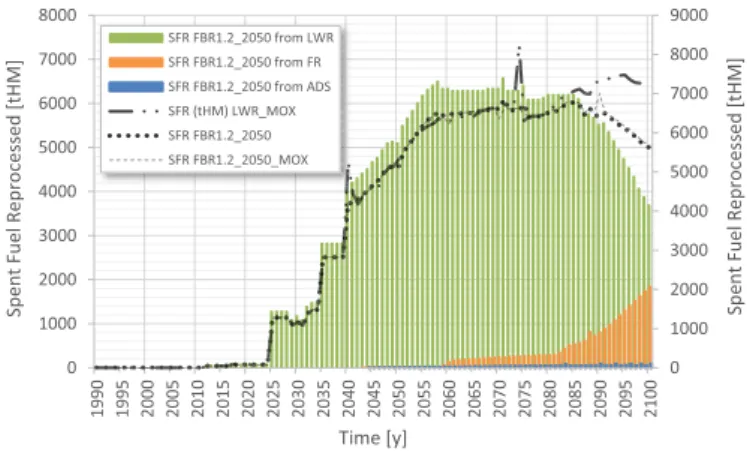
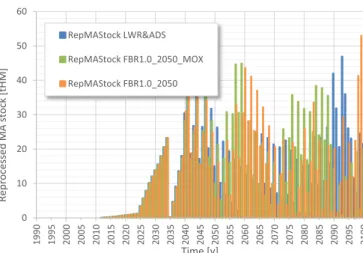
not the one reprocessed, considering that for all the calculations, the goal to have at any time less than 50 tHM of MA stock, the“MA used”can be used to draw a conclusion on the“MA reprocessed”). The same effect is more clearly represented inFig. 14, where the ratio of the cumulative reprocessed MA for the ADSeMA cycle and the cumulative reprocessed MA for the MOX e TRU cycle is compared. The picture also shows the same ratio but for the reprocessed Pu. The increase of this material in the overall fuel cycle is between a factor of 1.65e1.98 for the different ADSeMA cycles considered. The implications of this effect are discussed in a separate paper (Fiori and Zhou).Fig. 13shows the reprocessed MA inventory per year, where the quantity is always below the goal of 50 tHM. The SF reprocessed each year is shown inFig. 15, demon-strating that China will have to invest heavily on the construction of advanced reprocessing facility in order to reach the required 5300 tHM/year of capacity for the MOX-TRU cycle and slightly less for the ADS-MA strategy in 2050. The same picture shows a consistent reduction in reprocessing capacity requirement if the ADS-MA is adopted. In the latter case, the recycling of Pu as MOX fuel does not have a significant impact on the reprocessing capacity requirement.
4.3.1.2. Breeding ratio 1.0. This section summarizes the MA results of the ADSeMA cycle with gradual transition to FR in 2035 and BR
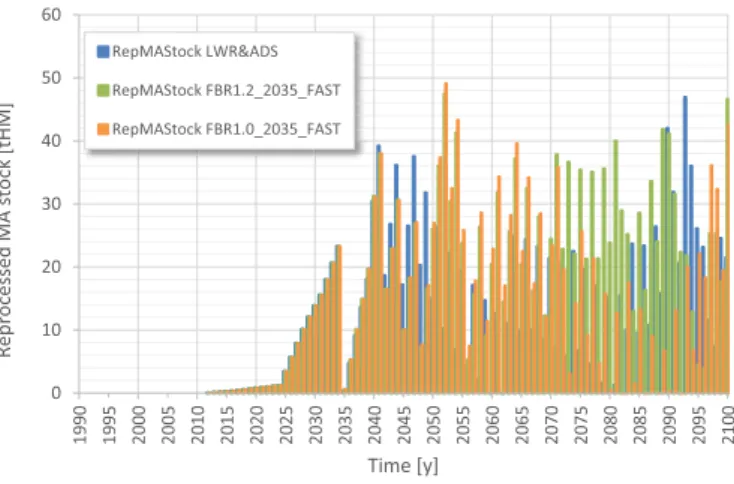
of 1.0. However the FRs that come online between 2035 to the year 2038 have a breeding ratio of 1.2 in order to produce enough Pu to fuel the fresh core of the future FRs. Calculation with the breeding ratio equal 1.0 shows that the Pu coming from the reprocessing of the LWRs SF is not enough to support the new FRs capacity to meet the 400 GWe requirement in 2050. The lower breeding ratio is obtained by decreasing the fuel burn up (seeTable 3). As it can be seen inFig. 16, this affects the MA produced in the ADS-MA cycle that is slightly higher than the one produced in the same cycle with BR 1.2.Fig. 17shows that the MA stock is always lower than 50 tHM.
4.3.2. From LWR to FR in 2050
4.3.2.1. Breeding ratio 1.2. This section summarized the results of the simulation for the transition scenario to FR in 2050.Fig. 18 shows the total electrical capacity to be installed (blue bars, in web version) together with the LWR&ADS capacity and the FR pacity (orange bars, in web version). The share of the installed ca-pacity for the two reactor types is shown in the same picture on the secondary axis. Considering the design lifetime of the LWR (see Section4.1.3) the last LWR will be shut down in 2110. Therefore, in 2100, the 25% of the install capacity that is not covered by FR is covered by both LWR and ADS reactors. In the present calculation, the transition between LWRs and FRs is assumed to begin in 2050
Fig. 11.Total Capacity, LWR&ADS and FR partial capacity.
Table 6
Key features summary for the studied scenarios.
N NFC type NFC scenario Scenario ID N. Of ADS [-]
Cumulative recovered Pu [tHM]
Max Pu stock [tHM]
Cumulative recovered MA [tHM]
Max MA stock [tHM]
Cumulative NatU used [tHM]
Cumulative SF reprocessed [tHM]
MA/TOTea [kgHM/TWe/h]
1 O-T LWR Low ( 30%) NA NA NA NA NA 3.40∙106 3.96∙105b NA
2 Reference NA NA NA NA NA 4.02∙106 4.66∙105b NA
3 High (þ30%) NA NA NA NA NA 4.68∙106 5.36∙105b NA
4 MOX-TRU LWR&ADS Low ( 30%) 28 6485 <40 1683 <50 2.35∙106 3.57∙105 0.0089
5 Reference 32 7480 <50 2004 <50 2.83∙106 4.16∙105 0.00875
6 High (þ30%) 37 9020 <70 2432 <50 3.40∙106 4.75∙105 0.00886
7 ADS-MA FR2035&ADS BR1.0 24 12,460 1115 1526 <50 2.33∙106 3.53∙105 0.00653
8 BR1.0_MOX 27 13,010 335 1981 <50 2.16∙106 3.53∙105 0.00706
9 BR1.2 23 13,950 2300 1160 <50 2.31∙106 3.70∙105 0.00645
10 BR 1.2_MOX 27 14,780 1050 1720 <50 2.05∙106 3.70∙105 0.0072
11 ADS-MA FR2050&ADS BR 1.0 24 7400 1965 1535 <50 2.96∙106 3.92∙105 0.00678
12 BR1.0_MOX 29 8880 126 1890 <50 2.62∙106 3.92∙105 0.00804
13 BR 1.2 24 8355 2670 1155 <50 2.96∙106 3.99∙105 0.0071
14 BR 1.2_MOX 28 9695 470 1790 <50 2.65∙106 4.00∙105 0.00807
15 ADS-MA FR2035&ADS BR1.0FAST 27 14,240 350 1680 <50 2.32∙106 4.21∙105 0.00654
16 BR1.2FAST 31 20,640 205 1814 <50 2.32∙106 3.66∙105 0.00590
aCalculated in 2100.
bIt is the Spent Fuel stored not reprocessed.
when thefirst commercial FR is connected to the grid. From the average of around 11 GWe of new LWR capacity installed from 2025 to the year 2050, the new LWR capacity will be reduced to zero GWe in year 2051 and replaced by FRs. The study shows that the LWR fuel cycle produces about 22% more MA compared to the FR development scenario thus requiring more ADS devices to cope with the produced MA (seeTable 6). The evidence of this can be seen in Fig. 19which represents the MA used but not the one reprocessed. Considering that for all the calculations the goal to
achieve at any time less than 50 tHM of MA stock, the“MA used”can be used to draw conclusion on the“MA reprocessed”. The same ef-fect is more clearly represented inFig. 21, where the ratio of the cumulative reprocessed MA for the ADSe MA cycles to the cu-mulative reprocessed MA for the MOXeTRU cycle is shown. The picture also shows the same ratio but for the reprocessed Pu. The increase of plutonium in the overall fuel cycle is quantified with a factor in the range of 1.02e1.3 for the different ADSeMA cycles
Fig. 14.Cumulative MAeRF and PUeRF.
Fig. 15.Yearly Spent fuel reprocessed and source of the spent fuel.
Fig. 16.MA used and cumulative MA used for three scenario.
Fig. 17.Reprocessed MA stock per year.
Fig. 18.Total Capacity, LWR&ADS and FR partial capacity.
considered.Fig. 20shows the reprocessed MA inventory per year, with the quantity never exceeding 50 tHM. The SF reprocessed each year is showed inFig. 22, demonstrating that China will have to invest heavily on the construction of advanced reprocessing facility in order to reach the required capacity of 5250 tHM/year for the MOXeTRU and ADSeMA strategy in 2050. The picture shows that a slight reduction in reprocessing capacity is projected in case the ADSeMA cycle is adopted. In the latter case, the recycling of Pu as MOX fuel does not have a significant impact on the reprocessing capacity requirement.
4.3.2.2. Breeding ratio 1.0. This section summarizes the results of the ADSeMA cycle with transition to FR with BR of 1.0 in 2050. The lower breeding ratio is obtained, yielding the decrease of the fuel burn up (seeTable 3). As can be seen inFig. 23, this affects the MA produced in the ADS-MA cycle that is slightly higher than the one produced in the same cycle with BR 1.2.Fig. 24shows that the MA stock is always lower than 50 tHM.
4.3.3. From LWR to FR, highest possible FR deployment case
It is hard to predict the long term Chinese nuclear power development. In literature, however, it is possible tofind an esti-mation of an installed capacity of about 1000 GWe in 2100 (Xu,
2008; WNA). For this reason, we decided to see which is the
maximum possible FRs expansion in case China switches to fast reactor in 2035, and to study what is the impact on the back end of the NFC in such a scenario. In this study, the Pu to fuel the FRs is
recycled both from the operating LWRs and FRs, and the transition from the LWR to FR is gradually achieved as described in Section
4.3.1.1. The results inFig. 25show that under this assumption the
maximum installed electrical capacity in 2100 will be about 850 GWe if a BR of 1.2 is selected. To meet the eventual requirement of 1000 GWe, it will be necessary to support the nuclear expansion with LWRs and even other nuclear power plant designs such as the HTGR. Although the BR could theoretically be decreased to have higher production of Pu, such possibility would probably be non-economical or would result in the core redesign with less safety margin and poorer economic performance. Another drawback of a decreased burn up is the increase of the MA concentration in the discharged fuel.Fig. 26shows the yearly MA reprocessed and the cumulative MA reprocessed for the three scenarios considered. It is important to underline that an 850 GWe nuclear park composed mostly of FRs with BR 1.2 and a 500 GWe nuclear park composed mostly of FRs with BR 1.0 have a cumulative MA production that is 10% and 25% less than a 430 GWe LWR nuclear park respectively.
Fig. 27shows that the MA yearly stock is less than 50 tHM. This case
requires an increase in the number of installed ADS in order to cope with the higher production of MA compared to the results of the previous sections (seeTable 6).
4.4. Discussions
The results presented herewith are not exhaustive of the overall study performed and are limited to the closure issue of the fuel cycle, which is more focused on the MA produced by the different NFC options analyzed to answer the question of how many ADS
Fig. 19.MA used and cumulative MA used for three scenario.
Fig. 20.Reprocessed MA stock per year.
Fig. 21.Cumulative MAeRF and PUeRF.
devices China needs to build and with what time schedule in order to close the NFC.
The results shown above are summarized in a more compact but not exhaustive way inTable 6.“Scenario 15 and 16”are reported as a term of reference but will not be considered in the present dis-cussion as the goal of 400 GWe in 2050 has been exceeded on purpose. In any case, the results of the two cases mentioned above show that from the point of view of MA reduction only, the best option is to construct a nuclear reactor park that maximizes the FRs due to the reduced amount of MA.“Scenario 4 and 6”will be also excluded from the following considerations as they do not meet the requirement of 400 GWe in 2050.
InTable 6, it can be seen that the number of ADS necessary to
keep the MA stock under the target of 50 tHM span from the minimum of 23 and a maximum of 37 facilities for the ADS-MA strategy with BR 1.2 of the FRs gradually adopted from 2035 (“strategy 9”) and for the MOX-TRU strategy with a high develop-ment scenario of the nuclear deploydevelop-ment (“strategy 5”) respec-tively. From the analysis of all the column inTable 6is not possible to declare a clear winning strategy for the future NFC as each sce-nario possesses advantages and drawbacks.“Scenario 9”is the one with the minimum ratio of MA produced and total electricity generated and it looks like the best choice from the point of view of the back end closure. However, it is the one with the highest cu-mulative Pu recovered and Pu stock accumulation, thus posing higher risk of diversion and proliferation. The use of the ADS re-actors as a choice for China to close the nuclear fuel cycle is, in the light of the present study and results, a valuable choice capable of
preventing the MA actinide stock build up with the construction of about one ADS reactor for every nine LWRs in the case of“scenario 5”and one ADS for every seventeen FRs in the case of“scenario 9”.
FromTable 6it is clear that the Pu recycling as a MOX fuel in LWRs
has two main positive effects: the considerable reduction of the Pu stock accumulation thus reducing the proliferation risk, and the reduction of the natural uranium requirement increasing the application efficiency of the uranium resources. A major drawback is the MA production increase that negatively affects the back end of the NFC strategy. The gradual switch to the double strata scenario (ADS-MA strategy) has a positive effect on the back end of the fuel cycle with a considerable reduction of the MA produced. The reduction is larger the sooner the scenario is implemented. It can be seen that for“scenario 9”, the cumulative MA produced are only 45% of the reference scenario (“scenario 5”). The adoption of the ADS-MA strategy also has a positive effect on the spent fuel that needs to be reprocessed, and this advantage is more significant with the early adoption of FRs. In this case, the number of trans-mutation reactors that will be necessary to operate in the time span considered is about twenty three if the FRs BR is 1.2 or twenty four if the FRs BR is 1.0.
5. Conclusion
This study shows that the planned and foreseen Chinese nuclear expansion will generate an enormous amount of spent fuel. The closure of the fuel cycle is then more of a necessity rather than only a political and strategic decision. The results herein discussed show
Fig. 23.MA used and cumulative MA used for three scenario.
Fig. 24.Reprocessed MA stock per year.
Fig. 25.Total capacity, LWR&ADS, FR BR1.0 and FR BR 1.2.
that the selection of the future strategy should take into account aspects that go beyond the MA production and accumulation. The natural uranium requirement, fuel utilization efficiency, prolifera-tion and diversion of sensible material also need to be part of the discussion. Apart from this, the present study indicates that the accelerator driven system reactors can give a major contribution to the closure of the NFC both in LWRs and in FRs dominated nuclear parks. From the point of view of the MA reduction, the most effective strategy is the ADS-MA with gradual switch to FRs starting in 2035. In this case, the number of transmutation reactors that will be necessary to operate in the time span considered is about twenty three if the FRs BR is 1.2 or twenty four if the FRs BR is 1.0. In other words, in the case of a MOX-TRU strategy, the number of ADS is one for every nine LWRs and about one for every seventeen FRs in case of the ADS-MA strategy. The impact of the Pu recycling as MOX fuel in LWRs has been also studied. The results show that it is effective in increasing the overall fuel efficiency and in preserving the nat-ural uranium resources. However, it creates more MA thus nega-tively affects the back end of the FC. The FRs help reduce the MA generation and increase the fuel utilization while preserving the natural uranium resources with drawbacks on proliferation and diversion due to the higher overall Pu circulation in the FC compared to a LWRs scenario. In conclusion, it is possible to state that the ADS reactor is a viable option in order to reduce the HLW
that need to be geologically disposed of, which is the strategy that China will follow for its nuclear expansion.
Acknowledgment
Institute of Nuclear and New Energy Technology, Collaborative Innovation Center of Advanced Nuclear Energy Technology, Key Laboratory of Advanced Reactor Engineering and Safety of Ministry of Education, Tsinghua University, Beijing 100084, China.
References
Bai, Y., 2011. Overview of PbBi Cooled Reactor Development and ADS Program in China.www.fds.org.cn.
“CAEeChinese Academy of Engineering: China to accelerate the development of nuclear power is necessary and urgent”, Available at:http://www.chinanews. com/ny/2011/02-28/2873748.shtml.
Chen, J., et al., 2012. Back-end of nuclear fuel cycle in China. Prog. Nucl. Energy 54, 46e48.
Fiori F., Zhou Z.W.,“Sustainability of the Chinese Nuclear Expansion, study on natural uranium resources, proliferation issue and back end of the nuclear fuel cycle”Unpublished Results.
IAEA TEC-DOC-1613 IAEA, April 2009. Nuclear Fuel Cycle Information System: a Directory of Nuclear Fuel Cycle Facilities. Vienna.
IAEA-INFCIS, 2011. INFCIS User Manual.
OECD/NEA, 2002. Accelerator-Driven System (ADS) and Fast Reactors (FR) in Advanced Nuclear Fuel Cycles: a Comparative Study.
OECD/NEA, 2006. Physics and Safety of Transmutation Systems: a Status Report. Wang, Q., 2009. China needing a cautious approach to nuclear power strategy.
Energy Policy 37, 2487e2491.
WNAeWorld Nuclear Association,“China's Nuclear Fuel Cycle”, Available at:http:// www.world-nuclear.org/info/Country-Profiles/Countries-A-F/Chinae Nuclear-Fuel-Cycle/#FNR.
WNAeWorld Nuclear Association, 2013. Nuclear Power in China. Available at:http:// www.world-nuclear.org/info/Country-Profiles/Countries-A-F/Chinae Nuclear-Power/.
Wu, Y., 2013. Development Plan and R&D Status of China Lead-based Reactors (CLEAR) for ADS, LFR and Fusion. IAEA TM on LMR Vienna 12-6-2013. Xu, M., 2008. Fast reactor development strategy target study in China. Nucl. Sci. Eng.
28 (1), 20e25.
Xu, M., 2014. Sodium cold fast reactor and its safety. In: Advanced Reactors Tech-nology Seminar Conference Proceeding Suzhou Nuclear Power Research Insti-tute, Nanjing, China, 2014 (translated from Chinese).
Zhou, Y., 2010. Why is China going nuclear? Energy Policy 38, 3755e3762. Zhou, Y., 2011. China's spent nuclear fuel management: current practices and future
strategies. Energy Policy 39, 4360e4369.
Zhou, S., Zhang, X., 2010. Nuclear energy development in China: a study of op-portunities and challenges. Energy 35, 4282e4288.
Zhou, Y., et al., 2011. Is China ready for its nuclear expansion? Energy Policy 39, 771e781.