Contents lists available atScienceDirect
Journal of Analytical and Applied Pyrolysis
journal homepage:www.elsevier.com/locate/jaap
Soil carbon stabilization pathways as reflected by the pyrolytic signature of
humic acid in agricultural volcanic soils
Z. Hernández
a,⁎, G. Almendros
b, A. Álvarez
a, T. Figueiredo
c, P. Carral
aaDept. Geology and Geochemistry, Autonomous University of Madrid (UAM), Cantoblanco, Madrid, Spain
bMNCN-CSIC, Spanish Council of Scientific Research, Serrano 115b, 28006, Madrid, Spain
cCIMO-Mountain Research Center, Instituto Politécnico de Bragança, Portugal
A R T I C L E I N F O
Keywords:
Allophane GC/MS Methoxyphenol
13C NMR
Soil organic matter Van Krevelen diagram
A B S T R A C T
Molecular assessment of the origin and transformation processes of soil organic matter (SOM) was carried out
based on information obtained from13C NMR and analytical pyrolysis of humic acids (HAs) in soils from
wine-growing regions in Tenerife (Canary Islands, Spain). Principal component analysis, using as variables pyrolysis products, shows different soil groups defined by the molecular assemblages released from the corresponding HAs, characterized by the predominance of: i) plant biomacromolecules (lignin) in soils on pumice substrate, ii) heterocyclic N-compounds and methoxyl-lacking aromatic structures, iii) a substantial domain of alkyl com-pounds in cultivated soils with active C turnover and finally, iv) polysaccharide and protein-derived comcom-pounds in soils developed on amorphous gels. The proportions of the pyrolytic compounds from soil HAs were re-presented by an upgraded graphical-statistical method (3D Van Krevelen plot) that was used to compare the
major SOM structural domains in the different soils. The above results coincide with those suggested by the13C
NMR analysis, and were associated to two groups of local land management practices, in terms of their intensity respectively favoring either the transformation of plant-inherited macromolecular precursors from vascular plants, or the humification of aliphatic precursors in the presence of specific mineralogical substrates controlling microbial degradation and humification processes.
1. Introduction
The SOM is the largest pool of organic C on the Earth’s surface and it is involved in a series of physicochemical and biological processes re-sulting in the improvement of environmental quality, soil fertility and soil hydrophysical properties [1]. Upon HA fractionation, more than 50% of the total soil can be extracted [2], and its chemical composition includes a series of biogeochemical marker compounds that provide valuable information on the origin and transformation processes of the whole SOM [3].
Concerning the mechanisms favoring SOM storage, a series of overlapped C stabilization pathways has been suggested [4,5]. Classical models assume that humification processes depend mainly on some structural constituents from plant and microbial biomass that are not readily biodegradable because of their chemical composition (i.e. pre-sence of presumably recalcitrant lignins and aliphatic macromolecules) [6] which, under conditions limiting biological activity, i.e. extreme acidity, high water saturation or anoxic environment, could accumulate as altered forms in soils [7]. Such intrinsic resistance to biodegradation
may be enhanced to large extent by further preservation of SOM via resistant microaggregates where diffusion of soil enzymes is largely hampered [8–10].
Volcanic soils have classically been the subject of interest due to recognition of their C storage potential [11]. Nevertheless, despite their outstanding endogenous potential as C sinks, biogeochemical mechan-isms involved in such stabilization are still controversial. In fact, the classical literature has suggested the accumulation of recalcitrant aro-matic structures [12] but further studies evidenced that such an ar-omaticity could be solely a local feature due to accumulation of pyro-genic SOM [13]. Furthermore, some later research has demonstrated that volcanic ash soils could even be enriched with easily-biodegrad-able SOM from plants and microorganisms [14–16]. In these cases, C stabilization based on organic molecules entrapped in water-saturated micropores which are progressively defined at lower organizational levels of the fractal scale has been postulated [17,18].
It seems to have been clearly established that C stabilization in soils developed on volcanic ash is to a large extent favored by non-crystalline minerals with large specific area [19]. Nevertheless, there are
https://doi.org/10.1016/j.jaap.2018.10.015
Received 25 January 2018; Received in revised form 15 October 2018; Accepted 18 October 2018
⁎Corresponding author.
E-mail address:[email protected](Z. Hernández).
Available online 22 October 2018
0165-2370/ © 2018 Published by Elsevier B.V.
additional SOM stabilizing processes such as the formation of metal-SOM complexes that could explain the low biodegradation rates [20], or even the effect of aluminum toxicity on soil microorganisms [21]. Overall, the above constraints result in SOM that is tightly adsorbed into mineral surfaces or bound up in metals and protected against mi-crobial action [7,10]. The fact that carbohydrate- and protein-derived compounds are present in resilient soil fractions in these soils suggests strong physicochemical interactions leading to stable soil organo-mineral complexes [15,21]. Such effective soil C stabilization factors, including preservation of aliphatic microbial biomass, may result in a large SOM pool even in subtropical regions [16,18].
In this context, molecular characterization of soil HAs by analytical pyrolysis has been extensively used to assess the effect of land use change on soils and specifically for monitoring the formation humic substances of agronomical interest after microbial reworking of plant biomacromolecules [22,23]. In addition, pyrolytic markers have also been used to evaluate the role of mineral phases (oxides, clays or or-ganomineral complexes) as stabilizing agents of the SOM [24]. Most studies on the chemical composition of SOM in Andosols have focused on the analysis of ecosystems that are undisturbed by agricultural practices. In this study, volcanic soils from vineyards on different geological substrates were analyzed by routine physicochemical tech-niques, and the chemical composition of the soil-HAs was characterized by analytical pyrolysis. The aim of this exploratory study was to assess the main humification mechanisms active in andosols as reflected by pyrochromatographic information.
2. Material and methods
2.1. Soil sampling
The study was carried out on volcanic soils from wine-growing re-gions of Tenerife Island (Canary Islands, Spain) located between lati-tude 28° 08′–28° 28′ N and longilati-tude 16° 39–16° 23′ W, under a sub-humid thermo-Mediterranean climate [25]. A total of 24 soil samples were collected from seven zones (Z1–Z7) under the same crop, i.e. vi-neyards, but different agricultural management practices were chosen as the study area (Table 1). The soil types correspond to: i) cultivated Andosols (Z1 and Z2, respectively), ii) soils on basaltic substrate without andic properties (Z3 and Z4), iii) Anthrosols on volcanic ma-terials transported by farmers around one century ago (Z5), and ii) Anthrosols on pumice substrate (Z6 and Z7). Soil samples of ca. 500 g were collected in April at 0–20 cm depth, air-dried and homogenized with a 2 mm aperture sieve before analysis.
2.2. Laboratory analyses
2.2.1. Soil diagnostic properties
A series of routine physical and chemical techniques was applied in soil samples homogenized to < 2 mm [26]. Bulk density was estimated in the field using 250 cm3 stainless steel cylinders. Textural analysis was
carried out by wet sieving after applying dispersant agent and the Bouyoucos hydrometer method [27]. Soil pH was measured in 1:2.5 (w:w) water suspension. Total organic C was determined by wet oxidation with 1N potassium dichromate [28]. Cation exchange capacity (CEC) was measured with an ammonium selective electrode and the exchangeable H+was determined by difference. Available cations were extracted with
ammonium acetate and determined by flame emission (Na+, K+) or
atomic absorption (Ca2+and Mg2+) spectroscopies, respectively, and the
% base saturation was calculated as [(Ca2++ Mg2++ K++ Na+)/CEC]
× 100. The allophane content was indirectly determined as the (Alo+ ½
Feo) index [29] where acid oxalate-extractable iron and aluminum (Feo,
Alo) and pyrophosphate-extractable iron and aluminum (Fep, Alp) were
measured by inductively coupled plasma optical emission spectroscopy (ICP-OES) [30]. In order to differentiate inorganic and organic Al forms, the ratio between pyrophosphate and oxalate-extractable Al was Tab
determined (Alp/Alo). Allophane content was estimated as (100 × Sio/
[23.4–5.1 × (Alo–Alp)/Sio)] [26,29]. Phosphate retention, which is a
surrogate of the andic character in volcanic soils, was determined by visible spectroscopy, after suspending the soil sample in a standard solu-tion (1 mg kg−1P) and measuring the intensity of the resulting colored P
complex at 466 nm. Clay minerals were routinely identified by X-ray dif-fraction using a Philips X’Pert diffractometer and the Cu-Kα radiation.
The total mineralization coefficient (TMC) commonly used to evaluate the CO2emission to atmosphere (mg C kg C soil−1day−1) was
determined under laboratory conditions by incubating soil samples at 27 ± 0.1 °C and 66% water saturation in Erlenmeyer flasks for 30 days and measuring the released CO2with a gas analyzer (Carmhograph-12,
Whöstoff, Germany) [20].
2.2.2. Isolation of soil organic fractions
The particulate, free organic matter (FOM) was removed by flota-tion in 2Mphosphoric acid (ρ = 1200 kg m−3) from 20 g soil, followed
by flotation in a bromoform-ethanol mixture (1:1; v:v; ρ = 1800 kg m−3). In particular, acid treatment produces a partial
de-mineralization that favors the subsequent efficiency of alkaline ex-tractants [31]. From the above residue (centrifugation pellet), the total humic extract (THE) was extracted with successive treatments with alkaline agents: 0.1M Na4P2O7 followed by 0.1M NaOH in 250 cm3
centrifuge bottles. From the above extract, and based on solubility properties of the SOM, the HA was precipitated with HCl at pH = 1 and the concentration of soluble fulvic acid (FA) was calculated by differ-ence with the THE. The soil residue with the humin fraction was
Table 2
Average soil physicochemical properties in volcanic agricultural soils from Tenerife Island (Spain).
Z1 Z2 Z3 Z4 Z5 Z6 Z7 LSD2
Soil organic carbon (SOC, g kg−1) 51 33 19 13 17 25 25 5
Total mineralization coefficient (mg C kg C soil−1day−1) 44 61 111 77 98 105 129 24
pH (H2O) 5.2 4.4 6.3 5.6 7.3 7.2 7.4 0.4
Cation exchange capacity (cmolckg−1) 26 22 17 16 29 21 17 2.8
% Base saturation 66 24 78 84 106 129 65 17
Allophane content: Alo+1/2Feo(g kg−1) 15.6 10.6 9.1 6.5 10.1 8.9 3.6 0.9
Alp/Aloratio 0.24 0.73 0.37 0.24 0.19 0.14 0.10 0.07
% P retention 55 34 34 31 23 16 0 5
Bulk density (kg m−3) 795 920 964 955 854 853 1056 40
Sand content (g 100 g−1soil) 35 43 27 35 35 57 65 2
Silt content (g 100 g−1soil) 35 33 26 35 32 27 24 1
Clay content (g 100 g−1soil) 27 28 48 29 33 17 10 3
Presence of clay minerals1 – – + + + – – –
1Clay minerals identified by XRD as kaolinite and illite.
2LSD = least significant difference between spatial replications with aPvalue < 0.05.
Table 3
Average soil organic matter fractions in 100 g C·Kg soil−1of volcanic agricultural soils from Tenerife Island (Spain).
Z1 Z2 Z3 Z4 Z5 Z6 Z7 LSD1
Free organic matter, FOM 0.87
(1.4) 0.61 (1.8) 0.25 (1.2) 0.50 (4.2) 0.10 (0.4) 0.45 (3.1) 0.78 (3.1) 0.11 (0.8)
Humic acid, HA 16.8
(30.7) 9.2 (27.6) 6.2 (32.3) 6.0 (40.2) 5.0 (39.9) 5.5 (16.5) 4.2 (16.5) 2.7 (7.5)
Fulvic acid, FA 5.9
(11.0) 6.2 (19.2) 3.3 (16.5) 1.8 (12.6) 1.4 (10.0) 6.3 (21.3) 5.4 (21.3) 1.4 (5.1)
HA/FA ratio 2.8 1.5 1.9 3.3 3.6 0.9 0.8 1.9
Oxide-associated insolubilized humin, o-EIH 0.64 (1.2) 0.30 (0.9) 0.32 (1.5) 0.43 (2.4) 0.43 (3.1) 0.32 (1.2) 0.32 (1.2) 0.1 (0.4) Clay-associated insolubilized humin, c-EIH 1.1
(2.2) 1.2 (3.5) 1.2 (6.4) 1.2 (7.9) 1.1 (9.5) 1.1 (4.1) 1.0 (4.1) 0.1 (1.3)
Non-extractable humin, n-EIH 27.4
(53.5) 15.8 (46.9) 8.5 (42.1) 3.4 (32.7) 4.7 (37.1) 10.0 (53.8) 13.6 (53.8) 2.9 (5.2)
Numbers in parentheses indicate percentage of the total soil C (g C·100 g soil C−1).
1LSD = least significant difference between field plots withP< 0.05.
Table 4
Average spectroscopic characteristics of soil HAs in volcanic agricultural soils from Tenerife Island (Spain).
Z1 Z2 Z3 Z4 Z5 Z6 Z7 LSD2
Visible spectra (absorption units, AU)
Optical density at 465 nm (E4) 1.5 1.0 1.5 1.1 1.0 0.9 0.5 0.2
Fungal pigments1(AU · 104) 25 16 17 16 18 12 5 3
13C NMR signal intensity (% total signal intensity)
Alkyl region (Al C, 0–46 ppm) 23 23 14 30 24 26 29 3
O-alkyl region (O-Al C, 46–110 ppm) 22 25 17 30 30 28 30 3
Total aromatic region (Ar C, 110–160 ppm) 35 33 46 29 26 27 28 5
Carboxyl region (C=O C, 160–220 ppm) 20 19 23 11 20 19 13 4
Heterosubstituted Ar C (152 + 148 ppm) -to- unsubstituted Ar C (128 ppm) (Het/uns Ar C) 0.38 0.36 0.35 0.26 0.41 0.46 0.47 0.06
1Sum of the intensity of the valleys in the second derivative visible spectra at 458 and 622 nm, produced by fungal pigments
(4,9-dihydroxyperylene-3,10-quinone).
progressively treated with 60 mMsodium dithionite and a mixture of 1M(1:1) HF−HCl [32] to differentiate between oxide-associated and clay-associated insolubilized humin (o-EIH and c-EIH, respectively). The final insoluble residue was considered to be the non-extractable humin (n-EIH).
For further structural characterization, the HA fraction was purified by redissolving in 0.5MNaOH and centrifuging at 43,500 g to remove the insoluble clay minerals. The HA was then reprecipitated at acidic pH 1.5 and dialyzed in cellophane bags (Visking®dialysis tubing, mo-lecular weight cut-off 18,000; pore diameter ca. 12–14,000 Daltons, Medicell) and finally dried at 35 °C.
2.2.3. Spectroscopic characterization of humic acids
The optical density of the HAs at 465 nm (E4) was considered as an aromaticity index and measured in 0.01MNaOH solutions of 0.2 mg C cm−3 using a Hewlett-Packard 8452 A vis/UV diode array
spectrophotometer. The second derivative visible spectra were obtained in order to identify specific peaks (at ca. 455, 430, 570 and 620 nm) produced by fungal quinoid melanins responsible for the greenish color of the so-calledP-type HAs [33].
The CPMAS 13C nuclear magnetic resonance (13C NMR) spectra
were acquired in the solid-state with a Bruker MSL 100 spectrometer (2.3 T) at 25.1 MHz. Up to 1000 free induction decays were accumu-lated for each spectrum. The pulse repetition rate was 5 s and the contact time 1 ms. The sweep width was 37.5 kHz, and the acquisition time was set to 0.016 s. Magic angle spinning (MAS) was performed at 4 kHz. The chemical shift range was referred to tetramethylsilane (= 0 ppm). Under these conditions, the NMR technique is considered to provide quantitative integration values in the different spectral regions [34]. The whole13C spectra were divided into the following ranges:
0–46 ppm = alkyl C (15 = methyl, 33 = polymethylene); 46–110 ppm = O-alkyl C (56 = methoxyl/α-amino, 73 = major carbohydrates
Fig. 1.13C NMR spectra of soil HAs from volcanic soils subjected to different agricultural management practices. Labels on the peaks refer toTable 4. Different types
signal, 103–105 = anomeric C in carbohydrate and quaternary aro-matic C in tannins); 110–160 ppm = aroaro-matic C (ca. 126 = aroaro-matic C–H, 135 = unsubstituted, quaternary aromatic C, 147 = hetero-substituted: guaiacyl (G) lignins/dihydroxys of tannins; ca. 153 = ether-linked (syringyl (S) lignins)/tannins); 160–220 ppm = C=O C (172 = carboxyl/amide and 198 = ketone/aldehyde) [35].
2.2.4. Analytical pyrolysis
Analytical pyrolysis combined with gas chromatography and mass spectrometry (Py-GC/MS) is commonly used to analyze the molecular composition of soil HAs [19,20]. Py-GC/MS was conducted on a Pyr-ojector (SGE Analytical Science, Melbourne, Australia) connected to a GC/MS system Finnigan Trace GC Ultra with a Trace dual stage quad-rupole (DSQ) mass spectrometer (Thermo Finnigan LLC, Austin TX,
USA) fitted with a fused silica capillary non-polar general-purpose HP-1 wall-coated, silphenylene polysiloxane, 30 m × 250 μm i.d. × 0.25 μm film thickness (Quadrex Corp., Woodbridge, CT, USA). Approximately 1 mg sample in a quartz capillary tube was introduced into a preheated furnace at 500 °C. Helium was used as carrier gas (constant flow was adjusted to 1 cm3· min−1). The total chromatographic time was 60 min.
The GC oven was heated to 50 °C for 1 min, then increased up to 100 °C at 30 °C min−1, from 100 to 300 °C at 10 °C min−1and was isothermal
at 320 °C.
The identification and relative quantitation of pyrolysis products were carried out by: i) selected traces in ion chromatograms for the major compound series (e.g., aliphatic series, alkylaromatics), ii) comparison with own laboratory databases of chromatographic com-pounds (i.e., MS, retention time (RT), literature references, etc.), with
Table 5
Pyrolysis products1of soil HAs from volcanic regions on Tenerife Island (Spain).
No. Compound Diagnostic ion (m/z) Origin2 Z1 Z2 Z3 Z4 Z5 Z6 Z7
1 Methylpropanal (Mpro) 72 m ■ ■ ■ ■ ■ ■ ■
2 Acetic acid 60 Ps ■ ■ ■ ■ ■ ■ ■
3 Methylfuran (Mf) 82 Ps ■ ■ ■ □ □ □ □
4 C5-Aldehyde (I)3(C5-Al) 58 Ps ■ ■ ■ ■ ■ ■ ■
5 C5-Aldehyde (II) (C5-Al) 58 Ps ■ ■ ■ ■ ■ ■ ■
6 Benzene (Ben) 78 Be ■ □ ■ □ □ □ □
7 Butanal (Bu) 72 Ps ■ □ □ □ □ □ –
8 C6-Aldehyde (C6-Al) 100 Ps ■ ■ □ □ ■ ■ ■
9 Pyrrole (Py) 67 N ■ ■ ■ ■ ■ ■ ■
10 Pyridine (Pr) 67 / 79 N ■ ■ □ ■ ■ ■ □
11 Toluene (C1-alkylbenzene) (To) 91 / 92 Be ■ ■ ■ ■ ■ ■ ■
12 Furanone (Fu) 84 Ps ■ ■ □ ■ ■ ■ □
13 Furaldehyde (Fd) 96 Ps ■ ■ □ ■ ■ □ ■
14 Methylpyrrole (I) (Mpy) 80 / 81 N □ □ □ □ □ □ □
15 Methylpyrrole (II) (Mpy) 80 / 81 N □ □ □ □ □ □ □
16 Alkene C6 55 AL – □ – – □ – □
17 Fatty acid C6 116 Lp – □ – □ □ □ –
18 Xylene (C2-alkylbenzene) (Xy) 91 / 106 Be ■ □ ■ ■ ■ □ –
19 Styrene (vinylbenzene) (St) 91 / 104 Be □ – – □ □ □ □
20 Trimethylpyrazine 42 / 122 N – – – – – – –
21 Methylfuraldehyde (Mfd) 110 Ps ■ □ ■ □ ■ □ ■
22 C3-Alkylbenzene (I) (C3Be) 105 / 120 Be – – – – – – –
23 Pyrroledione 97 N – – – – – – –
24 Dihydrodihydroxymethylpyranone 144 Ps – – – – – – –
25 Hydroxydihydropyranone 114 Ps – – – – – – –
26 Phenol (Ph) 94 Ph ■ ■ ■ ■ ■ ■ ■
27 Pyrrole-2-carboxaldehyde (Pyc) 95 / 66 N ■ □ – □ □ □ –
28 2-Hydroxymethylcyclopentenone 112 Ps – – – – – – –
29 Methylcyclopentanone (Mc) 67 / 109 Ps – – – – – – –
30 Fatty acid C7 130 Lp – – – – – – –
31 C3-Alkylbenzene (II) (C3Be) 120 Be □ – – □ – – –
32 Acetophenone 120 / 77 Ar – – – – – – –
33 C4-Alkylbenzene (C4Be) 91 / 134 Be – ■ □ – – – –
34 Methylphenol (cresol I) (C1-Ph) 108 Ph □ – □ □ – □ –
35 Propanonetetrahydrofuran 85 / 128 Ps □ – – □ – – –
36 Guaiacol (G) 109 / 124 Lg ■ ■ □ ■ ■ ■ ■
37 Methylphenol (II) (C1-Ph) 108 Ph □ ■ □ □ □ □ □
38 Pyrrolidinedione (Pyr) 56 / 99 N ■ □ – ■ □ □ –
39 Methylindane (C1-In) 117 / 132 Ar – □ – □ – – –
40 Methylphenol (III) (C1-Ph) 108 Ph – – – – – – –
41 Benzeneacetonitrile (Bz) 117 m – □ – □ – – –
42 Alkene C8 55 AL □ – – – – – –
43 Alkane C8 71 AL ■ □ – ■ □ □ –
44 C2-Alkylphenol (I) 107 / 122 Ph □ – □ □ – □ □
45 C2-Alkylphenol (II) 107 / 123 Ph – – □ – – □ –
46 Naphthalene (Na) 128 p-Ar – – – – – – –
47 Methylacetophenone 91 / 134 m – – – ■ – □ –
48 Methylguaiacol (MG) 123 / 138 Lg □ ■ – □ □ □ ■
49 Fatty acid C8 144 Lp – – – – – – –
50 Benzothiazole (Bt) 135 p-Ar – – ■ □ ■ □ –
51 Alkene C9(I) 55 AL – – – □ □ – –
52 Vinylphenol (VF) 105 / 120 Lg – □ – – – □ ■
53 Alkane C9(I) 71 AL □ – – □ □ – –
54 Alkene C9(II) 55 AL □ – – □ – – –
55 Alkane C9(II) 71 AL – – – – □ – –
56 Ethylguaiacol (EG) 137 / 152 Lg □ ■ – – □ □ ■
57 C1-Naphthalene (C1Na) 142 p-Ar – – – – – – –
58 Vinylguaicol (VG) 135 / 150 Lg □ ■ – □ □ ■ ■
59 C3-Alkylphenol 121/136 Ph – – – – – – –
60 Alkene C10 55 AL – – – – □ – –
61 Alkane C10 71 AL □ □ – □ □ □ □
62 Syringol (S) 139 / 154 Lg □ ■ – – □ □ ■
63 Allylguaiacol, eugenol (E) 164 Lg – □ – – – – –
64 Methylindole 130 / 131 N – – – – – – –
65 Vanilline (V) 152 Lg – – – – – – –
66 Alkene C11 55 AL – – – – □ – –
67 C2-Naphthalene (C2Na) 141 / 156 p-Ar □ – – – – – –
68 Alkane C11 71 AL □ □ □ □ □ □ –
69 Methylsyringol (MS) 153 / 168 Lg – – – – – – □
70 Propenylguaiacol (PG) 149 / 164 Lg – □ – – – – □
71 Acetoguaiacone (AG) 151 / 166 Lg – ■ – – □ □ □
72 Alkene C12(I) 55 AL – – – – – – –
73 Alkane C12(I) 71 AL □ – – – □ – –
74 Guaiacylacetone 137 / 180 Ps – – – – – – –
data of commercial standards or preparations of plant and microbial biomacromolecules (e.g., lignin, suberins, polysaccharides, etc.) and iii) from automatic library searching in the NIST and Wiley libraries.
The peak areas (as total area counts) of the different chromatographic peaks were integrated and calculated as total abundances. Up to 130 different compounds were identified in the pyrograms. The main com-pound families were calculated as percentages of the total peak area on the chromatogram and grouped into given classes reflecting their origin (Lg: lignin, Ps: polysaccharides, N: N-compounds, AL: aliphatic compounds and Ar: unspecific aromatic compounds). The G/S ratio between lignin deri-vatives (G: guaiacyl units, S: syringyl units) and the Lg/Ph index between methoxyphenols vs. methoxyl-lacking phenols were calculated as in-dicators of the extent to which plant biomacromolecules are transformed into humic-type fractions in the soil [22,23].
2.2.5. Statistical treatments
Exploratory analyses were carried out for checking the normal dis-tribution of the datasets. The least significant difference (LSD) for P -value < 0.05 among different sampling zones was determined by ANOVA for normal datasets and Kruskal-Wallis test for non-normal datasets.
Principal Component Analysis was carried out using different sets of variables: i) 57 individual pyrolytic products and ii) five families of pyrolytic compounds, together with soil diagnostic properties, in order
to compare the potential of the pyrolysis products in establishing the differences among the soils. Statistica v.7 software was used for sta-tistical analyses.
2.2.6. Graphical representation of the pyrolysis results
An upgraded approach based on the Van Krevelen diagram was used to represent the yields of the pyrolytic products, defined by their atomic H/C and O/C ratios [36]. The resulting plots illustrate different SOM structural domains (carbohydrate- and lignin-derived, condensed lipid, etc.). This approach which is commonly used in ion cyclotron resonance mass spectrometry allows for complicated assemblages of compounds to be simplified and easily visualized [37]. For this purpose, the atomic H/C and O/C ratios of the pyrolysis products were plotted in the basal plane, whereas the values in the third dimension were calculated as a function of both the abundance and number of compounds. The result may be shown either as 2D plots (contour diagram) or 3D surface plots consisting of overlapped broad peaks corresponding to clusters of compounds with similar atomic ratios [38].
The "surface density plot" is actually the representation of a data matrix (e.g., 30 × 30) consisting of cells with values proportional to the number and amount of the compounds in discrete H/C and O/C ranges, after applying moving average smoothing within neighboring cells. Consequently, the values in the so-defined “H/C” and “O/C” axes are
Table 5(continued)
No. Compound Diagnostic ion (m/z) Origin2 Z1 Z2 Z3 Z4 Z5 Z6 Z7
75 Alkene C12(II) 55 AL – – – – □ – –
76 Ethylsyringol (ES) 167 / 182 Lg – – – – – – □
77 Alkane C12(II) 71 AL – □ □ – – – □
78 C3-Naphthalene (I) (C3Na) 155 / 170 p-Ar – – – – – – –
79 Vinylsyringol (VS) 165 / 180 Lg – – – – – – □
80 Fatty acid C12 200 Lp – – – – – – –
81 C3-Naphthalene (II) (C3Na) 155 / 170 p-Ar □ – – – – – –
82 Alkene C13 55 AL – – □ – □ – –
83 Alkane C13 71 AL □ – – □ □ – –
84 Fatty acid C13 214 Lp – – – – – – –
85 C4-Naphthalene (I) (C4Na) 184 p-Ar □ – – – – – –
86 Alkene C14 55 AL – – – □ □ – –
87 Alkene C14 55 AL – – – ■ – – ■
88 Alkane C14 71 AL □ – □ □ □ – –
89 C4-Naphthalene (II) (C4Na) 184 p-Ar – – – – – – –
90 Alkane C14 71 AL – – – – – – –
91 Fatty acid C14:1 226 Lp – ■ – – ■ – –
92 Fatty acid C14(I) 228 Lp – – – – – – –
93 Fatty acid C14(II) 228 Lp □ – – ■ ■ □ –
94 Propenylsyringol (PS) 194 Lg – – – – – – □
95 Acetosyringone (AS) 196 Lg – – – – – – □
96 C5-Naphthalene (II) (C5Na) 198 p-Ar □ – – – – – –
97 Alkene C15(I) 55 AL – – – □ □ – –
98 Alkene C15(II) 55 AL – – – – – – –
99 Alkane C15(I) 71 AL □ – – □ □ – –
100 Alkane C15(II) 71 AL □ – – □ – – –
101 Fatty acid C15(I) 242 Lp – – ■ – – – □
102 Fatty acid C15(II) 242 Lp – – – – – – –
103 Alkene C16 55 AL – – – ■ – – –
104 Alkane C16 71 AL □ □ – – □ – –
105 Fatty acid C16 256 Lp ■ ■ ■ ■ ■ □ ■
106 Alkene C17 55 / 69 AL – – – – – – –
107 Alkane C17 71 AL – – – – ■ – –
108 Fatty acid C17(anteiso-) 270 Lp – – – – – – –
109 Fatty acid C17(iso-) 270 Lp – – – – – – –
110 Fatty acid C17 270 Lp – – – – – – –
111 Alkene C18 55 AL – – – – – – –
112 Alkane C18 71 AL – – – – – – –
113 Fatty acid C18:1 282 Lp – – – – – – –
114 Fatty acid C18 284 Lp – – – – – – –
1Calculated as percentage of total ion chromatographic area. Total abundance referring to total volatile compounds, excluding acetic acid: - = 0%;
□= 0–2%;■
= > 2%. Average values of pyrochromatograms from the different zones (Z1–Z7) indicated inTable 1.
2Ps: polysaccharides, N: N-containing, Ph: alkylphenols (methoxyl-lacking), Be: alkylbenzenes, p-Ar: polycyclic compounds, m: miscellaneous origin, AL: aliphatic
hydrocarbons (alkanes, alkenes), Lp: fatty acids and Lg: lignin (G: guaiacyl units, S: syringyl units).
not continuous variables as in the original Van Krevelen diagram dis-playing the scores of the molecules. The axes have discrete values, and should be understood as "H/C and O/C ranges" because the information (abundance and frequency of compounds in the cells of the original data matrix) has extended from the original dimensionless points to an enveloping surface.
A typical advantage of using Van Krevelen plots is the possibility to infer biogeochemical processes that may be involved in the
transformation of the SOM, viz: dehydration, aromatization, deal-kylation, decarboxylation, etc., that are reflected by the abundance of compound groups in specific regions of the atomic H/C vs O/C plane. In order to compare the 24 samples, the data represented as surface density plots were not drawn for individual samples, but for average pyrochromatograms consisting of: i) the vectors with the average of the abundances of the 114 pyrolysis compounds from the 24 soil samples, subsequently normalized as total abundances (sum = 100), ii) the normalized vectors with the average values from the pyrochromato-grams of different groups of samples sharing similar molecular com-position as suggested by a previous PCA and, iii) surfaces obtained by subtracting each of the above average vectors of the general average from the 24 samples in order to reveal the diagnostic features of each group of samples, i.e. the compounds that predominate as regards those that are in low proportions in the different soil groups.
3. Results
3.1. Soil diagnostic properties and soil organic matter
In general, the studied soils showed a low bulk density and a loam, clay loam or sandy loam textural type (Table 2). The average value of soil organic C is around 26 g kg−1(Table 2), although increasing up to 51 g kg -1in Andosols (Z1). Low organic C levels (average value of 13 g kg−1) was
found in soils under intensive agricultural practices Z4 and Z5. On the other hand, the rate of soil C potentially released to atmosphere as CO2,
i.e. TMC, showed large variability, the daily losses ranging from 44 mg kg−1in Andosols to 129 mg kg−1in Anthrosols formed on pumice.
It was observed that some soils (Z2 soil group) showed extreme acidity (average pH 4.4), a moderate amount of soil organic C (33 g kg−1) and low base saturation, which coincide with the large Al
p/
Aloratio. In Anthrosols on pumice substrate transported by farmers (Z5)
a comparatively higher pH and base saturation were observed. Analytical indices providing information on the presence of amor-phous materials suggested a predominance of allophane, measured as
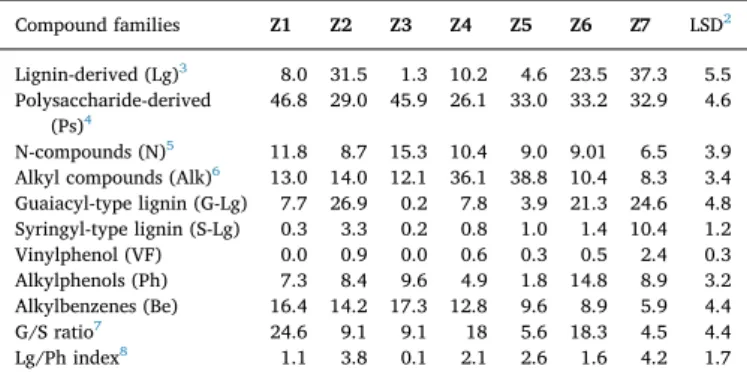
Table 6
Total abundances1of the pyrolytic products classified by compound families of
soil-HAs from agricultural soils.
Compound families Z1 Z2 Z3 Z4 Z5 Z6 Z7 LSD2
Lignin-derived (Lg)3 8.0 31.5 1.3 10.2 4.6 23.5 37.3 5.5
Polysaccharide-derived (Ps)4
46.8 29.0 45.9 26.1 33.0 33.2 32.9 4.6
N-compounds (N)5 11.8 8.7 15.3 10.4 9.0 9.01 6.5 3.9
Alkyl compounds (Alk)6 13.0 14.0 12.1 36.1 38.8 10.4 8.3 3.4
Guaiacyl-type lignin (G-Lg) 7.7 26.9 0.2 7.8 3.9 21.3 24.6 4.8 Syringyl-type lignin (S-Lg) 0.3 3.3 0.2 0.8 1.0 1.4 10.4 1.2
Vinylphenol (VF) 0.0 0.9 0.0 0.6 0.3 0.5 2.4 0.3
Alkylphenols (Ph) 7.3 8.4 9.6 4.9 1.8 14.8 8.9 3.2
Alkylbenzenes (Be) 16.4 14.2 17.3 12.8 9.6 8.9 5.9 4.4
G/S ratio7 24.6 9.1 9.1 18 5.6 18.3 4.5 4.4
Lg/Ph index8 1.1 3.8 0.1 2.1 2.6 1.6 4.2 1.7
1Average values of percentages of total ion chromatographic area in
pyr-ochromatograms from the different zones (Z1–Z7) indicated inTable 1.
2LSD = least significant difference between field plots,P< 0.05.
3Lignin-derived compounds: guaiacols, syringols, vinylphenol.
4Polysaccharide-derived compounds: furan, furanones, furaldehydes,
cy-clopentenones, etc.
5N-compounds: pyrroles, indoles, pyridines, etc.
6Alkyl compounds:n-alkanes, alkenes and fatty acids.
7Guaiacyl vs. syringyl index.
8Methoxyphenols (lignin derivatives: G-Lg + S-Lg) vs. methoxyl-lacking
phenols.
Fig. 3.Biplot corresponding to the principal component analysis using 57 pyrolytic compounds from soil HAs (PC1 vs. PC2 explaining 38% of the total variance): soil
Alo+ ½ Feoand high P retention in Andosols (Z1). On the other hand,
Anthrosols with a pumice cover (Z6 and Z7) showed a low P retention. The Alp/Aloratio (> 0.5) pointed to the presence of Al-humus
com-plexes, as in the case of acid soils (Z2). The X-ray diffraction confirmed that most clay-sized minerals consisted of short-range amorphous oxides with only some crystalline clay minerals 1:1, i.e., kaolinite or illite, in highly disturbed soils (Z3–Z5).
The average results of SOM fractionation in 24 soil samples grouped by zones showed a low content of FOM in all soils (0.48 g C kg−1soil) (Table 3) except in andic soils (Z1; 0.87 g C kg−1soil)
and some soils formed on pumice (Z7) where a high content of FOM was observed (up to 0.78 g C kg−1soil). By contrast, a high content
of non-extractable humin (30–50% of organic C) was observed in all of the studied volcanic ash soils. Between different SOM fractions, a high concentration (40 g C·100 soil C−1) of HA was observed in
Anthrosols highly disturbed (Z4 and Z5) whereas a low HA/FA ratio was observed in vitric soils (Z6 and Z7), with weak organomineral interactions.
3.2. Spectroscopic characteristics of the HAs
The optical density values of the soil-HAs at 465 nm (E4), con-sidered as a surrogate of aromaticity [39] showed comparatively high values (up to 1.5 AU) in Andosols (Z1) and soils receiving inputs of charred materials (Z3) (Table 4). Otherwise, very low values of optical density (0.5 AU) were found in some HAs from the soil group developed from pumice (Z7). In most HAs, the second derivative visible spectra displayed the marked valleys at 570 and 620 nm classically attributed to fungal pigments [33]. The intensity of these valleys was found to be significantly correlated with the optical density (r= 0.61,n= 30,P< 0.01). The highest concentration of fungal pigments was found in An-dosols (Z1), which contrasted with soils receiving inputs of fireplace wastes as soil amendment (Z3), where the very dark color in soil HAs is compatible with a pyrogenic origin [12]. On the other hand, very low concentration of fungal pigments was a characteristic of soils developed from pumices, mainly in zone Z7.
Fig. 1shows the13C NMR of HAs from soils representative of the
different zones, whereasTable 4shows the average integration values of the spectra from each zone. The spectra showed the typical signals for alkyl C (0–46 ppm), O-alkyl C (46–110 ppm), aromatic C (110–160 ppm) and carboxyl C (160–200 ppm) [35]. Some soils under pumice substrate (Z7) show a high contribution of aliphatics (33 ppm) along with methoxyl/α-amino C (56 ppm) and carboxyl groups (172 ppm) and to a lesser extent to aromatic C (broad signal around 130 ppm) compatible with selectively preserved lignins or its transfor-mation products. The low intensity of the 147 and 153 ppm suggests that the 56 ppm peak cannot be only assigned to methoxyl groups from lignin and the 103 ppm (anomeric C) points to the preservation of fresh material in these samples. This description is valid for the HA spectra from zone Z6, although in this case the signals suggesting lig-nocellulosic materials are not so evident, and the spectra show com-paratively more intense signals for aromatic and carboxyl groups, compatible with more advanced humification stages.
In any case, soils of zones Z6 and Z7 display comparatively intense signals for heterosubstituted aromatic C, compared to signals for un-substituted aromatic C. This is reflected more clearly in the ratio be-tween their corresponding intensities (Table 4) which seemingly could be used as an indicator of the proportion of the total aromatic C that has an origin from lignin-type precursors.
A major signal (30% of total signal intensity) in theO-alkyl C region (46–110 ppm) with a maximum at ca. 73 ppm was observed in soils without amorphous gels (Z4), as in the soils developed on pumice (Z7). This was also found in the case of transported soils (Z5). However, as compared to the former, these have a much higher contribution of the carboxyl groups on HAs, and they included the only spectra showing some small signal attributable to ketones at ca. 211 ppm. Both HAs from Andosols (Z1, Z2) showed a major 129 ppm signal for unsubstituted aromatic C, although HAs from Z2 have some aspects in common with those from zone Z7, namely the signal intensity in the O-alkyl and heterosubstituted aromatic region, which is actually compatible with a more expressive presence of lignocellulosic precursors. On the other hand, HAs from zone Z3 displayed the most intense aromatic-C signal
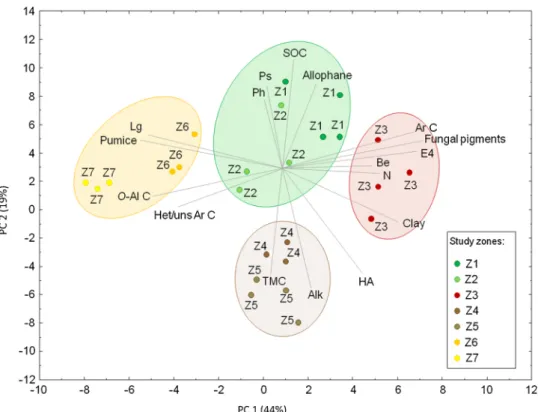
Fig. 4.Biplot corresponding to the principal component analysis using families of pyrolytic compounds (Table 6, column “Compound families”) and soil chemical
peaking at 131 ppm (up to 46% of total signal intensity, even assuming possible underestimation of aromatics in all the spectra, as suggested by some overlapping with the O-alkyl signals in the 110 ppm limit). Moreover, they also had relatively small amounts of methoxyl C from lignins and signals in the alkyl andO-alkyl C13C NMR regions are
al-most absent, which is consistent with the fact that these soils had re-ceived charred organic inputs in the recent past.
3.3. Analytical pyrolysis
Differences in the pyrochromatographic patterns are evident inFig. 2, showing pyrograms of HAs representative for zones under different geo-logical substrate and management practices.Table 2shows the 114 major compounds with an indication of the possible precursor compounds, and its relative abundance coded with symbols indicating the levels of the semiquantitative percentages related to the total chromatographic area.
The main aromatic series consisted of alkylbenzenes, alkyl-naphthalenes, methoxyphenols and alkylphenols. In particular
methoxyphenols, typical pyrolysis products from lignin, included both guaiacyl (G)-lignin units (guaiacol and its methyl-, ethyl-, vinyl-, propenyl- and aceto- derivatives) and their corresponding syringyl (S) counterparts, in addition to vinylphenol (from grass lignins) [22,23]. Other aromatic compounds were methoxyl-lacking (alkylbenzenes, alkylphenols and alkylnaphthalenes), more characteristic of HAs at higher maturation stages [19,20], including polycyclic aromatic hy-drocarbons being often indicative of a pyrogenic origin [22]. All the HAs released known carbohydrate-derived constituents (methylfuran, furanone, furaldehydes and cyclic ketones) in addition to N-con-taining compounds (pyrroles, pyridines and indoles) from protein. Finally, all HAs yielded substantial proportions of aliphatic com-pounds (consisting of n-alkanes,n-alkenes and alkanoic acids (fatty acids)). These aliphatic pyrolysis compounds are released from almost all types of environmental samples, although they may be major components in the case of HA-like substances almost exclusively formed from lignin-lacking precursors, such as the aquatic organisms or bacterial biomass [38].
Fig. 5.Surface density plots displaying cumulative abundances of soil-HA pyrolysis products represented in the space defined by their H/C and O/C atomic ratios.
Each surface plot corresponds to the average value of the compounds in the four groups of pyrograms as suggested byFig. 2, corresponding to different soil types,
Quantitative differences are evident in the pyrograms of the dif-ferent zones (Fig. 1andTable 6). The predominance of lignin pyrolysis products (37% of the total ion chromatographic area) was observed in soils developed on pumice (Z7), indicating high content of plant bio-macromolecules in these agroecosystems (Table 6). By contrast, the virtual lack of lignin-derived compounds (1.3% of total ion chromato-graphic area) and the dominance of methoxyl-lacking aromatic com-pounds (26.9% of total ion chromatographic area) were observed in soils affected by burnings (Z3). The lignin-derived phenols could be divided into guaiacyl (G-type) or syringyl (S-type) compounds, the corresponding ratio informs on the degree of lignin alteration [40]. Most of the different lignin-derived pyrolysis products, correspond to guaiacyl-type lignin (G-type): G {36}, MG {48}, EG {56}, VG {58}, E {63}, V {65}, PG {70} and AG {71} (Fig. 1, Table 5), with lower contributions of syringyl-type lignin (S-type): S {62}, MS {69}, ES {76}, VS {79}, and a small proportion of VF {52}.
The substantial yields of carbohydrate-derived pyrolysis products such as methylfuran: Mf {3}, furanone: Fu {12}, furaldehyde: Fd {13}, Mfd {21} or cyclic ketones: Mc {29} (Table 5) is compatible with the presence of polysaccharides from microbial biomass as reported in other volcanic soils [15,16]. In fact, the substantial amounts of poly-saccharides (46.8% of total ion chromatographic area) and N-con-taining compounds (11.8%) in Andosols (Z1) was found in these soils developed on amorphous oxides, resulting in strong bonds between
SOM and mineral phases [10], which has been considered to justify the low SOM mineralization rates in the presence of aluminum hydroxides [20,21].
In general, N-containing moieties consisted mainly of heterocyclic aromatic compounds, such as pyrrole: Py {9}, methylpyrroles: Mpy {14–15}, pyrroledione {23}, pyridines: Pr {10}, benzeneacetonitrile: Bz {41} or indoles: In {39}. Some pyrolysis compounds derived from chitin, such as pyrrole-2-carboxaldehyde: Pyc {27} were also found (Table 5). A high proportion of N compounds (12% of total ion chro-matographic area) was found in Andosols (Z1). Some of these pyrolysis products could derive from amino acids and peptides from microbial sources [41], although some researchers have pointed out that many heterocyclic aromatic N-compounds could be formed in the soil from secondary reactions, such as those induced by fires [42].
A series of aromatic compounds that are unspecific in terms of their sources, such as phenol: Ph {26} and alkylphenols: C1-Ph {34, 37, 40},
C2-Ph {44, 45}, C3-Ph {59} were also frequent pyrolysis products [22],
also including benzene: Ben {6} and alkylbenzenes: Xy {18}, To {11}, St {19}, C3Be {22, 31}, C4Be {33} (Table 5). The occurrence of
poly-cyclic aromatic hydrocarbons, namely naphthalene: Na {46} and al-kylnaphthalenes: C1Na {57}, C2Na {67}, C3Na {78, 81}, C4Na {85, 89},
C5Na {96}, is compatible with inputs of charred material in the
corre-sponding soils. This is reinforced by the fact that N-substituted benzene: Bz {41} is the main pyrolysis product from severely charred biomass
Fig. 6.Surface density plots obtained by subtracting the average abundances from pyrolytic compounds, minus the average values in each one of the four soil groups.
[42]. The high proportion of alkylbenzenes was typical in most studied soils except in those on pumice, where methoxyphenols dominated.
When the abundance of lignin-derived compounds is compared with that of methoxyl-lacking phenols, i.e. Lg/Ph ratio (Table 6), it can be observed that the only soils in which methoxyphenols are not major compounds (Lg/Ph < 1) are those having received charcoal inputs in the past (Z3). Soils with Lg/Ph > 1 may indicate either inputs of plant debris, as a consequence of cropping, or a slow biodegradation of lignin.
Finally, the abundance of aliphatic compounds (alkanes, alkenes and fatty acids), which is compatible with microbial biomass in the
SOM of soils with high biological activity [18,43] was frequent in pyrograms of HAs from highly disturbed soils (Z4, Z5).
3.4. Multivariate analyses
The application of PCA based on the 57 major and most frequent pyrolytic products (Table 5, in bold) led to a first component (PC 1) that is defined by high loadings of aliphatic products and, on the opposite side, of lignin derivatives (Fig. 3). Considering the absolute values of the eigenvectors, the most relevant variables were the C9to C14olefins,
whereas the compounds contributing to higher extent to the variability
Fig. 7.Conceptual model of SOM transformation in the different groups of cultivated Anthrosols in Tenerife Island: a) process 1: progressive alteration of
plant-inherited biomacromolecules from vascular plants (mainly lignin), b) process 2: accumulation of pyrogenic C, c) process 3: accumulation of polysaccharides and protein in soils with high water holding potential, and d) process 4: accumulation of aliphatic C in the soils with highest microbial activity. Grey boxes illustrate influences of different agricultural practices in these processes. Contour diagrams illustrate the difference between the abundances of pyrolysis compounds in the
average pyrogram, minus the average values for the pyrograms from each of the four soil groups suggested byFig. 2, represented in the space defined by their H/C
and O/C atomic ratios: positive values are shown in green colors and negative values are shown in red colors. (For interpretation of the references to colour in this
of this first component were methoxyphenols, mainly S, VS, VF and VG as well as C6-Al and Ph. On the other hand, the second component (PC
2) reflects the variability associated to the different proportions of alkyl-aromatics and N-containing compounds. High loadings corre-sponded to furaldehyde (Fd), pyrrolecarboxaldehyde (Pyc) and benzene (Ben), whereas in the negative side of the second axis the major ei-genvectors corresponded to guaiacols and dimethylphenol (C2-Ph).
In the space defined by the two first PCs, the scores for the 24 soil samples are distributed in different regions in function of the yields of different pyrolysis products. The resulting pattern was defined by a series of clusters which are shown encircled in Fig. 3, consisting of groups of soils which share common characteristics indicated by the length of the eigenvectors in the factorial space.
A first group in the area of major influence of eigenvalues for methoxyphenols is observed (Z7–Z6). A second group is defined by the high loadings of a series of unspecific, unsubstituted aromatic com-pounds and heterocyclic aromatic N-comcom-pounds (Z3). A third group (Z4–Z5) is defined by aliphatic compounds and N-containing products. Finally, a fourth group (Z1–Z2) shows an intermediate composition between the three previous groups. When the PCA is carried out using as variables the main families of pyrolytic compounds (Table 5, footnote) in addition to the general soil and HA analytical variables reported in Tables 2–6, it is possible to recognize mainly the corre-spondence between the information supplied by the spectroscopic techniques and the other analytical approaches (Fig. 4; up to 63% total variance explained). It can be observed as the eigenvector for SOC points to similar direction that those corresponding to the con-centration of amorphous gels (Alo + ½ Feo) considered as active
binding agents in soil microaggregates (Z1–Z2), which coincides with the accumulation of HAs with the highest proportion of poly-saccharides (Ps). On the other hand, the variable suggesting high microbial activity leading to SOM biodegradation, i.e. TMC, lies in the plane in a region (Z4–Z5) that is far from variables indicating ar-omaticity (Ar C, E4…) and close to alkyl compounds (Alk). In fact, in volcanic soils, SOM recalcitrance depends to a large extent on the protective function of the mineral fraction, which controls the acces-sibility of microorganisms to organic matter [20], and Fig. 4 also shows the opposite direction of the eigenvector for TMC with respect to those for SOC and allophanes.
A group of HAs is observed in the region of the factorial space (zone Z3) that suggests high loadings of variables pointing to a high total aromaticity (Ar C), especially in the form of non-methoxylated alkyl-benzenes (Be) or polycyclic structures (fungal pigments). On the other side, high loadings for methoxyphenols (Lg), forO-alkyl C forms, and for the aromatic structures expected from the presence of lignin (Het/ uns Ar C) is compatible with a major contribution of organic matter from vascular plants [19], and coincides with soils developed on pu-mice (Z6–Z7). As a whole, the pattern defined by the HA scores shown inFig. 4is in agreement with that suggested by the previous PCA using exclusively the data at the molecular level, which suggests that the corresponding HA groups may reflect their origin.
4. Discussion
4.1. Comparison of pyrolytic signatures
Although the resistance of lignin and other plant biomacromole-cules to microbial degradation has probably been overemphasized in classical studies within the body of literature that are mainly based on the pioneer studies on humification processes in peat soils [44], further research has shown that enzymatic degradation of lignin in organo-mineral soils may occur in a relatively short period [45]. In particular in highly disturbed agricultural soils (Z4–Z5) lignin markers were in low proportions and the most characteristic pyrolytic compounds were mainly aliphatic in nature, as it was confirmed by the high signal in-tensity in theO-alkyl13C NMR region.
This scenario is different from that of soils with pyrograms with characteristically high yields of methoxyphenols developed under pu-mice (Z6 and Z7), a sandy mineral substrate lacking of colloidal prop-erties, favoring SOM biodegradation, where there is no choice for progressive transformation of lignin into HAs [8,9]. In fact, high amounts of vinylphenol reflected the contribution of fresh non-woody tissues in these soils on pumice substrate (Z7). Apart from the lowest proportions of aliphatic pyrolytic compounds, the HAs from these zones could be considered to display a predominantly lignin-like pyrolytic signature. This is confirmed by13C NMR, which indicates the highest
proportion of heterosubstituted aromatic C (147 and 153 ppm signals from lignins) in soils on pumice substrate.
The abundance of G-type lignin units in all HAs, showed the major origin of the SOM from vine biomass during the last 30 years (Z2). Considering that the current crop is the same in all of the studied soils (vineyards), the high values of the G/S ratio in the case of Andosols (Z1) points to intense microbial reworking of plant debris in these volcanic ash soils [6]. These Andosols with non-crystalline minerals (Z1–Z2) showed pyrograms with a substantial proportion of methoxyl-lacking aromatic units, as well as N-containing and carbohydrate-derived compounds that could be stabilized in organomineral complexes [19]. Some studies have pointed out that these characteristics may be asso-ciated to specific amorphous minerals, responsible for high water holding capacity even at the wilting point [14,18] providing “crypto-hydromorphic” conditions suitable for the selective preservation of lipid, carbohydrate and protein [20].
When Andosols are subjected to intensive crop production, dehy-dration of allophane materials may occur [11] which have been asso-ciated to decreased SOM levels [19,21]. Nevertheless, additional fea-tures such as the accumulation of polycyclic aromatic compounds should not be ruled out [3]. This would be an effect of the endothermic condensation of reactive organic precursors into recalcitrant C forms, such as black C, which takes place in soils affected by fires [37]. Not surprisingly, such processes were classically invoked in Japanese vol-canic ash soils subjected to periodic burning [13]. In consequence, the HAs accumulated in that zone (Z3) could be considered to display a comparatively marked “pyrogenic signature”.
In order to compare common features among the soil groups sug-gested by the above-mentioned PCA, 3D Van Krevelen diagrams were built up from average values of pyrolytic products that were calculated for the four groups which share similar pyrolytic patterns.Fig. 5 illus-trates these situations, viz.: a) average surface from soils with amor-phous gels (pyrograms from Z1–Z2), b) average surface from soils de-veloped on pumice substrate (Z6–Z7); c) average surface from soils affected by fires (Z3); and e) average surface from highly disturbed soils (Z4–Z5).
Finally, the pyrolysis results that provide information on the SOM chemical composition are summarized inFig. 7as subtracted contour diagrams (group averages – total average) of pyrolytic molecular as-semblages, which are ascribed to at least four ideal HA compositional models in the soils under study:
1) Group 1: Trend to preservationof plant biomacromolecules (mainly lignins). In these soils (Z6 and Z7,Fig. 2) the contour diagram il-lustrates prevalence of G- and S-type lignin derivatives as regards unsubstituted aromatic or aliphatic compounds. These soils on pu-mice showed SOM with low maturity, formed mainly through ac-cumulation of particulate organic fractions [20]. The lack of stabi-lizing oxides makes necessary the periodic application of organic amendments to maintain suitable SOM levels.
2) Group 2: Remarkable presence of pyrogenic C-forms. The pyrolytic signature of these soils (Z3) points to a severe depletion of lignin and polysaccharides, and the concomitant condensation and accumula-tion of aromatic compounds. Assuming that the high aromaticity of the SOM (> 25% aromatic compounds after analytical pyrolysis) could not be exclusively justified by extensive selective biode-gradation processes of biogenic SOM (i.e., microbial processes), this would lead to infer significant inputs of other types of aromatic constituents to the SOM as pyrogenic C, compatible with the intense signal for unsubstituted aromatic C much higher than for hetero-substituted aromatic C (Table 4), as reported in soils affected by fires [45].
3) Group 3:Predominance of polysaccharides and protein. The contour diagram indicates the presence of easily degradable macromolecules (Z1 and Z2) in HAs formed in Andosols where the amorphous mi-neralogy determines pore size and arrangement patterns that sharply constrain soil water flux [6,19] and, on the other hand, aliphatic SOM is stabilized via effective organomineral interactions [18].
4) Group 4:Predominance of aliphatic compounds on lignin markers.In these soils (Z4 and Z5) the subtracted contour diagram suggests the extensive demethoxylation and progressive cross linking of altered lignins, whereas the NMR spectra show intense signals for hetero-substituted aromatic C, compatible with microbial action enhanced by soil agricultural management. In these soils, the practical lack of amorphous gels could increase the SOM susceptibility to biode-gradation, resulting in high TMC values, as has been previously suggested [10,24].
5. Conclusions
The different pyrolytic and13C NMR patterns found in HAs from the
volcanic soils under study were to a large extent associated to strong organomineral interactions between SOM and amorphous oxides, but also to the active biogeochemical control associated to agriculture practices, including periodic inputs of volcanic materials (tuff, ash, pumice), manure and charcoal.
In order to explain the variability in the chemical composition of SOM, up to four prevailing humification pathways were considered as the most relevant, viz.: a) predominance of lignin-derived macro-molecules in soils on pumice substrate, b) accumulation of condensed aromatic domains including pyrogenic C structures, c) predominance of carbohydrate and N-containing compounds in soils with amorphous minerals favoring the retention of water and SOM aliphatic compounds and d) predominance of long-chain aliphatic structures in soils with cultivation-enhanced microbial activity. As a whole, the humification processes could be summarized as two main trends, either the selective preservation of plant biomacromolecules, or the microbial and abiotic transformation of HA precursors in biogeochemically active agri-cultural soils.
Acknowledgements
This research has been funded by the Spanish CICyT under grant CGL2013-43845-P. The authors wish to thank to three anonymous re-ferees by their constructive comments that contributed to improving the final version of the paper.
References
[1] J.A. Baldock, P.N. Nelson, Soil organic matter, in: E. Sumner (Ed.), Handbook of Soil Science, CRC Press, Boca Ratón FL, 2000, pp. 25–84.
[2] M.H.B. Hayes, P. MacCarthy, R.L. Malcolm, R.S. Swift, Humic Substances, Second Part, Search of Structure, Wiley, New York, 1989.
[3] G. Almendros, Humic substances, in: W. Chesworth (Ed.), Encyclopedia of Soil Science, Springer, Dordretch, 2008, pp. 97–99.
[4] P. Sollins, P. Homann, B.A. Caldwell, Stabilization and destabilization of soil or-ganic matter: mechanisms and controls, Geoderma 74 (1996) 65–105,https://doi. org/10.1016/S0016-7061(96)00036-5.
[5] J. Six, R.T. Conant, E.A. Paul, K. Paustian, Stabilization mechanisms of soil organic matter: Implications for C-saturation of soils, Plant Soil 241 (2002) 155–176. [6] R. Kiem, I. Kögel-Knabner, Contribution of lignin and polysaccharides to the
re-fractory carbon pool in C-depleted arable soils, Soil Biol. Biochem. 35 (2003) 101–118,https://doi.org/10.1016/S0038-0717(02)00242-09.
[7] J.A. Baldock, J.O. Skjemstad, Role of the soil matrix and minerals in protecting natural organic materials against biological attack, Org. Geochem. 31 (2000) 697–710,https://doi.org/10.1016/S0146-6380(00)00049-8.
[8] J. Six, H. Bossuyt, S. Degryze, K. Denef, A history of research on the link between (micro)aggregates, soil biota, and soil organic matter dynamics, Soil Tillage Res. 79 (2004) 7–31,https://doi.org/10.1016/j.still.2004.03.008.
[9] J.M. Oades, A.G. Waters, Aggregate hierarchy in soils, Aus. J. Soil Res. 29 (1991) 815–828,https://doi.org/10.1071/SR9910815.
[10] J.P. Boudot, A. Bel Hadi Brahim, R. Steiman, F. Seigle-Murandi, Biodegradation of synthetic organo-metallic complexes of iron and aluminum with selected metal to carbon ratios, Soil Biol. Biochem. 21 (1989) 961–966,https://doi.org/10.1016/ 0038-0717(89)90088-6.
[11] R.A. Dahlgren, M. Saigusa, F.C. Ugolini, The nature, properties and management of volcanic soils, Adv. Agron. 82 (2004) 113–182, https://doi.org/10.1016/S0065-2113(03)82003-5.
[12] H. Shindo, Y. Matsui, T. Higashi, A possible source of humic acids in volcanic ash soils in Japan– charred residue ofMiscanthus sinensis, Soil Sci. 141 (1986) 84–87,
https://doi.org/10.1097/00010694-198601000-00013.
[13] H. Shindo, T. Honna, S. Yamamoto, H. Honma, Contribution of charred plant fragments to soil organic carbon in Japanese volcanic ash soils containing black humic acids, Org. Geochem. 35 (2004) 235–241,https://doi.org/10.1016/j. orggeochem.2003.11.001.
[14] K.G.J. Nierop, P.F. van Bergen, P. Buurman, B. van Lagen, NaOH and Na4P2O7
extractable organic matter in two allophanic volcanic ash soils of the Azores Islands– a pyrolysis-GC/MS study, Geoderma 127 (2005) 36–51,https://doi.org/ 10.1016/j.geoderma.2004.11.003.
[15] J.A. González-Pérez, C.D. Arbelo, F.J. Gónzalez-Vila, A. Rodríguez-Rodríguez, G. Almendros, C.M. Armas, O. Polvillo, Molecular features of organic matter in diagnostic horizons from Andosols as seen by analytical pyrolysis, J. Anal. Appl. Pyrolysis 80 (2007) 369–382,https://doi.org/10.1016/j.jaap.2007.04.008. [16] C. Rumpel, A. Rodríguez-Rodríguez, J.A. González-Pérez, C. Arbelo, A. Chabbi,
N. Nunan, F.J. González-Vila, Contrasting composition of free and mineral-bound organic matter in top- and subsoil horizons of Andosols, Biol. Fertil. Soils 48 (2012) 401–411,https://doi.org/10.1007/s00374-011-0635-4.
[17] T. Chevallier, T. Woignier, J. Toucet, E. Blanchart, Organic carbon stabilization in the fractal pore structure of Andosols, Geoderma 159 (2010) 182–188,https://doi. org/10.1016/j.geoderma.2010.07.010.
[18] P. Buurman, F. Peterse, G. Almendros, Soil organic matter chemistry in allophanic soils: a pyrolysis-GC/MS study of a Costa Rican Andosol catena, Eur. J. Soil Sci. 58 (2007) 1330–1347,https://doi.org/10.1111/j.1365-2389.2007.00925.x. [19] Z. Hernández, G. Almendros, P. Carral, A. Álvarez, H. Knicker, J.P. Pérez-Trujillo,
Influence of non-crystalline minerals in the total amount, resilience and molecular composition of the organic matter in volcanic ash soils (Tenerife Island, Spain), Eur. J. Soil Sci. 63 (2012) 603–615,https://doi.org/10.1111/j.1365-2389.2012. 01497.x.
[20] Z. Hernández, G. Almendros, Biogeochemical factors related with organic matter degradation and C storage in agricultural volcanic ash soils, Soil Biol. Biochem. 44 (2012) 130–142,https://doi.org/10.1016/j.soilbio.2011.08.009.
[21] J.R. Verde, M. Camps-Arbestain, F. Macías, Expression of andic properties in soils from Galicia (NW Spain) under forest and agricultural use, Eur. J. Soil Sci. 56 (2005) 53–63,https://doi.org/10.1111/j.1365-2389.2004.00651.x.
[22] S. Derenne, K. Quénéa, analytical pyrolysis as a tool to probe soil organic matter, J. Anal. Appl. Pyrolysis 111 (2015) 108–120,https://doi.org/10.1016/j.jaap.2014. 12.001.
[23] C. Saiz-Jiménez, J.W. De Leeuw, Lignin pyrolysis products: Their structures and their significance as biomarkers, Org. Geochem. 10 (1986) 869–876,https://doi. org/10.1016/S0146-6380(86)80024-9.
organo-mineral complexes in an Andosol from Reunion Island, J. Anal. Appl. Pyrolysis 99 (2013) 92–100,https://doi.org/10.1016/j.jaap.2012.10.020. [25] S. Rivas-Martínez, W. Wildpret, T.E. Díaz, P.L. Pérez de Paz, M. del Arco,
O. Rodríguez, Excursion guide. Outline vegetation of Tenerife Island (Canary Islands), Itinera Geobotanica 75 (1993) 5–168.
[26] L.C. Blakemore, P.L. Searle, B.K. Daly, Methods for Chemical Analysis of Soil, New Zealand Soil Bureau Scientific Report 80, Lower Hutt, New Zealand, 1987. [27] G.J. Bouyoucos, Hydrometer method improved for making particle size analysis of
soils, Agron. J. 54 (1962) 464–465,https://doi.org/10.2134/agronj1962. 00021962005400050028x.
[28] D.W. Nelson, L.E. Sommers, Total carbon, organic carbon and organic matter, in: A.L. Page (Ed.), Methods of Soil Analysis: Agronomy Monograph 9, American Society of Agronomy and Soil Science Society of America, Madison, 1982, pp. 539–579.
[29] R.L. Parfitt, A.D. Wilson, Estimation of allophane and halloysite in three sequences of volcanic soils, New Zealand, in: E. Fernández Caldas, D.H. Yaalon (Eds.), Volcanic Soils. Weathering and Landscape Relationships of Soils on Thephra and Basalt, Catena, 1985, pp. 1–8 Supplement 7.
[30] L.P. Van Reeuwijk, Procedures for Soil Analysis, International Soil Reference and Information Center (ISRIC) Technical paper, ISRIC, Wageningen, 1993. [31] B. Dabin, Étude d’une méthode d’extraction de la matière humique du sol, Sci. Sol 1
(1971) 47–63.
[32] D. Merlet, Mise au point technique concernant l’extraction et la caractérisation des composés organiques presents dans les sols, Centre de Pédologie Biologique. CNRS, Nancy, 1971 doc. No. 15.
[33] K. Kumada, H.M. Hurst, Green humic acid and its possible origin as a fungal me-tabolite, Nature 214 (1967) 631–633,https://doi.org/10.1038/214631a0. [34] R. Fründ, H.-D. Lüdemann, F.J. González-Vila, G. Almendros, J.C. del Rio,
F. Martin, Structural differences between humic fractions from different soil types as determined by FT-IR and13C-NMR studies, Sci. Total Environ. 81–82 (1989)
187–194,https://doi.org/10.1016/0048-9697(89)90124-1.
[35] F.J. González-Vila, H.-D. Lüdemann, F. Martin,13C-NMR structural features of soil
humic acids and their methylated, hydrolyzed and extracted derivatives, Geoderma 31 (1983) 3–15,https://doi.org/10.1016/0016-7061(83)90080-0.
[36] S. Kim, R.W. Kramer, P.G. Hatcher, Graphical method for analysis of ultrahigh-resolution broadband mass spectra of natural organic matter, the Van Krevelen diagram, Anal. Chem. 75 (2003) 5336–5344,https://doi.org/10.1021/ac034415p. [37] R.L. Sleighter, P.G. Hatcher, The application of electrospray ionization coupled to ultrahigh resolution mass spectrometry for the molecular characterization of nat-ural organic matter, J. Mass. Spectrom. 42 (2007) 559–574,https://doi.org/10. 1002/jms.1221.
[38] G. Almendros, Z. Hernández, J. Sanz, S. Rodríguez-Sánchez, M.A. Jiménez-González, J.A. González-Pérez, Graphical statistical approach to soil organic matter resilience using analytical pyrolysis data, J. Chromatogr. A 1533 (2018) 164–173,
https://doi.org/10.1016/j.chroma.2017.12.015.
[39] P. Tinoco, G. Almendros, F.J. González-Vila, J. Sanz, J.A. González-Pérez, Revisiting molecular characteristics responsive for the aromaticity of soil humic acids, J. Soils Sediments 15 (2015) 781–791,https://doi.org/10.1007/s11368-014-1033-y. [40] H. Bahri, M.F. Dignac, C. Rumpel, D.P. Rasse, C. Chenu, A. Mariotti, Lignin turnover
kinetics in an agricultural soil is monomer specific, Soil Biol. Biochem. 38 (2006) 1977–1988,https://doi.org/10.1016/j.soilbio.2006.01.003.
[41] G. Chiavari, G.C. Galletti, Pyrolysis-gas chromatography/mass spectrometry of amino acids, J. Anal. Appl. Pyrolysis 24 (1992) 123–137,https://doi.org/10.1016/ 0165-2370(92)85024-F.
[42] J. Kaal, C. Rumpel, Can pyrolysis-GC/MS be used to estimate the degree of thermal alteration of black carbon? Org. Geochem. 40 (2009) 1179–1187,https://doi.org/ 10.1016/j.orggeochem.2009.09.002.
[43] I. Kögel-Knabner, W. Amelung, Dynamics, chemistry and preservation of organic matter in soils, second Edition, in: H.D. Holland, K.K. Turekian (Eds.), Treatise on Geochemistry, vol. 12, Oxford, Elsevier, 2013, pp. 157–215, ,https://doi.org/10. 1016/B978-0-08-095975-7.01012-3.
[44] S.A. Waksman, Chemical nature of organic matter or humus in soils, peat bogs, and composts, J. Chem. Educ. 12 (1935) 511–519,https://doi.org/10.1021/ ed012p511.