A Work Project, presented as part of the requirements for the Award of a Masters Degree in Management from the NOVA School of Business and Economics.
CUSTOMER RELATIONSHIP MANAGEMENT PLAN FOR WRIKE
MARIAM VANIAN STUDENT NUMBER #1975
A Project carried out on the Master in Management Program, under the supervision of: Professor Elizabete Cardoso
2 ABSTRACT
Achieving long-term success for companies includes providing customers with exceptional products and ser-vices. It implies investing in Customer Relationship Management (CRM) and building a plan of its implementation. This issue is addressed in present Work Project by conducting interviews with top-management of Wrike and sur-vey with other employees which showed there is space for improvement of company’s current CRM. Results give insights of CRM in Wrike and are the basis of CRM plan proposal. The key effect of the proposed plan can be seen in the increase of the customer’s value and consequently result in Return on Customers.
Key-Words: CRM, Wrike, Planning, Customer-centricity.
TABLE OF CONTENT ABSTRACT ... 2 INTRODUCTION ... 3 CONTEXTUAL BACKGROUND ... 3 Company Overview ... 3 Literature review ... 4
What is Customer Relationship Management (CRM)? ... 4
CRM planning ... 5
CRM in IT industry ... 6
MARKETING RESEARCH ... 7
Methodology ... 7
Limitations of the research ... 9
Main results ... 10
Results from qualitative research ... 10
Results from quantitative research ... 11
RECOMMENDATIONS: A CRM PLAN FOR WRIKE ... 12
CONCLUSION ... 19
BIBLIOGRAPHY ... 20
3 INTRODUCTION
Nowadays in the world where competition is getting more and more intense, exceeding customers’ expecta-tions is seen as an essential element of success. In order to achieve this, companies, need to know their customers well and always make sure they maintain a productive relationship with them. In this way, the role of the customer for the company and the approach to CRM remain the topics of high importance and broad discussions. The organ-izational challenge that is addressed in the Work Project does not concern an already established CRM processes at Wrike, IT company that develops project management tool. The Work Project was designed in a problem-solving format: with the aim to research and bring up the key problems in the company’s current CRM system. The overall goal of the Work Project is to provide a CRM plan for Wrike by applying research methods and CRM frameworks as well as studying the industry’s benchmark. As a hypothesis, it is presumed that CRM initiatives and projects in the plan can significantly increase the customer’s value for Wrike and the Return on Customers as a result, which in the long-term is expected to result in the overall improvement of the customer relationship strategy.
The Work Project is divided into three parts: 1) Contextual background: this part includes overview of Wrike and literature review; 2) Marketing Research: the second part includes the research design description and tools used for data analysis as well as main results achieved with it; 3) Recommendations: the final part contains a CRM plan proposal for Wrike.
The importance of this topic is explained by the absence of any previous research regarding Customer Relation-ship Management at Wrike; as well as the capability to conduct extensive research whilst being a full-time employ-ee of a Marketing department at Wrike.
CONTEXTUAL BACKGROUND Company Overview
The object of the research is Wrike, the company founded in 2007 which develops online project management tool that is also called “Wrike”. This tool enables its users to create, manage and track projects and tasks, including deadlines, schedules and report building amongst the rest. The product offering is split into three groups which differ
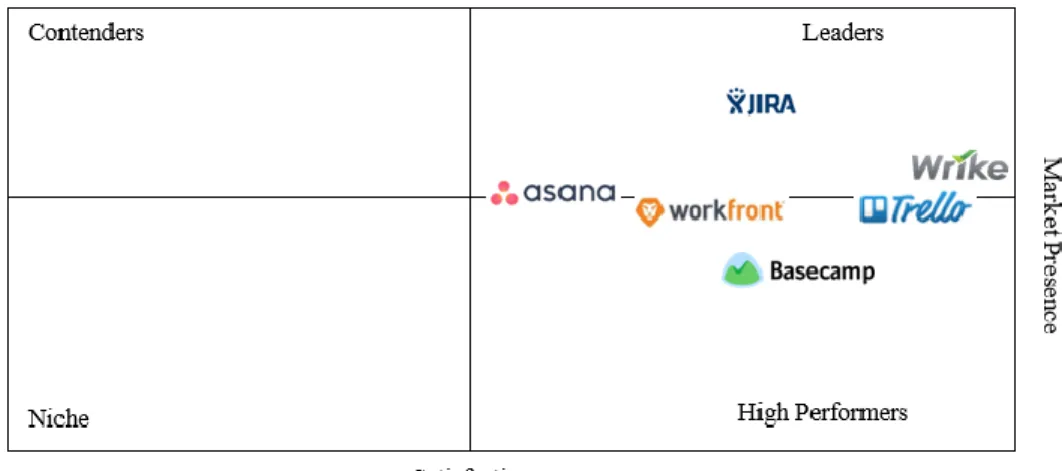
4 in price and features (Wrike, n.d.); each of the group is presented in Table 1 of the Annex. The main competitors of Wrike as a project management tool are Jira Software, Trello, Asana, Basecamp and Workfront; these companies compete across Market Presence and Customers’ Satisfaction. The competitors grid (G2 Crowd, n.d.) is presented in Figure 1 of the Appendix.
Literature review
What is Customer Relationship Management (CRM)?
The modern day understanding of CRM amongst the researchers is very broad: some of them see CRM as a process, a strategy, a technological tool, a capability, or even as a philosophy. Initially CRM was more related to the technological implementation of various tools (Kumar & Reinartz, 2012), from that point of view, CRM has devel-oped as a technique of creating relationships between a company and its customers (Eggert & Fassot, 2001). The conceptual range of definitions from a narrow technological tactic to a strategy, brought a broad meaning of CRM as “a cross-functional strategic approach concerned with creating improved shareholder value through the
devel-opment of appropriate relationships with key customers and customer segments” (Payne & Frow, 2005, p.168).
The shareholder value highly correlates with Customer Lifetime Value (CLTV), which is defined as the present value of all future profits obtained from a customer over their life or their relationship with a firm (Gupta et al., 2006). In the present Work Project, the CRM term is used to define an enterprise-wide approach of understanding customers and influencing their behavior to improve customer acquisition, retention, and profitability (Kumar & Reinartz, 2012). Appropriate technological solutions boost the overall CRM performance; as a result, came a term of eCRM which accumulates a wide range of customer related activities performed using the advantages of the In-ternet and all related technologies, i.e. web browsers or other electronic touch points (IT Knowledge Portal, n.d.).
Customer-centricity is the term that will be used in the Work Project to show that customers are treated as a core asset of the company (Peppers & Rogers, 2011). Customer-centricity implies constant updates of the customer intel-ligence database, i.e. their preferences, peculiarities and responses to marketing activities (Brink & Berndt, 2008).
5 CRM planning
In this Work Project, several resources on the subject of CRM planning were examined and combined to pro-vide a broader understanding on the issue. Kumar and Reinartz (2012) suggest the following elements of strategic CRM planning: company’s commitment to using CRM, data acquisition and usage processes, implementation steps of CRM and its integration into the existing processes. The OPIT framework (Organization, Processes, Infor-mation, Technology) from Peppers & Rogers Group (n.d.) takes into account company’s structure and analysis, information capture, data collection issues, and the technologies used for that purpose. Rigby and Ledingham (2004) claim that for planning strategic CRM, the key pain points should be identified upfront, time and budget should be predicted for each step of the CRM strategy. Microsoft’s CRM plan (Whobrey et al., 2014) was studied as a prime example of a thoroughly CRM strategy as well as CRM Project plan provided by Sysco (Dunlop, 2014). In addi-tion, case studies of the Peppers & Rogger Group (n.d.) and Salesforce Study on Customer Service (Hall-Stigerts, 2014) were also considered in this Work Project. Ultimately, the following elements of CRM planning were identi-fied:
1. Current situation diagnosis, indication of the main challenges: This is the initial stage where the already
exist-ing aspects of CRM are beexist-ing identified, and their impact on the company is beexist-ing studied. At this stage, the under-standing of the main pain points and challenges is established to prevent their potential development into a larger problem (Dunlop, 2014). 2. Company’s strategy, culture and vision: Strategy should contain goals, which are con-crete and clear for all the stakeholders. At this stage the questions of who is going to be responsible for the building and implementation of the strategy; and what teams will be a part of the process should be raised (Peppers & Rog-ers, 2011). 3. CRM goals and metrics: CRM goals should be closely aligned with the company’s and the depart-ment’s strategy, and should correspond with the company’s overall vision. All the goals should have measurable metrics commonly referred to as Key Performance Indicators (KPIs). 4. Data collection and usage: Depending on the set goals, different kind of data is being tracked and used, which means, that for gathering and keeping data, CRM systems might vary as well. (Peppers & Rogers Group, n.d.). 5. CRM implementation and its integration into
6
exiting processes: This part of CRM planning involves tactical decisions regarding people, processes and
technolo-gies (Kumar & Reinartz, 2012). 6. Risks: Whilst helpful, CRM system implementation should not be seen as a rem-edy for better relationships with the company’s clients. There are certain risks to each CRM initiative that need to be taken into account at all implementation stages (Hall-Stigerts, 2014). 7. Adoption plan for the organization and its
users: The aim of CRM implementation is to contribute to building relationships, which will be mutually beneficial
for both, the company and its customers. That is why at the very early stage of CRM system development a cross-functional team should set up a group of users in whom CRM initiatives will be tested (Whobrey et al., 2014).
8. Budget and Timeline: All the CRM implementation steps should be aligned with the objectives and the
compa-ny’s expectations; and the project leader should present an adequate timeframe for each stage of the process and an estimated cost to predict how the project will impact the company financially (Rigby & Ledingham, 2004).
CRM in IT industry
Several case studies were analyzed in order to identify CRM best practices in the IT industry. Those of HP, Sony and Apple were chosen as the most relevant ones for this case.
Sony wins customer satisfaction by being always near them: they have over 5,300 customer service locations across the globe. Sony also runs calls with customers and uses Net Promoted Score (NPS) to measure customers’ engagement (Davey, 2013). NPS is the percentage of promoters minus the percentage of detractors. Promoters are those who answered 9 or 10 to the question: “On a scale of 0 to 10, how likely would you be to recommend this company (or this product) to friends and colleagues?”, and detractors are those who answered from 0 to 6 (Reich-held & Markey, 2011) to this question.
Hewlett-Packard (HP) increased the number of call center agents to be able to react to their customers’ requests faster. They are also reported to have invested in the new Interactive Voice Response (IVR) software to provide expedited answers to customers’ questions (Twombly, 2009). Besides, they leverage analytics tools that integrate with their call center software during support calls. Exceeding customer’s expectations and bringing the best things customers are used to in the real life is what Apple does (Gallo, n.d.) to strengthen relationships with customers. For
7 example, Apple mimics features from the hospitality industry: Genius Bar is a direct emulation of a hotel’s conci-erge. Above that, Apple has One-to-One program which gives every customer an opportunity to get individual training on Apple’s products for one year after their purchase (Phelps, 2014).
MARKETING RESEARCH Methodology
The main goal of the research is to gather intelligence and expertise regarding CRM in Wrike and to identify the main challenges Wrike faces. The corresponding objectives of the research are: to explore the current situation of CRM, to explore the general attitude towards the usage of the integrated CRM system and to CRM as a concept.
The first action performed was the exploratory qualitative research. The qualitative research was held using the Delphi method via conducting one-to-one interviews with Wrike management. The research processes of in-depth interviews are normally highly flexible and unstructured (Malhotra & Birks, 2012). As a result, in the present Work Project the interviews were divided into three main parts to make further analysis more logical and structured. The one-to-one type of interview was chosen over a group interview to perform a more in-depth study of the matter and to create a free information exchange environment as well as for the ease of arrangement (Malhotra, Birks & Wills, 2013). A systematic sample based on the criteria “top management”(Miles & Huberman, 1994) was used to choose interviewees. The sample consisted of six managers (from the eight possible ones, which gives us confi-dence that the results represent the actual state of affairs in the company at that given moment) from different partments which were interviewed in the period of three weeks. The reason why the representatives of different de-partments were selected for interviews was to obtain a wide range of business insight and to understand if the gen-eral attitude is the same across the company. The demographical data of the interviewees is presented below in the Table1:
8 Table 1: Demographic data of interviewees
Interviewee 1 Interviewee 2 Interviewee 3 Interviewee 4 Interviewee 5 Interviewee 6
Male, 29 y.o.; Works in Wrike for 3 years; Product Team Manager; Manage 7 people; Postgraduate. Male, 27 y.o.; Works in Wrike for 3 years; Support Team Leader; Manage 4 people; Postgraduate. Female, 32 y.o.; Works in Wrike for 8 years; Marketing Perfor-mance Director; Manage 12 people; Postgraduate. Female, 30 y.o.; Works in Wrike for 5 years; Analytics Team Leader; Manage 6 people Undergraduate. Male, 35 y.o.; Works in Wrike for 8 years; CTO; Manage 20 peo-ple; Undergraduate. Male, 31 y.o.; Works in Wrike for 3 years; Mobile Team Manager; Manage 7 people; Postgraduate. The data display perspective of analyzing was used in the present Work Project as it provides the possibility to draw the conclusions (Malhotra et al., 2013). The analysis grid was used to present the topics of the in-depth inter-views, the meaningful quotes of respondents (individuals), the interviewee notes and the summary of all interviews in order to understand if there is a consensus on the topics or lack of it. Information which is used in the analysis grid was subtracted from the initial interviews using data reduction (Miles & Huberman, 1994), as a part of the analysis, compared and used to draw the conclusions.
The next step was the conclusive quantitative research which was built based on the assessment of the one-to-one interviews. A descriptive method was used and a survey was composed to collect the necessary data (question-naire is presented in Table 2 of the Annex). The quantitative research was aimed at identifying the perception of CRM among employees of Wrike and to find out if it was the same to one of the management team. The traditional sampling method was used to obtain the information, which was collected through an online questionnaire, which was distributed via web in the office (Malhotra et al., 2013). To measure the respondents’ data, the non-comparative scale was chosen. In order to avoid neutral answers, it was decided to use an itemized rating scale from one to ten. The questionnaire was designed as a collection of statements supplied with an opinion bar to measure the level of the agreement with them. Fifty-four responses (from 215 possible) were collected from the employees of different departments at Wrike. Only fixed-response questions were used, among which the one for those who experienced inability or unwillingness to answer. To analyze the results gathered from the quantitative research, the descriptive
9 analyses was conducted via Excel with respect to the following measurements: Range (minimum and maximum value), Average Total Score Method and the Standard Deviation as well as the Frequency Distribution.
Using the Excel, ANOVA test was conducted to identify if the answers of respondents are dependent on the demographical variables. We have examined dependence from two demographical variables: position in company and number of years working for company. To test the first one, the null hypothesis was taken as following: “All Wrike employees think that having an integrated customer data system which gives a 360-degree view of custom-ers will contribute to the efficiency of Wrike as a company”. The null hypothesis was tested to see if generally peo-ple in both management and non-management positions are agree with that or there is an absence of the agreement. To do that two groups were set up: Group1: employees who have an authority area1; Group2: employees who don’t have such an authority2. To see the dependence of the attitude to integrated customer data system from the number of years spent in company we have differentiated two groups. Group 1: those who worked at Wrike for less than a year; Group 2: those who worked at Wrike more than a year. The null hypothesis was: “Regardless of the time spent in the company, the integrated customer data system is seen as a contributor to the efficiency of Wrike as a company.” The input for ANOVA tests was the distribution of answers from one to ten across both groups.
Limitations of the research
Due to internal company’s policy, it wasn’t possible to interview the customers of Wrike. One-to-one inter-views were held only with the managers in the Saint-Petersburg office due to the accessibility issues. Churn rate is treated as confidential data, so the information used regarding this metric is based on secondary data (Liu, 2014) which provides results of two month Wrike’s research on customers’ feedback but doesn’t have numerical justifica-tions.
1Answered “Yes” to the question: “Are you in the position in which people report to you?” 2Answered “No” to the question: “Are you in the position in which people report to you?”
10 Main results
Results from qualitative research
The results of the qualitative research were divided into parts depending on the research objectives; the main re-sults are presented in the form of a summary in Table 1 of the Appendix.
From the interviews, it was understood that different departments talk different languages when it comes to customer differentiation, which affects the communication between them. The importance of acquiring and taining customers is perceived differently and therefore has a different value across departments. As a result, the re-search found that there was no unified opinion on which customers represent the biggest value for the company.
Data usage and storage appeared to be the most questionable part of the current CRM system. Customers’ feedback is collected through different sources and comes to various departments through separate channels. It cre-ates a time gap between customer requests and responses to them, which results in expired or lost data. This prob-lem occurs due to the following reasons. Firstly, different CRM software is being used. Secondly, even if some departments use the same CRM software (such as Support and Product Development), they have different access level to the customer database. Thirdly, each CRM software system has a different number of leads with dif-ferent data available. Managers claimed that their departments might experience difficulties when gathering data from other departments.
Insights gathered from the management regarding the tools and the ways of communication gave the ability to build a Customer Lifecycle Communication Plan, based on Touchpoint Map (Capek, 2007) and Customer Lifecy-cle model (Court et al., 2009) to understand if there are certain challenges at particular stages. It can be observed that the Purchase, Retention and Advocacy stages have the least amount of touchpoints with the company. It may happen because after the purchase, Marketing Automation Team cannot contact customers, so communications between the customers and the company is mostly initiated by the former.
11 Table 2: Customer Lifecycle Communication Plan
Among different reasons for quitting work with Wrike, “lack of usage” (Liu, 2014) was ranked as number one. This problem lies on both sides: Wrike showed an absence of clear onboarding procedures; whereas from the customers’ perspective, there was evident unwillingness to spend time on Wrike to understand it. From the obtained results it is clear that the company is currently in the Database Marketing stage of CRM according to the En-terprise Strategy Map (Peppers & Rogers, 2011). There are abilities and skills in the company to interact with the customers individually (mentioned among the aims of data collection), though the accent is more on selling the product than building a two-way communication.
As a result of the assessment, it was understood that the managers of the departments think that Wrike as a company as well as each department can benefit from using the integrated CRM system.
Results from quantitative research
To evaluate the coherence between the top-management insights and other employees’ opinion, a frequencies analysis was held. Graph 1 shows the frequencies distribution on the question which will be used for hypothesis testing. For testing first hypothesis distribution between Groups is the following: management team represents 33% of all respondents (Group 1), non-management team represents 67% or respondents (Group 2). The second
hypoth-Awareness Consideration Trial (Acquisition) Trial Restart (Retention) Purchase Retention Advocacy Web and PPC Search Review Pages
Knowledge Base Blog
Knowledge Base Blog
Review Pages
Online Ads Targeted Ads Targeted Ads
PR Media Alerts Success
Stories from customers
Emails Direct email Direct email
Online events Recorded webinars Webinars, QA
sessions
Live chats On the Help and
Pricing Page
On the Help and Knowledge base pages Personal meetings (Offline events) IT forums and summits
Phone/Skype Calls Support calls Sales Calls Sales Calls Features
discussion
Social Media Referral from peers
12 esis was tested regarding following Groups’ distribution: Group 1 represents 28% of those who work in Wrike less than a year; Group 2 represents 72% of those who work in Wrike for more than a year.
Graph 1. Frequencies distribution of respondents’ answer to the question: “Please, provide your opinion regard-ing followregard-ing statement in a degree of accordance/agreement where 1 - I completely disagree, 10 - I completely agree”.
The challenges that were identified with the help of qualitative data analysis is supported by the ones gathered from quantitative research. The conducted ANOVA test has confirmed that there is no significant difference be-tween Group 1 and Group 2 as the p-value is significantly small, as shown in Table 2 of the Appendix.
The ANOVA test was also held to see if there is a connection between the attitude to an integrated customer da-ta system and the length of employment at Wrike. The p-value from the analysis is significantly smaller than the alpha level (see Table 3 of the Appendix) so that there is no significant dependence between the tested variables. RECOMMENDATIONS: A CRM PLAN FOR WRIKE
As the CRM plan developed in the present Work Project may be used by Wrike as a roadmap for the im-provement of their customer relationship system, it is important to give specific and detailed recommendations. Af-ter analyzing the current situation of CRM, it has become clear that Wrike can go further in the customer-centric direction. In order to do so, it is suggested that the company should follow the below guidelines as well as the rec-ommended timeline. The company should also take into account CLTV that gives an effective evaluation of the CRM initiatives, and is basis of the Return on Customer assessment.
0.00% 10.00% 20.00% 30.00% 0 5 10 15 20 1 2 3 4 5 6 7 8 9 10 N/A Fre q u en cy (% ) Qu an tit y o f a n sw ers Answers
I think having an integrated customer data system can
help Wrike do a better job
13 1. Current situation diagnosis, indication of the main challenges: The key challenges identified through presented research: A) Absence of the customer role in the company’s strategy; B) Lack of consensus about cus-tomer differentiation and no clear definition of the core cuscus-tomer; C) Data loss and expired data; D) Inability to have a 360-degree view on a particular customer; E) Poor onboarding experience and high churn rate; F) Lack of touch-points with customers.
2. Company’s strategy, culture, vision: To ensure Wrike success in the market in the long-run, it is important to include customer data and its analysis in every aspect of strategic thinking and the decision-making process. Knowledge about the customers can be collected at all levels which will help to build a viable strategy.
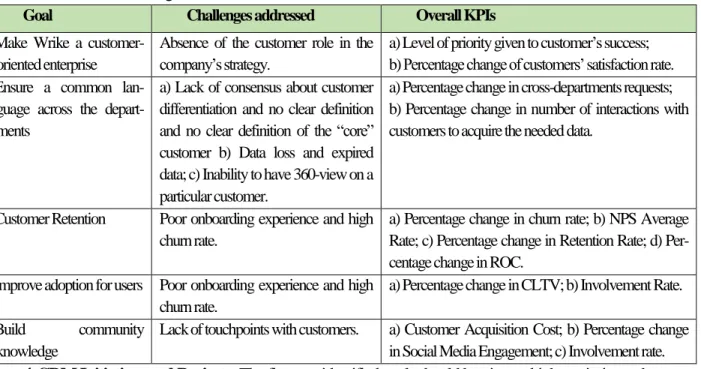
3. CRM goals and metrics: The goals for the CRM Plan are directly connected with the challenges identified through the analysis. In Table 3 we show the goals for the CRM plan, which are connected to identified challenges and corresponding KPIs.
Table 3: Overall CRM goals and KPIs
Goal Challenges addressed Overall KPIs
Make Wrike a customer-oriented enterprise
Absence of the customer role in the company’s strategy.
a) Level of priority given to customer’s success; b) Percentage change of customers’ satisfaction rate. Ensure a common
lan-guage across the depart-ments
a) Lack of consensus about customer differentiation and no clear definition and no clear definition of the “core” customer b) Data loss and expired data; c) Inability to have 360-view on a particular customer.
a) Percentage change in cross-departments requests; b) Percentage change in number of interactions with customers to acquire the needed data.
Customer Retention Poor onboarding experience and high churn rate.
a) Percentage change in churn rate; b) NPS Average Rate; c) Percentage change in Retention Rate; d) Per-centage change in ROC.
Improve adoption for users Poor onboarding experience and high churn rate.
a) Percentage change in CLTV; b) Involvement Rate. Build community
knowledge
Lack of touchpoints with customers. a) Customer Acquisition Cost; b) Percentage change in Social Media Engagement; c) Involvement rate. 4. CRM Initiatives and Projects: The first two identified goals should be given a higher priority as they were derived straight from the research while the others resulted from secondary data analysis and the inside information. Each identified goal is supported by the respective CRM initiatives or projects with specific KPIs, this information is
14 presented in Table 4 of the Appendix, calculation or meaning of each KPI can be found in the Table 3 of the Annex. The detailed plan of the initiatives designed to achieve the two priority goals is presented hereby.
4.1 Goal: Make Wrike a customer-oriented enterprise
4.1.1 Create a CRM Team in Wrike: To switch from a product development to a customer success strategy, Wrike will need to have a dedicated team launching and monitoring all the activities with customers.
4.1.1.1 Objectives: a) Access the company’s intelligence about customer behavior from wide range of
ac-tivities in order to find the main pain points; b) Create and launch bespoke customer related initiatives that would reflect various peculiarities of different markets; c) Align CRM initiatives with the company’s business objectives; d) Track the CRM workflow and results.
4.1.1.2 Who is involved: Team should consist of the representatives from each customer-facing
depart-ment (Sales, Support, Marketing, Mobile, and Product Managedepart-ment). A minimum of four people is required to make a team with a division based on the proximity to the customer: one person from the Sales and Support side, another person from the Marketing and Mobile side, a Product Management and Development-oriented person who understands the technical aspect of the product, and manager of the Team. Country marketing managers should also be involved on a regular basis as they are the ones who add a local touch to CRM and align it with the local strategy and tactics.
4.1.1.3 Risks: The already established organizational structure can make the implementation difficult and
cause misunderstanding among the Team members. This department should be granted access to all customer relat-ed information which is likely to cause data security problems. Getting access to sensitive information at Wrike is a subject of substantial time and effort, which can create disruption in the process of data analysis.
4.1.2 Employees’ training on the new values: Wrike must ensure that all the employees are familiar with the new corporate value regarding customers and understand the role of a customer in this system.
15 4.1.2.2 Who is involved: The HR Team should be in charge of the internal training. Managers of all
de-partments must participate in the training and be actively involved in its launch and preparation because they under-stand the current state of affair regarding CRM in their departments. The CRM Team should also be involved in building and launching the training.
4.1.2.3 Risks: There is a risk that some employees, especially those who are not in the direct contact with
the customer, may not be willing to accept the new customer-centric approach of the company and struggle to in-corporate CRM into their workflow.
4.2 Goal: Ensure a common language across the departments
4.2.1 Build up an integrated eCRM system: There were several options considered for this initiative: A) Use a third-party-vendor tool which works as a buffer, enables connection between different platforms and stores information; B) Develop an internal script to store the necessary information in shared document; C) Create shared folders in Wrike where everyone would upload the required data. From all the above-mentioned alternatives, the second one seems to be more feasible because using a third-party-vendor solution is an expensive option that also has some associated risks, as the company will have to rely on a separate entity to provide sufficient security and access to the information. The third option looks largely outdated and inefficient since it involves considerable effort from the employees’ side and can be easily neglected.
4.2.1.1 Objectives: a) Enable easy and accessible information flow within the company; b) Enable quick
and easy access to the necessary information; c) Provide access to the entire volume of the database; d) Create a 360-degree view on the customers.
4.2.1.2 Who is involved: At the initial stage, managers of all department should determine what
infor-mation should be open for all Wrike employees. After that, the Backend Team develops a script which takes data from different CRM software systems and combines it in one shared spreadsheet.
16 4.2.1.3 Risks: To enable desirable safety and security, this information should only be available in the
of-fice from the registered IP-addresses. That might cause some inconvenience for the employees. There is a technical risk: if the integration breaks, a new way of connecting the CRM platform will have to be found.
4.2.2 Create segmentation: There is a need to create customer segmentation that will be used by all the departments across the company. The easiest way is to split the client database by the product version they are using (as customers could also relate to that): Freemium users, Professional users and Enterprise users. The sub-categories can be determined based on the requirements of different departments. This scheme should be accessible and under-standable for everyone in the company.
4.2.2.1 Objectives: a) Enable easy interaction between departments; b) Bring customer data to a unified
format; d) Minimize the time spent to interpret customer data; e) Identify the pain points of each segment; f) Identify the core customer.
4.2.2.2 Who is involved: Department managers as they have access to all the data with the help of the
newly created CRM Team. The CRM Team in its turn would provide guidance on how to differentiate customers by theirs needs, whilst the department managers should give their insights on how the customers are different from each other and what problem they face on a daily basis.
4.2.2.3 Risks: The internal adaptation of the new customer-centered vocabulary can take a lot of time and
receive criticism from many departments.
5. Adoption plan for the organization and its users: CRM Team should take part in all the above-mentioned initiatives to ensure all of them are in line with the company’s strategy. All the changes should be understood and accepted by Wrike employees, so that everyone is aware of the problems that the company is trying to overcome and how the suggested changes can improve the company’s business once employed. All the communications re-garding CRM initiatives should go through the CRM Team to ensure their quality. The situations when individual users are strongly against particular CRM initiatives should be taken into account and there should be a way to
pre-17 vent any further communication of such initiatives to those users. Regarding usage of third-party vendors’ pro-grams, Support of vendors should be easy to reach and fast to get reply from; software should be preliminary tested internally and then go live to customers. Security Team should see all the code specification to prevent the possibil-ity that customers’ data flow to other vendors.
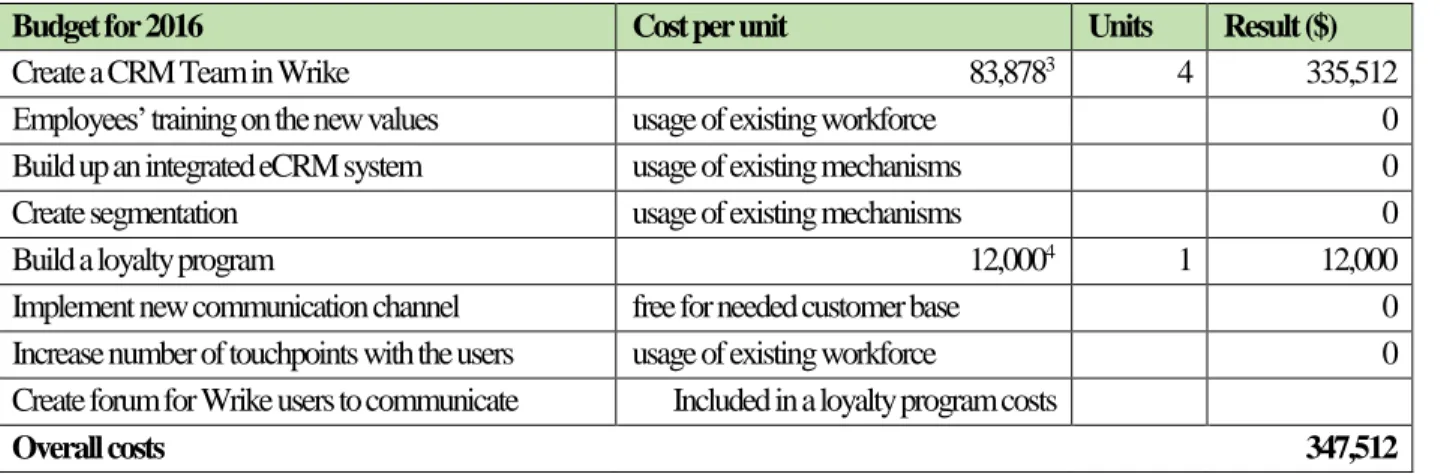
6. Budget and Timeline for all initiatives: Tables are representing the Timeline of the initiatives for 2016 and the approximate budget required.
Table 4: Timeline for initiatives
Timeline for 2016 Q1 Q2 Q3 Q4
Create a CRM Team in Wrike
Employees’ training on the new values
Build up an integrated eCRM system
Create segmentation
Build a loyalty program
Implement new communication channel
Increase the number of touchpoints with the users
Create a forum for Wrike users to communicate
Table 5: Budget for CRM initiatives
Budget for 2016 Cost per unit Units Result ($)
Create a CRM Team in Wrike 83,8783 4 335,512
Employees’ training on the new values usage of existing workforce 0
Build up an integrated eCRM system usage of existing mechanisms 0
Create segmentation usage of existing mechanisms 0
Build a loyalty program 12,0004 1 12,000
Implement new communication channel free for needed customer base 0 Increase number of touchpoints with the users usage of existing workforce 0 Create forum for Wrike users to communicate Included in a loyalty program costs
Overall costs 347,512
7. Customer Lifetime Value (CLTV) and Return on Customer (ROC): To estimate Customer Lifetime Value, it was decided to use a predictive CLTV as the goal was to understand how the customer value would
3 Based on Average Salary for Information Technology Services (PayScale, 2016) 4 Based on Pricing of Influitive AdvocateHub (GetApp, n.d.)
18 change after d the proposed CRM Initiatives have been introduced. The following formula was used to calculate the CLTV:
Equation 1: CLVT formula 𝐶𝐿𝑇𝑉 = 𝑚 ∗ ( 𝑟
1+𝑖−𝑟(1+𝑔)), (Gupta et al., 2006), where: m – net Margin: an estimate percentage taken for this variable is 15.6% based on the Software and IT companies’ average margin in Q3 2015 (CSI Market, n.d.) g – growth of the margin rate: 2% (CSI Market, n.d.); i – discount rate of 20% was estimated; r – retention rate of 5% according to inter-nal sources. The average client expenditure was calculated based on the interinter-nal knowledge of a number of customers buying the product per year multiplied by the average cost of the product available on the official webpage of Wrike (Wrike, n.d.). By applying numbers to the given formula, CLTV for the end of 2015 is:
Equation 2: CLVT, 2015
𝐶𝐿𝑇𝑉 = 17668 ∗ 0.156 ∗ ( 0.05
1+0.2−0.05(1+0.02)) = 119.9$/𝑦𝑒𝑎𝑟.
Initiatives that were described aim to grow the retention rate (r) and company net margin (m). If to estimate that the first grow up to 7%, the second to 20%, and other variables stay constant, CLTV for the end of 2016 can be as-sumed as following:
Equation 3: CLTV, 2016
𝐶𝐿𝑇𝑉 = 17668 ∗ 0.206 ∗ ( 0.07
1+0.2−0.07(1+0.02)) = 225.7$/𝑦𝑒𝑎𝑟.
We can see that the CRM initiatives may have the positive impact of CLTV as the variables they impact have a straight correlation with overall value. To see what impact it would have on customer’s profitability, we will acquire the Peppers and Rogers’ equation (2005) of ROC:
Equation 4: ROC, 2016 𝑅𝑂𝐶 =𝐶𝐹𝑖+(𝐶𝐿𝑇𝑉𝑖−𝐶𝐿𝑇𝑉𝑖−1)
𝐶𝐿𝑇𝑉𝑖−1 , where: CF – cash flow from customers on year 2016. After applying the given numbers to the formula the result was calculated as ROC=148,2$.
19 CONCLUSION
This Work Paper was aiming to propose a plan for CRM improvement at Wrike. The challenge of improving the CRM was addressed through secondary data analysis as well as qualitative and quantitative research. The most significant problems identified through research were: the absence of customer role inside the company’s strategy; lack of consensus on customer’s differentiation; and the inability to have 360-view on particular customer. These challenges were further addressed in CRM plan proposal. The research that was conducted served as a basis for the recommendations presented in a form of CRM projects and initiatives to meet CRM goals.
Among the other goals, the utmost priority should be given the following: make Wrike a customer-oriented en-terprise and ensure a common language across the departments. These two objectives were given the highest priori-ty as they addressed the main pain points discovered through the research, and achieving these objectives would mean a significant improvement in the company’s CRM. To achieve these, it was recommended to introduce cer-tain initiatives such as the creation of distinct CRM team at Wrike and introduction of employees’ training on new values for the first goal; building an integrated eCRM system and introducing customer segmentation for the second one. The timeline presented also highlights the priority of these initiatives and shows that other initiatives depend on the primary ones. Additional recommendations to meet other CRM goals are presented in Annex. A preliminary assessment confirmed a positive impact of the proposed CRM initiatives and projects on Customer Lifetime Value, which would lead to an increase in the Return on Customer.
Proposed implementations should be first tested on a small group of customers; and only then rolled out to the whole database. The Work Project has certain limitations: due to constrains in contact policy there was no research conducted amongst the customers to understand how they would react to the company’s CRM efforts. If the pro-posed initiatives are tested on a small focus group, the customers from the group can be interviewed to gain an in-sight of implementations. This could be the way to surpass the limitations and be the basis of further research.
20 BIBLIOGRAPHY
A) PUBLISHED ARTICLES
1. Gupta, Sunil; Hanssens, Dominique; Hardie, Bruce; Kahn, Wiliam; Kumar, V.; Lin, Nathaniel; Sriram, S. Ravishanker, Nalini. 2006. “Modeling Customer Lifetime Value” Journal of Service Research, 9(2): 139-155.
2. Kumar, V.; Bhagwat, Yashoda; Zhang, Xi (Alan). 2015. “Regaining “Lost” Customers: The Predictive Power of First-Lifetime Behavior, the Reason for Defection, and the Nature of the Win-Back Offer.” Journal of Marketing, 79(4): 34-55.
3. Payne, Adrian; Frow, Pennie. 2005: “A Strategic Framework for Customer Relationship Management.” Journal of Marketing, 69(4): 167-176.
4. Rigby, Darrell K.; Ledingham, Dianne. 2004. "CRM Done Right." Harvard Business Review, November Issue: 118-129.
B) BOOKS
1. Brink, Annekie; Berndt, Adele. 2008. Relationship Marketing and Customer Relationship Management. Lansdowne: Juta & Co Ltd.
2. Eggert, Andreas; Fassot, George. 2001. Electronic Customer Relationship Management. Stutttgart: Schäffer-Poeschel Verlag.
3. Kumar, V.; Reinartz, Werner. 2012. Customer Relationship Management: Concept, Strategy, and Tools. Berlin: Springer Verlag.
4. Malhotra, Naresh K.; Birks, David F. 2012. Marketing Research: An applied approach. Harlow: Pearson Education Ltd.
5. Malhotra, Naresh K.; Birks, David F.; Wills, Peter A. 2013. Essentials of Marketing Research. Harlow: Pearson Education Ltd.
21 6. Miles, Matthew B.; Huberman, A. Michael. 1994. Qualitative Data Analysis: an Expanded Sourcebook. Arizona: SAGE Publications Inc.
7. Peppers, Don; Rogers, Martha. 2011. Managing Customer Relationships: A Strategic Framework. Hobo-ken: John Wiley and Sons Inc.
8. Peppers, Don; Rogers, Martha. 2005. Return on Customer. UK: Cyan Publishing.
9. Reichheld, Fred; Markey, Rob. 2011. The Ultimate Question 2.0: How Net Promoter Companies Thrive in a Customer-Driven World. USA: Bain & Company
C) ELECTRONIC RESOURCES
1. Capek, Frank. 2007. The Customers’ Experience Does Not Happen At Your Touchpoints! Retrieved from: https://customerinnovations.wordpress.com/2007/10/26/the-customers-experience-does-not-happen-at-your-touchpoints/
2. G2 Crowd. (n.d.). Best Project Management Software. Retrieved from:
https://www.g2crowd.com/categories/project-management
3. Peppers & Rogers Group. (n.d.). Customer Experience Strategy. Retrieved from
http://www.peppersandrogersgroup.com/view.aspx?itemid=527
4. Dunlop, Richard. 2014. CRM Project Plan. Retrieved from http://www.sysco-software.com/crm-project-plan/
5. IT Knowledge Portal. (n.d.). Customer Relationship Management. Retrieved from
http://www.itinfo.am/eng/customer-relationship-management/
6. Phelps, Stan. 2014. Five Customer-Centric Marketing Lessons from Apple to Zappos. Retrieved from
http://www.forbes.com/sites/stanphelps/2014/08/18/five-customer-centric-marketing-lessons-from-apple-to-zappos/
22 7. Davey, Neil. 2013. How scrapping surveys improved Sony’s customer engagement. Retrieved from
http://www.mycustomer.com/marketing/data/how-scrapping-surveys-improved-sonys-customer-engagement
8. Wrike. (n.d.). Welcome to Wrike. Retrieved from https://www.wrike.com/company
9. Jacob, Sherice. 2012. Can Product Videos Increase Conversion Rates? Retrieved from
https://blog.kissmetrics.com/product-videos-conversion/
10. Ciotti, Gregory. 2014. Lessons in Customer Service From the World's Most Beloved Companies. Re-trieved from http://www.entrepreneur.com/article/234116
11. CSI Market. (n.d.). Software & Programming Industry. Retrieved from
http://csimarket.com/Industry/industry_Profitability_Ratios.php?ind=1011
12. Gallo, Carmine. (n.d.). The Apple Experience - Secrets to Insanely Great Customer Loyalty. Retrieved from https://www.zendesk.com/resources/the-apple-experience-secrets-to-insanely-great-customer-loyalty/
13. Court, David; Elzinga, Dave; Mulder, Susan; Vetvik, Ole Jørgen. 2009. The consumer decision journey. Retrieved from: http://www.mckinsey.com/insights/marketing_sales/the_consumer_decision_journey
14. Hall-Stigerts L. 2014. What is CRM - A Holistic Approach to Customer Relationship Management. Re-trieved from https://www.salesforce.com/ca/blog/2014/12/what-is-crm.html
15. Whobrey, Cassandra; Davey, Neil; Boardman, Richard. 2014. MyCustomer: the CRM guide. Retrieved from: https://www.mycustomer.com/resources/mycustomer-the-crm-guide
16. Wrike. (n.d.). Get started with Wrike. Retrieved from https://www.wrike.com/price
17. Liu, Wenboo. 2014. 3 Foolproof Steps to Ace Your Wrike Implementation. Retrieved from
https://www.wrike.com/blog/3-foolproof-steps-to-ace-your-wrike-implementation/
18. Twombly, Susan. 2009. Creating world-class customer service and support. Retrieved from:
23 APPENDIX
Figure 1: Competitors Grid
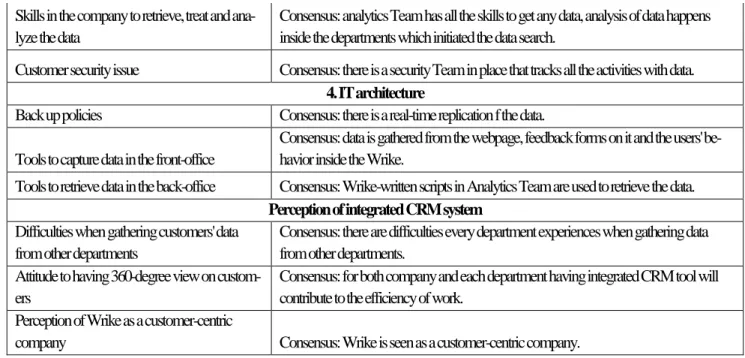
Table 1: Analysis grid of qualitative research
Topic Summary
1.Current strategy and situation
Customers’ engagement part in your strategy
Consensus: managers understand the high importance of customers in the company and nobody sees their success as a strategic goal.
KPIs connected to customers
Consensus: there are some metrics in departments associated with customer success, engagement but they aren't seen as KPIs.
Involvement into strategical level of building
relationships with customers No Consensus: either all should contribute or only management level.
2. Marketing process and campaigns
Channels to communicate with customers No Consensus: all departments use different communication channels. CRM team in place No Consensus: not everyone aware there was person for Customer Success Contact policy with customers Consensus: departments don't contact customers upfront.
Priorities in communicating with the customer No Consensus: departments have different view on which group of customers is core. Customers' differentiation No Consensus: there is no common differentiation of customers across company. Management of customers’ feedback
Consensus: customer feedback is collected through different channels and transported to Support Department if requires attention.
3. Data availability
Main purpose of data collection Consensus: to enrich the knowledge of customers and see how they use the product. Software for data collection No Consensus: each department uses different software for data collection. Customers' acquisition/retention proportions
Consensus: it is agreed that both, acquisition and retention are needed for company's success.
24 Skills in the company to retrieve, treat and
ana-lyze the data
Consensus: analytics Team has all the skills to get any data, analysis of data happens inside the departments which initiated the data search.
Customer security issue Consensus: there is a security Team in place that tracks all the activities with data.
4. IT architecture
Back up policies Consensus: there is a real-time replication f the data. Tools to capture data in the front-office
Consensus: data is gathered from the webpage, feedback forms on it and the users' be-havior inside the Wrike.
Tools to retrieve data in the back-office Consensus: Wrike-written scripts in Analytics Team are used to retrieve the data.
Perception of integrated CRM system
Difficulties when gathering customers' data from other departments
Consensus: there are difficulties every department experiences when gathering data from other departments.
Attitude to having 360-degree view on custom-ers
Consensus: for both company and each department having integrated CRM tool will contribute to the efficiency of work.
Perception of Wrike as a customer-centric
company Consensus: Wrike is seen as a customer-centric company.
Table 2: ANOVA Analysis: hypothesis 1
Table 3: ANOVA Analysis: hypothesis 2
SUMMARY
Groups Count Sum Average Variance
Answers 10 55 5.5 9.166666667
%Non-managers 10 1 0.1 0.01563786
%Managers 10 1 0.1 0.025925926
ANOVA
Source of Variation SS df MS F P-value F crit
Between Groups 194.4 2 97.2 31.66732213 8.31E+06 3.354131
Within Groups 82.87407407 27 3.0694102
Total 277.2740741 29
SUMMARY
Groups Count Sum Average Variance
Answers 10 55 5.5 9.166666667
Distribution %
Less than a year 10 1 0.1 0.009135802
Disctribution
% More than a year 10 1 0.1 0.013068887
ANOVA
Source of Variation SS df MS F P-value F crit
Between Groups 194.4 2 97.2 31.73403878 8.14186E-08 3.354131
Within Groups 82.69984221 27 3.062957119
25 Table 4: Specific KPIs for CRM initiatives and projects
Goal Overall KPIs Initiatives and
Projects
Specific KPIs
Make Wrike a customer-oriented enterprise
a) Level of priority given to customer’s success; b) Percentage change of customers’ satisfaction rate Create a CRM Team in Wrike
a) Percentage change in country-based activities; b) Percentage change of customer acquired; d) Percent-age of loyal program participants.
Employees’ training on the new values
a) Influence of HR activities to the Wrike’s image.
Ensure a common language across the departments
a) Percentage change in cross-departments re-quests; b) Percentage change in number of interactions with cus-tomers to acquire the needed data
Build up an integrated eCRM system
a) Percentage change in wait time for customer data from another department; b) Percentage change of users’ characteristics that can be tracked without addi-tional information gathering.
Create segmentation a) Percentage change of mistake when identifying customers’ data
Customer Reten-tion
a) Percentage change in churn rate; b) NPS Aver-age Rate; c) PercentAver-age change in Retention Rate; d) Percentage change in ROC
Build a loyalty program a) Conversion rate to loyal users; b) Rate of referrals c) Number of referred users turn into paid users; d) Percentage change in Social Media Engagement; e) Percentage change in Review pages ranking; f) Change in Repeat Customer Rate; g) Win-back Rate
Improve adoption for users
a) Percentage change in CLTV; b) Involvement Rate
Implement new com-munication channel
a) Percentage change in app active users; b) Percent-age change of interactions via app; c) PercentPercent-age change in features usage.
Increase number of touchpoints with the users
a) Percentage change in conversion rate to active users; b) Conversion into trials via demo; c) Percent-age change of trial dropouts; d) PercentPercent-age change of non-converted trials.
Build community knowledge
a) Customer Acquisition Cost; b) Percentage change in Social Media Engagement; c) In-volvement rate.
Create forum for Wrike users to communicate
a) Intensity of community usage; b) Rate of active community participants; c) Frequency of logins to community forum.