PEDAGOGICAL CASE STUDY:
STRATEGIC METHODOLOGIES TO BE USED BY DECISION
MAKERS - TAP PORTUGAL
Miguel dos Prazeres Falcato
Pedagogical casesubmitted as partial requirement for the conferral of Master in Finance
Supervisor:
Prof. Doutor Pedro Leite Inácio, Prof. Auxiliar, ISCTE Business School, Departamento de Finanças
PE
D
A
G
O
G
IC
A
L
CA
SE
: APPLIC
A
T
IO
N
O
F DECI
SIO
N
F
O
R
MO
L
A
T
IO
N
T
O
O
L
S B
A
SE
D
O
N
T
A
P
M
ig
ue
l d
o
s P
ra
zer
es
F
a
lc
a
to
“ Deus quer, o Homem sonha, a obra nasce”
Fernando Pessoa
“ De hora a hora, Deus melhora”
i
Abstract
The importance of sustainable, profitable companies for the economy offering growth and development is immense. The sustainability and profitability can be understood as the companies’ performance, where, as expected, higher performances are related to higher positive impacts in the economy of the countries but it should also reveal the adoption and decision about strategies that maximize the companies’ performance over the years, which is the critical point of study of this work. Based on this, the goal is to present some strategic, financial tools that should be used by decision makers, to take and base the decisions on solid facts and information, i.e., tools that must be seen as supplementary to other mechanisms for deciding future actions. The methodologies that are presented are divided into, based on the stages that are considered fundamental to take a decision: situational analysis (CPM, EFE and IFE matrix based on PESTEL, Porter’s 5 forces, Generic strategies and Porter‘s Value Chain, VRIO analysis, financial analysis- growth, profitability, risk, functional balance sheet); matching (Grand Strategy, IE, Space matrix, SWOT/TOWS) and decision stage (QSPM and best formula based on financial perspectives). Finally, all these concepts are applied, pedagogically, to TAP, putting the reader in a critical situation of taking the best decision, based on the appliance of the concepts, in order to provide and exemplify how to use the tools for future situations, with the final purpose of increasing companies’ performance.
Keywords:
Strategy formulation, corporate finance, decision making, sustainability.
JEL classification system:
L10: General Market structure, Firm Strategy, and Market Performance G39: General Corporate Finance and Governance
ii
Resumo
Espera-se que empresas que apresentem uma estratégia sustentável, isto é, empresas que ao longo da sua vida superam os concorrentes mantendo-se rentáveis e dominantes no mercado, tenham igualmente um maior impacto na economia. Contudo, é preciso ter noção de que se pode entender uma boa performance como um conjunto de decisões acertadas para uma empresa, sendo este o ponto de interesse do trabalho; descriminar um número variado de instrumentos conceptuais que devem ser utilizados no momento da decisão do futuro de uma empresa. Assim, este trabalho, prossupõe a utilização da TAP como suporte da aplicação hipotética das ferramentas necessárias para tomar uma decisão, dividindo o processo em 3 etapas: posicionamento da empresa (CPM, EFE e IFE matrix baseado em PESTAL, 5 forças, estratégias genéricas e cadeia de valor de Porter,
análise VRIO, análise financeira- crescimento, lucratividade, risco, balanço funcional), estratégias possíveis a adotar – baseadas nas análises feitas na primeira etapa (Grand Strategy, IE, Space,
matrix, SWOT/TOWS) e, finalmente, decidir a melhor estratégia (QSPM e best strategy fórmula
baseada em estimativas financeiras futuras).
Palavras-chave:
Formulação da estratégia, finanças empresariais, tomada de decisão, sustentabilidade.
JEL classification system:
L10: General Market structure, Firm Strategy, and Market Performance G39: General Corporate Finance and Governance
iii
Acknowledgments
After all these months working on this piece of work, I feel proud of myself knowing how much I learned and created along the way. However. I could never have achieved this without the precious support of a few people.
This thesis could not have been made without the amazing and tremendous support from my family. It was a long trip and you helped me all the way through.
I have to thank Professor Pedro Inácio, for always listening to my concerns, keeping me on the right path and enabling me to follow my instincts.
Finally, my good group of friends who always cheered for me and emotionally supported me to do my best and get the job done. Every of them, and they know who them are thank you.
iv
Glossary
AS: Attractiveness Scores
BRIC: Brazil, Russia, India, China
CP: Competitive advantage
CAGR: Average Growth Rate
CDL: Combined Leverage Degree
DCF: Discounted Cash flow
CPM: Competitive Profile Matrix
EBIT: Earnings before interest and taxes
EBITDA: Earnings before interest taxes depreciation and amortization
EFE: External Factor Evaluation
EPS: Earnings per share
SP: Environmental stability
EVA: Economic Value Added
FCFE: Free cash flow for equity
FCFF: Free cash flow for the firm
FP: Financial strengths
IE: Internal-External
IFE: Internal Factor evaluation
IS: Industry strengths
MBV: Market based view
MVA: Market value added
NPV: Net Present Value
PESTEL: Political, economic, social, technological, environmental, legal
QSPM: Quantitative Strategic Planning Matrix
RBV: Resource based view
ROA: Return on assets
ROIC: Return on invested capital
ROS: Return on Sales
SO: Strengths&Opportunities
ST: Strengths&Threats
SWOT/TOWS: Strengths, Weakness, Opportunities, Threats
TAP: Transportes Aéreos Portugueses
TAS: Total attractiveness score
VRIO: Value, Rareness, Imitability, Organization
WACC: Weighted average cost of capital
WC: Working Capital
WO: Weaknesses&Opportunities
WT: Weaknesses&Threats
v Table of Contents Abstract ... i Resumo ... ii Acknowledgments ... iii Glossary ... iv
Table of figures ... viii
1.Introduction ... 1
2.Pedagogical Note ... 2
2.1Pedagogical information about the case ... 2
2.1.1Target audience ... 2
2.1.2Pedagogical objectives ... 2
2.1.3Conceptualization of the theory and problem of the case ... 3
2.1.4 Methodology ... 4
2.2Literature Review – Concepts & Application ... 5
2.2.1 Situational analysis ... 5
2.2.1.1 External analysis ... 6
2.2.1.1.1 External environmental - PESTEL analysis ... 6
2.2.1.1.2Porter´s Five Forces Framework ... 8
2.2.1.1.3 Conclusive tool for external analysis: EFE – matrix ... 11
2.2.1.2Internal environment ... 13
2.2.1.2.1Types of generic strategy for products - Porter generic strategies ... 13
2.2.1.2.2 Porter’s value chain ... 15
2.2.1.2.3 VRIO analysis ... 17
2.2.1.2.4 Financial analysis ... 20
2.2.1.2.4.1Basic Concepts ... 21
2.2.1.2.4.2General financial analysis based on sales ... 22
2.2.1.2.4.3 Growth ... 23
2.2.1.2.4.4 Profitability ... 24
2.2.1.2.4.5 Risk analysis ... 27
2.2.1.2.4.6 Financial Health ... 28
2.2.1.2.4.7 Sources of financing ... 31
2.2.1.2.5Conclusive tool of internal analysis: IFE ... 31
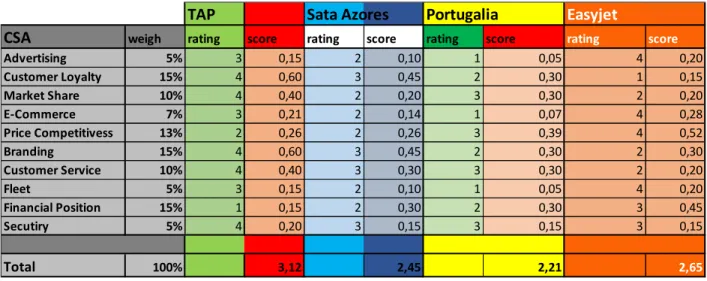
2.2.1.3 Competitor’s analysis and comparing tool: CPM ... 33
vi
2.2.3.1Types of strategies to use ... 35
2.2.3.1.1Integration strategies and Joint Venture ... 37
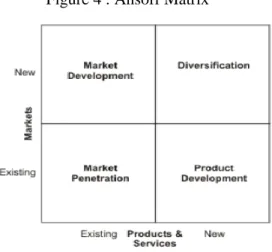
2.2.3.1.2 Intensive and diversification strategies ... 38
2.2.3.1.3 Defensive strategies ... 39
2.2.3.2Defining the range of strategies ... 40
2.2.3.2.1 SPACE ... 40
2.2.3.2.2IE – matrix ... 42
2.2.3.2.3 Grand Strategy Matrix ... 45
2.2.3.2.4 SWOT and TOWS ... 46
2.2.4Strategy to adopt – Decision stage ... 50
2.2.4.1QSPM ... 51
2.2.4.2 How financial previsions should have influence ... 53
2.2.4.2.1Net Present Value (NPV) ... 54
2.2.4.2.2 Company Valuation ... 55 2.2.4.2.2.1FCFF ... 56 2.2.4.2.2.2 EVA ... 58 2.2.4.2.2.3 MVA ... 60 2.2.4.2.2.4 FCFE ... 62 2.2.4.3Final step ... 63
2.3 Management conclusions to be taken from the case ... 65
2.4 Animation plans ... 67
3. Conclusion ... 71
4.References ... 74
ANNEXES ... 81
Annex 1 : TAP Portugal Case ... 82
Annex 2 – Income Statment with codes ... 95
Annex 3 – Balance sheet with codes ... 96
Annex 4 – Analysis based on sales ... 97
Annex 5 – Operating Profitability – ROS calculation – with solution codes ... 98
Annex 6 – Economic Profitability – ROA – with solution codes ... 98
Annex 7 – ROIC with solution codes ... 99
Annex 8 – ROE Spread Model of Financial Leverage with solution codes ... 100
Annex 9 – ROE Spread Model With Total Funding with codes ... 100
vii
Annex 11 – Operating or Business Risk Analysis with solution codes ... 101
Annex 12 – Financial risk and total risk analysis ... 102
Annex 13 – Financial health – Functional balance sheet (first approach) with codes ... 102
Annex 14 – Functional Balance sheet (second approach) with solution codes ... 103
Annex 15 – Other Ratios of financial health with solution codes ... 103
Annex 16 - Solution for calculating FCFF – stage 1 - Strategy 1 ... 103
Annex 17 - Solution for calculating FCFF – stage 1 - Strategy 3 ... 104
Annex 18 - Solution for calculating FCFF – stage 1 - Strategy 4 ... 104
Annex 19 – Free Cash-flow for firm and Equity value - strategy 1 ... 104
Annex 20 – Free Cash-flow for firm and Equity value - strategy 3 ... 105
Annex 21 – Free Cash-flow for firm and Equity value - strategy 4 ... 105
Annex 22 – EVA and MVA strategy 1 ... 106
Annex 23 – EVA and MVA strategy 3 ... 106
Annex 24 – EVA and MVA strategy 4 ... 107
Annex 25 – Pedagogical Class Plan ... 107
viii
Table of figures
Figure 1: Porter´s 5 Forces ... 8
Figure 2: Value Chain of an Airline Company ... 16
Figure 3 : Content of strategies based on level of organization and aggregation ... 37
Figure 4 : Ansoff Matrix ... 38
Figure 5 : Strategies from Space Matrix analysis ... 41
Figure 6: Strategies based on IE matrix ... 44
Figure 7 : Grand Strategy Matrix ... 45
Figure 8 : Application of a SWOT ... 48
Figure 9 : Application of TOWS ... 50
Table 1: EFE matrix ... 12
Table 2 : Competitive implication of resources in organizations ... 19
Table 3: VRIO analysis for TAP ... 19
Table 4: Analysis based on sales ... 23
Table 5 - Growth analysis ... 24
Table 6 : Profitability analysis ... 26
Table 7 : Risk analysis ... 28
Table 8 : Financial health and other ratios ... 30
Table 9 : IFE Matrix ... 32
Table 10 : CPM ... 34
Table 11 : Space matrix ... 42
Table 12 : QSPM matrix ... 52
Table 13: Using the information from case ... 56
Table 14: Free cash flows for the firm ... 57
Table 15:Enterprise value - strategy 2 ... 57
Table 16 : Equity Value - strategy 2 ... 58
Table 17: EVA for strategy 2 ... 60
Table 18 : MVA analysis – strategy 2 ... 61
Table 19 : Best strategy (y = 0,05) ... 65
1
1. Introduction
This work is a pedagogical case study about TAP Portugal in the years 2003, 2004 and 2005. The idea is to analyse the company’s strategic position in 2005 and, based on financial and management concepts, to decide the best strategy to adopt for the future. The importance of this issue is reflected in any company, where it is necessary to take strategic decisions, however, the choice should have an explicit answer to the questions “How?” and “Why?” for that decision. Taking this into account, this pedagogical case study aims to provide some methodologies and tools to help when deciding about the future.
This case study is based on (1) constructive paradigm that claims that it is dependent on one´s perspective (Yin, 2003; Stake 1995), in order to develop critical thought, a soft skill that should be developed in the students. This meaning that this paradigm “recognizes the importance of the subjective human creation of meaning, but doesn’t reject outright some notion of objectivity. Pluralism, not relativism, is stressed with focus on the circular dynamic tension of subject and object” (Crabtree and Miler, 1999), where the notion of objective is the methodologies and how to use them, and the notion of subjective can be applied to some inputs for use in the tools. As expected, all decisions have some personal feelings or views of the issue in question, the most important is reducing those feelings bearing in mind where they occur more frequently. (2) Learning with simple but expressive examples is more interesting and useful for the participants’ present and future. Therefore, close collaboration is expected between the user and participants, enabling the latter to give their opinions about the contents, giving the user a better understanding of the participants’ learnings and opinions, but it also plays a strong corrective, pedagogical role, in cases where there is a wrong approach to some subjective themes of analysis.
The importance of the concepts, tools and mechanisms that are referred to in the work are a daily issue for all organizations because their goal it is to be profitable or financially sustainable (whether for-profit or not), according to the reasons of its foundation. Achieving this goal is not an easy task due to the many factors that affect an organization, but there is always the need for appropriate management skills and the correct approach to reality in order to understand the past and present and to predict the future of an organization. This means it is possible to consider that a company can be seen as a system which, with its resources and forces achieving certain objectives or not,
1 where a system theory should understand the relations between variables rather than study variables in isolation, providing more accurate understanding (Skyttner, 2005; Bowen, 2004).
Following the issues described above, a 360º view is proposed; this is, any manager should be able to apply management and financial concepts in order to decide the best strategies for the companies, and this view is essential for their success. This means that a company’s future is based on the strategies defined in the present and adopted in the following years which, according to the literature, demands significant knowledge about strategic management as well as management literature in terms of all aspects of an organization, giving special importance to financial literature in this work.
Wheelen and Hunger (2012) defined strategic management as a “set of managerial decisions and actions that determine the long-run performance of a corporation”. Hence, it is essential to have a well thought-out strategy that enables the creation of value and the achievement of a sustainable competitive advantage, which is attained when a company has the ability to generate greater financial performance over a considerable period of time (Porter, 1985). In 1986, Barney defined the higher financial performance as a “rate of return [on invested capital] greater than a normal return and [which] indicates that the firm is prospering”.
However, management teams face two types of challenges: (1) strategy is not a reflection of the biases of the management team and (2) to allocate resources in a way that accurately reflects the strategy (Christensen, 1997). So, in order to achieve sound profitability and avoid mistakes, the strategic decision must take into account two dimensions: external environmental (general) influenced by economics and competitive level in the market; and internal environmental (organization factors) (Barney and Hesterly, 2011; Makhija, 2003). Based on this, and on what the students or the reader could face in the future, the TAP case study put them in a critical situation, in an attempt to simulate the complexity of reality, where it is necessary to take a decision about the best strategy to be adopted for the future, based on given information and data, and additional information resourced by the user.
Finally, the work is then divided into 4 main sections: (1) pedagogical objectives and purposes; (2) The literature content and the exemplificative application for the case; (3) The diverse range of uses that the case study can have, based on the user interest for the participants (4) main conclusions about the case. In short, this work is supposed to be an important summary of contents that can be used in the life of organizations, searching for the best performance all the time.
2
Note: The solutions proposed are merely hypothesis to show how to apply the methodologies
2. Pedagogical Note
2.1 Pedagogical information about the case
This segment introduces the reader to the pedagogical objectives, purpose and Problem in the analysis. The case of TAP, the base for using the literature contents, is given in Annex 1.
2.1.1 Target audience
The present case can have a wide range of targets audiences, depending on the user’ goals. In any case, the main goal is developed for the user is that the mechanisms have to have a critical, reasonable attitude at the decision time, basing that on appropriate methods. Those methods are financial and management theory and they are necessary to decide on a strategy for the company.
The target audience can, therefore, be divided, firstly by the interest in the strategic management concepts, financial concepts or on both. After that, the users can be divided into:
1. The most suitable target audience: by university students 2. Individuals interested in these matters
3. Other institutes of knowledge
4. Internal company use, for example, as a case for recruitment interviews or for employee training
5. Others
2.1.2 Pedagogical objectives
The pedagogical objectives of this case are to explain and exemplify financial methodologies (growth, profitability, risk, functional balance sheet, DCF, EVA and MVA) and strategic management theory ( PESTEL, Porter’s 5 forces, EFE matrix, Porter’s Generic Strategies, Porter’s Value Chain, VRIO analysis, IFE matrix, CPM, range of strategies to use, Space Matrix, IE matrix, SWOT/TOWS, Grand strategy matrix, QSPM), culminating in the “best strategy” tool, necessary to develop the skills and knowledge to take a proper strategic decision for the company, in this case, TAP.
3 It is desirable, through reading the work and through the reading of the resolutions based on TAP, that the user improves their knowledge about strategic management and financial analysis of the past and future of a company and understands the importance of that knowledge for their success as managers. With this, the case study should provide the user with the following abilities:
1. How to be a better decision maker
2. How to made an internal and external analysis of a company
3. Which types of strategies a company can use, based on internal and external analysis 4. The best strategy to adopt based on financial and strategic management theory 5. The importance of these concepts for companies’ success
6. How to develop soft skills such as critical thought, group in work, problems solving 7. How to develop the use of excel
8. How to develop research techniques
2.1.3 Conceptualization of the theory and problem of the case
The theory of this work is based on:
1. David´s strategy formulation framework – integrating strategy formulation techniques into a decision making framework-, providing techniques that help evaluate and decide on the best strategy or strategies to be adopted for a company. This framework is divided into 3 stages: (1) input stage (2) matching stage (3) decision making stage (David, 2011).
2. A proposal of introducing financial concepts is used extensively in the process of deciding a future strategy.
3. 5 strategic management critical tasks from 9 identified by Pearce II and Robinson (1991) : (1) Develop a profile that reflects the capabilities and the organizations’ internal resources and conditions (2) Understand the external environment, including competitive and contextual factors (3) Analyse possible options by matching resources with the external environment (4) Identify option by evaluating each option according to the mission (5) Implement strategic choices by taking into account budgeted resources allocation in which the matching of tasks, people, structures and technologies is emphasized.
4 The literature review will take all this into account, with the respective adaptations, presenting the concepts in 3 dimensions: (1) situational analysis (information and input tools), (2) range of strategies to use and (matching tools) (3) deciding the best action to adopt (decision tools).
Finally last, in order to understand the organisation strategy followed by a company, it is important to note that the user must have prior knowledge of the company’s vision, mission and values and the classification of the organization by Kotler (2010) in order to use the concepts and methodologies under analysis properly, by being (1) A market leader (strategies to protect the position- case of TAP) (2) Market challenger (strategies to increase market share) (3) Market follower - strategies to avoid competition (4) Market niche – Strategies concentrated on a small particular market that requires special skills and resources.
2.1.4 Methodology
Davis et al. (2003) state that, in their experience, case studies can be used to: (1) Allow the application of theoretical concepts to be demonstrated, thus bridging the gap between theory and practice (2) Encourage active learning (3) Provide an opportunity for the development of key skills such as communication, group working and problem solving (4) Increase the students’ enjoyment of the topic and hence their desire to learn. Based on this it is possible to describe the methodology in defining the company, the literature concepts and the exemplificative cases that a case should have, in order to promote the uses experienced by Davis and others.
This case study is about TAP. The choice of this company is for the following reasons: (1) its importance for Portugal’s economy, directly and indirectly (2) The critical situation of the company (3) The constant theories formulated about the company. The years of analysis (2003, 2004, 2005), are also due to the following reasons: (1) The critical point of changes in the company by the Fernando Pinto team (2) The moment of turnaround of the company by changing the brand of company (3) the buying of Portugalia Airlines and Varig maintenance had not been concluded. The goal was to create a situation that put the user in a stimulated position, promoting discussions and exchange of opinions about the matter. The process of conceptualizing the case started by gathering, processing and selecting all the information from secondary sources such as scientific articles related to the aviation sector, TAP annual reports from 2003, 2004, 2005, IATA reports and analysis, and others appropriate to the case.
5 The literature review, based on a long process of research, can be divided into 3 main parts: 1) Analyse of the current position: It is an analysis of the situational context of the organization that is divided in external and internal environmental - PESTEL, Porter’s 5 forces, EFE matrix, Porter’s Generic strategies, Porter’s Value Chain, VRIO analysis, growth, profitability, risk, functional balance sheet, IFE matrix and CPM ; (2) Some range of strategies to adopt - range of strategies to use , Space Matrix, IE matrix, SWOT/TOWS, Grand strategy matrix, IE matrix; (3) Deciding the best strategy – QSPM and “best strategy” formula.
Finally, the last step was explaining the choice of the content in the solutions of the practical example, which are: (1) using simple examples as input of the models to make it easier for the users to understand it (2) input of the models were considered as universally accepted (3) the values used in the tools should not call into question the correct explanation of using the model (4) there is space for other solutions that make sense (5) the financial examples are based on the values presented in the company reports.
In conclusion, it should be expected that the users use and search other sources of information, rather than just the case, and use them as input for the tools. Once more, the solutions are just to be considered as simple as possible for pedagogical reasons, where it is necessary to have them as inputs for execution of the tools presented in the work.
2.2 Literature Review – Concepts & Application
This segment explains the theory that answers that the cases should be based on, and then provides a hypothetical use of them to the TAP case.
2.2.1 Situational analysis
The situational position will be the starting point, since, in order to understand the company and make future decisions, it is fundamental to know where the company stands. Boardman et al. (2004) state that in order to analyse the current situation where an organization operates, an analysis of the external environment – industry and general environment – and to its internal environment – specific and internal characteristics of a firm should be conducted. The analysis should be seen as complementary for the external and internal environment. The resources are the most important factor for a company’s success, but it needs the information that is acquired outside the organization
6 to fully utilize these resources to create a competitive advantage (Hoskisson et al., 2006). The complexity of the analysis will be related to the number of products and markets where the company operates. As Wit and Meyer (2010) identified, a company has different sets of strategic positions, overall, goals, processes, assets and markets, based on a range of products and services that it offers, which demands a model that has a solid base of information about the company.
2.2.1.1 External analysis
The analysis of the external environment can be divided in macro/mediate and immediate, in which the purpose is to study the general and industry environment of a company, respectively. This environment is out of an organization’s control but influences it (Johnson et al., 2008). Bryson (2004) said that the environment analysis is important for a company to identify opportunities and threats.
2.2.1.1.1 External environmental - PESTEL analysis
In order to analyse the external -macro- environment of a company, it is common to use a PESTEL analysis framework. There are 6 dimensions: political (for example: tax policy, government attitude, trade restrictions, political stability) , economic (for example: economic growth, inflation rate, unemployment rate, monetary policies, consumer confidence) , socio-cultural (for example: social and lifestyle trends, age distribution, demographic changes, emphasis on safety, labour/social mobility), technological (for example: R&D activity, technology advances, automation), environmental (for example: ecological and environmental aspects) and legal (for example: employment law, health and safety lay, consumer law, competition regulations), which are used in a PESTEL analysis that are not mutually exclusive since each company should have a specific analysis (Carpenter et al., 2007; Lynch, 2006). The goal is to identify the most relevant aspects, opportunities and threats in this environment that affect the company, based on solid information, suitable to the company’s reality.
7 The application of PESTEL should take into account the company’s real situation for a proper analysis. As a simple example, here is a possible PESTEL analysis for TAP in 2005.
Political facts
1. Airline industry deregulated, Open-skies regime
2. The importance of other types of transportation that governments support; trains and buses. 3. Effects of wars between 2001 and 2004, political stability is essential
4. Taxes and duties depending on each city and country 5. Better commercial accords between countries
6. Strategic localization of Lisbon airport for connections to Africa and South America Economy
1. Increasing price of fuel, 60 % in 2004
2. Development of USA and BRIC, market increase 6.3% pass-km
3. Signs of economic recovery in the world 4.3%, (more slowly in Portugal, 0.3%) 4. Increase the number of aircraft in the world
5. The industry has still negative earnings in 2005 Social
1. The trend is for consumers to differentiate products especially by price 2. Consumers give a lot of importance to ground and in-flight services 3. Growing world population
4. Increase in women in management positions 5. Portugal population growth slower than desirable 6. Increase in life expectancy
7. Increase in the possibility of travelling out of the country 8. There are many Portuguese emigrants
9. Increase the tourism
10. Many routes depend on general trends 11. Globalization
Technology
1. New internet possibilities
2. New comfortable technologies on board 3. More efficient planes
4. Internet video-conferencing 5. New aircraft mean lower costs Legal
1. A lot of regulations from each country that companies must deal with. 2. Delays and Cancelled flights are very expensive for companies 3. Very regulated sector, in all aspects (security, hygiene, others) Environmental
8 1. Global warming concerns are the most important issue, where efficient aircraft are needed. 2. This can have an effect because if a country gets hotter, why should people travel to other
countries.
2.2.1.1.2 Porter´s Five Forces Framework
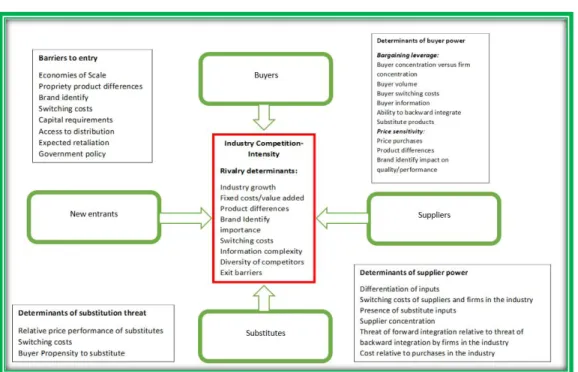
The immediate environment is related to a market based view, which is important to encourage the creation of a competitive advantage (Forsman, 2004), built by looking outside the organization, into the opportunities and threats in the industry. This view assumes the existence of five forces in the competitive environment usually named Porter´s Five Forces Framework: Porter developed the model to analyse the threat of substitute products, competition from new entrants, competition from rivals, and vertical competition; that is the bargaining power of suppliers and buyers (Barney and Hesterly, 2011). Figure 1 shows some possible factors that should be analysed and identified in the model. This model is used to understand the level of attractiveness and competitiveness of the industry at the mediate level.
Figure 1: Porter´s 5 Forces
9 Recent literature suggests a 6th force, the power of stakeholders (government, local communities, creditors, trade associations, shareholders or unions) but also complementors, which have an impact at the mediate level of a company and its influence it is not present in Porter’s 5 forces model (Hill et al., 2008). By Carpenter et al. (2007) the complementors are a “product or service which tends to increase sales in another industry”. This could be achieved by strategic alliances with companies’ producers of that type of products, with an effect on increasing the value of the product for the client and a possible increase in profits for both companies (Hill et al., 2008).
Solution B: Possible application of Porter´s Five Forces Framework analysis with hypothetical information of TAP:
In order to help understand the application of this method, it presents its application to airline sector and TAP, in 2005.
New entrants: Low (Force)
1. Intense cost of capital for start operation 2. Increasing in low-cost competitors
3. Intense and high fixed costs- for example runways and slots 4. High costs of hiring and starting an operation
5. Aircraft are extremely expensive 6. Possible entrants by vertical integration
7. Possible entrants by new companies formed by main airlines. 8. Spaces in airports at the best hours are not easy to get
9. Significant retaliation against new entrants is expected
Substitute products: Medium (Force)
1. High-trains speeds – especially over short and medium distances 2. Bus – especially on short routes
3. Options in the country of consumers
10 5. Deficit alternative transport connections by aircraft from Portugal to other European
countries
6. Development of communication technologies 7. Cruises
Power buyer: Medium (Force)
1. Individual consumers - low power– have more power in competitive routes, where they have a range choice between companies - ticket price counts for 41% of choice the product at the moment
2. New consumer patterns
3. Travel agencies – high power – have some impact because they can change or advertise other routes that are more profitable for them
4. Price elasticity is more evident on economy passengers than in business 5. Consumers have a lot of information in the market
6. There are no costs for customer changes
7. Possible backward integration by some groups of clients (for example travel agencies)
Power supplier: Medium/High (Force)
1. The main suppliers are airports, manufacturers
2. Airports have a special power in specific points of the world, especially the main city airports. Although it was them that gave the companies more revenue.
3. Manufacturers have also some influence, and the change will imply costs. There are two main aircraft manufacturers – Airbus and Boeing.
4. Possible forward integration of suppliers, creating new companies
Competition in the Market: Very Competitive
1. Market it is dominated by Large Companies with strong competitive advantages 2. Low-cost companies are increasing rapidly
3. Portugal has 2 other big airline companies
4. Strong competition in flights to the biggest European cities
11 6. Diversity Competition
7. Importance of brand identity and customer loyalty 8. High Fixed cost structure
9. Industry is facing changes
10. Change of customer attitudes in the market
6th Force: The airline sector is greatly affected by constraints on labour conditions that affect the efficiency of the companies and the market behaviour.
Other conclusions about the competition in the market: Downward trend in ticket prices , occupancy rates rising 2004, universal lay-offs in the industry, big players, lack of productivity of traditional companies, finance structural costs of traditional companies, low returns, high fixed costs, dependent on exchange rates, domestic traffic 4.1%, market lost €6 billion
2.2.1.1.3 Conclusive tool for external analysis: EFE – matrix
As in personal life, deciding something is not easy. Trying to quantify the situation is always desirable because it gives a more objective position of where a company stands and how it deals with it. The reality is that a PESTEL or 5 Porter analysis can be considered very important in analysing how a company is being affected and is dealing with opportunities and threats.
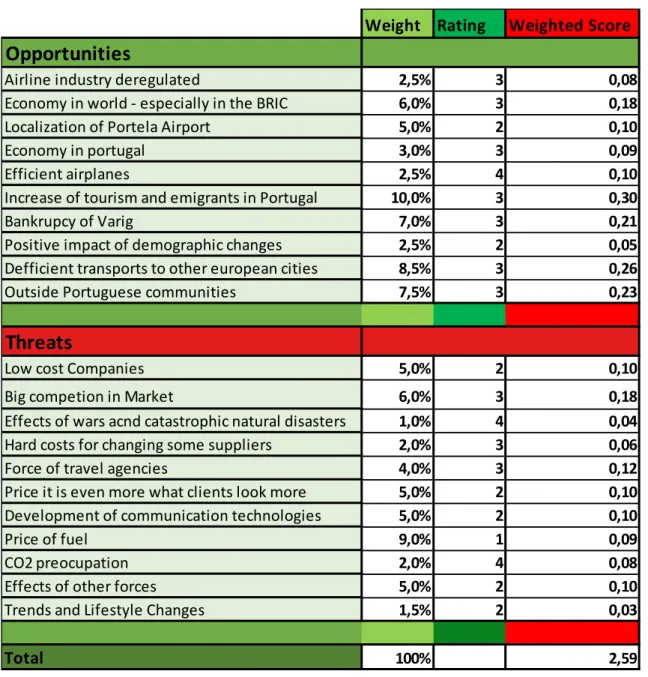
In order to use a mixed approach to the problem – a quantitative and qualitative analysis - the use of an External Factor Evaluation matrix (EFE) (David, 2011) is suggested. Here, the goal is to identify, based on PESTEL analysis and Porter’s 5 forces, at least, the 5 most relevant opportunities and threats while, if possible, being as specific as possible (using numbers, percentages, ratios, comparisons). For each factor (opportunities and threats), one should give a weight from 0 (not important for success in the industry) to 1 (very important to be successful in the industry) in which the sum of all weights should equal 1. After that, for each key factor, assign a rating from 1 (response is below average), 2 (average), 3 (above average) and 4 (superior average) and multiply them by the previous weight of importance for success. Finally, sum the multiplication for each key factor which will be from 1 (below performance) or 4 (superior performance). David (2011) considered the average total as 2.5 – average performance.
12
Solution C: Possible application of EFE analysis with hypothetical information of TAP:
Again, an explicative table will be presented to help the reader using and learning how to apply this methodology.
Table 1: EFE matrix
Source: Made by the Author
The classification of 2.59 shows that TAP has a strategy that fits the external factors. However, that value it is very near to the middle point, 2.5, which indicates a performance that has
Weight Rating Weighted Score
Opportunities
Airline industry deregulated 2,5% 3 0,08
Economy in world - especially in the BRIC 6,0% 3 0,18
Localization of Portela Airport 5,0% 2 0,10
Economy in portugal 3,0% 3 0,09
Efficient airplanes 2,5% 4 0,10
Increase of tourism and emigrants in Portugal 10,0% 3 0,30
Bankrupcy of Varig 7,0% 3 0,21
Positive impact of demographic changes 2,5% 2 0,05
Defficient transports to other european cities 8,5% 3 0,26
Outside Portuguese communities 7,5% 3 0,23
Threats
Low cost Companies 5,0% 2 0,10
Big competion in Market 6,0% 3 0,18
Effects of wars acnd catastrophic natural disasters 1,0% 4 0,04
Hard costs for changing some suppliers 2,0% 3 0,06
Force of travel agencies 4,0% 3 0,12
Price it is even more what clients look more 5,0% 2 0,10
Development of communication technologies 5,0% 2 0,10
Price of fuel 9,0% 1 0,09
CO2 preocupation 2,0% 4 0,08
Effects of other forces 5,0% 2 0,10
Trends and Lifestyle Changes 1,5% 2 0,03
Total 100% 2,59
13 to improve until it reaches a classification of nearly 4. Strategies should be taken to maximize the opportunities that the environment offers.
2.2.1.2 Internal environment
The analysis of the internal environment, branches from the Resource base view and should take into account the company’s mission, values and vision, where the goal is to enumerate all the resources and capabilities that the organization has control over or that has a direct influence on inside its boundaries (Daft, 2003), for it to achieve its expectations.
The Resource based view states that resources, capabilities and core skills are the key determinants of competitive advantage. Furthermore, the competitive advantage is derived from core skills, which come from capabilities, which in turn branch from resources (Hoskisson et al. 2005). Resources are defined as tangible (financial, organizational, technological and physical) and intangible (innovation, human and reputational resources) and, by Barney (1991), not all have the potential to be a unique, profitable resource. Tangible resources can be quantified and measured, so it is easier for other companies to imitate those resources; on the other hand, intangible resources represent the history, culture and values, and are usually harder to imitate, so the company’s best strategies are harder to copy (Hoskisson et al., 2005). This view considers the firm’s own set of resources and capabilities as the driver of growth (Otto and Low, 1998).
In order to properly analyse the internal environment, reflecting a company’s weakness and strengths, it is important to study each part of the company.
In order to do a proper analysis of the internal environment, reflecting the weakness and strengths of a company, it is important to study each part of the company. In an attempt to identify some critical points that an internal analysis to a company should cover, some methodologies are proposed to the decision maker, which should be complementary with other information.
2.2.1.2.1 Types of generic strategy for products - Porter generic strategies
An internal analysis should be conducted to understand and identify the generic strategy approach in order to position the products within the company’s market, helping to explain the competitive advantage.
14 In order to achieve a generic competitive advantage, Porter (1985, 1980) identified three generic strategies: a cost leadership strategy, a differentiation strategy and a focus strategy. Each strategy is “a fundamentally different approach to creating and sustaining a competitive advantage” (Porter 1985). A cost leadership strategy is based on being the most efficient producer in the industry reducing the cost of all structures (designing, producing and selling) for a given level of quality. A differentiation strategy is based on offering a product that, by having specific characteristics, is perceived to be better or different from other competing products (Porter, 1980). The author defined differentiation as ‘the ability to provide unique, superior value to the buyer in terms of the product or service itself (i.e. design, quality), marketing approach, delivery system, or after-sales service’. This positive valuation of the product allows the company to sell its products at higher prices, with quality as the first priority, although not indifferent to costs. Focus strategy is the concentration of the resources in a specific segment and target, achieving that by cost advantage or differentiation (Porter, 1985, 1980). The generic strategy for each company depends on the company’s characteristics, the external environment and the target audience.
Porter said that a company must choose a specific strategy or it will be “stuck in the middle”, not knowing how to deal with the external environment and be at a disadvantage compared with the competitors. However, Hill (1988), stated that being “stuck in the middle” can be a desirable strategy for some industries. The author identified this strategy as desirable for industries that are emerging and that are characterized by high growth, and especially for mature industries that are experiencing technological changes and where all experience curve economies have been exhausted with several firms achieving a minimum-cost position.
Therefore this, it is advised to clearly identify, first of all, which strategy the organization follows because the resources and the respective allocation of them and future decisions will be based on that “choice”.
Solution D: Hypothetical example of an identification of the generic strategy of Porter for TAP:
In terms of generic strategies, it is possible to define TAP as a follower of a differentiation strategy, offering products where the price does not describe the product, but rather the quality and differences in service compared with the competitors.
15 2.2.1.2.2 Porter’s value chain
Looking further into the issue of understanding a company’s competitive advantage, Porter (1985) said that it was not possible to identify the advantage by looking at the company as a whole. Porter proposed a Value Chain, dividing the company’s different activities into primary (activities that affect the business directly – firm infrastructure, human resource management, technology development, procurement) and support activities (support the possibility of competing– inbound logistics, operations, outbound logistics, marketing and sales, services) that interact with other, in order to value and identify the source of competitiveness of the product for the customer and for the organization; i.e., satisfying customer expectations and the profitability of the product or service (Porter, 1985).
Porter’s value chain is essential to identify the resources of each part of the activities conducted by the company to produce a product or service. The competitive strength of a business can be analysed by using a chain model to analyse the business, the strategic importance of the activities and how they affect cost and value (customers’ willingness to pay). As Porter said (1985), a company will be profitable as long as the value firm gains are higher than the cost of producing a product.
In order to understand some factors that compose the model, Porter exemplifies, as figure 2 shows, the use of the value chain by applying it to an airline company.
16
Figure 2: Value Chain of an Airline Company
Source: Porter (1985)
Solution E: Hypothetical application of a Value Chain analysis for TAP:
Based on Porter’s Value Chain, it is possible to be more specific about TAP’s situation, in order to identify TAP’s strengths and weaknesses. The company’s value chain is essential to understand where the company is performing well or not.
Inbound logistics: It is possible to consider the improvement and development of routes, the renewal of aircraft and an adoption of the internet as the main strong positive characteristics of inbound logistics. It is important to refer the high percentage of leased planes that the company has, with effects on its financial health. The planes are used essentially to transport passengers, but, depending on the plane, it can also carry cargo.
In terms of routes, there is a weakness related to the low diversification of the market where TAP flies to. Concerning the aircraft maintenance, TAP is responsible for repairing almost all of their own aircraft, increasing the company’s know-how and reducing external costs. In terms of fuel, the
17 company is not having the best performance, by the effects of price oil on the results of the company.
Operations: The company is considered to have well trained pilots and good in-flight services, offering catering, luggage on board and entertainment on board. The passengers perceive the product as high quality. It is important to refer that TAP is the market leader in Portugal for air cargo and passenger transportation. The negative points where the company should improve to be on time, where an efficient aircraft operation is essential to be on time.
Outbound logistics: The negative points where the company should improve are to be more effective on baggage handling. Improvements in ground services, baggage it is the biggest issue.
Marketing and sales: Good perception in the market in Portugal, good relationship with consumers, good use of the internet to advertise, the number of passengers increase more than industry, top of
mind.
Services: Effort to increase passenger feedback, loyalty programs, other services developed by the company.
Support activities: The main positive facts are the investment in technology, the qualification and quality of human resources. However, it is possible to refer to some internal conflicts (for example: between air and ground personal) and some constraints on labour contracts with some groups of professionals (for example pilots).
The negative points correspond to the financial performance, with a company losing money over the last years, with an unhealthy capital structure.
2.2.1.2.3 VRIO analysis
This analysis implies a well-known vision about the company’s resources and the industry as a whole to help describe strengths and weaknesses.
18 In order to analyse the effects of the resources on the company’s performance, the literature supports the idea that the competitive advantage is based on rare, valuable resources, combined with their good use, because companies with resources that are harder to imitate offer better products at lower prices (Barney and Hesterley, 2011 ). Therefore, it is possible to recognize that the differences between companies are based on the resources and the respective strategy used for those resources. One can also conclude that what is desirable is that those resources are valuable, scarce and hard to imitate in order to provide a unique position for the company.
Bearing in mind all these considerations, and in order to identify the resources and capacities that can create a sustainable competitive advantage for the companies, Barney and Hesterley (2011) define VRIO as a model to evaluate the value, scarcity, imitability and organization of the resources that drive the company, or not, to a sustainable competitive advantage. A question should be raised for each VRIO dimension and the sustainable advantage will be based on the answers to that question (Barney and Hesterley, 2011; Barney, 1991).
1. Value: Question: “Does a firm’s resources and capabilities add value by enabling it to exploit opportunities and/or neutralize threats?”
Answer: (a) “Must be valuable … it exploits opportunities and/or neutralizes threats in a firm’s environment”
2. Rareness: Question: “How many competing firms already possess these valuable resources and capabilities?”
Answer: “(b) Must be rare among a firm’s current and potential competition”
3. Imitability: Can the resources be imperfectly imitable because of unique historical conditions, causal ambiguity or social complexity?
Answer: “(c) Must be imperfectly imitable”
4. Organization: Is the company able to reach its full competitive advantage using the resources and capabilities it possesses?
Answer: “(d) There cannot be strategically equivalent substitutes … that are valuable but either rare or imperfectly imitable”
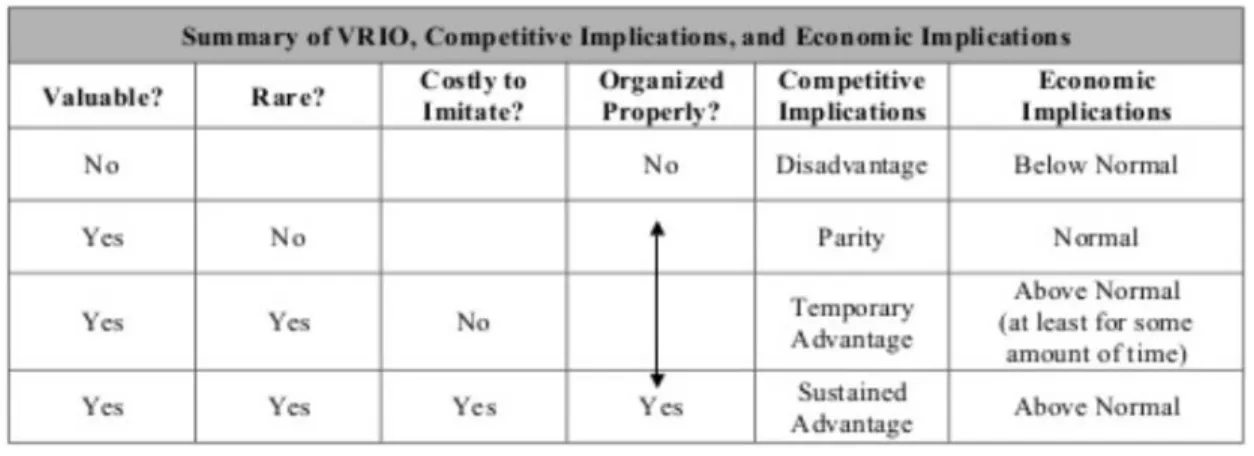
Based on the answer to the questions, Barney and Hesterly (2011) divides the competitive implication of resources as the table 2 shows.
19
Table 2 : Competitive implication of resources in organizations
Source: Barney and Hesterly (2011)
After the resources’ analysis, it is possible to make a correlation between the VRIO model and the external analysis of the companies, as the resources can be viewed as strengths or weakness to deal with the external environment (Barney & Hesterly, 2011).
Solution F: Hypothetical application of a VRIO analysis for TAP:
A possible interpretation of VRIO analysis for TAP is given in the next table.
Table 3: VRIO analysis for TAP
Resources Value Rareness Imitability Organization Competitive
Implication Staff
-
-
-
TA Management team-
-
-
-
SA Pilots’ safety-
-
-
TA Fleet-
-
P Inovations on board-
-
-
TA Spaces in airports-
-
-
-
SA20 Digital platform
-
-
-
TA History-
-
-
-
SA Partnership-
-
-
TA Financial resources D Brand-
-
-
-
SA Differentiation-
-
-
-
SA Connection to portuguese comunuties outside Portugal-
-
-
-
SAD: Disadvantage P: Parity TA: Temporary Advantage SA: Sustained Advantage
Source: Made by Author
The VRIO analysis concludes that the financial resources are the ones that show a disadvantage for the company. The competitive sustainable advantages come from the
management team, history, differentiation product and connection of Portuguese communities to TAP resources.
2.2.1.2.4 Financial analysis
The financial analysis is extremely important in order to measure the performance of the applied strategies, in terms of wealth creation. It can offer a perspective on how managers have performed and determine the effect of the strategies that have been adopted in terms of revenues and costs in ordered to measure the efficiency of those strategies as well as the efficiency of the company.
21 In order to understand and measure a company’s financial situation, it is important to know whether the firm is working efficiently or not, which means analysing the company’s financial statement, bearing in mind all the company’s characteristics. The goal is to measure the growth, profitability, risk, value creation and the financial health using financial ratios which relate to the observation and analysis of individual data through the expression of several data ratios (Woo and Baker, 2005). It is important to note that a financial statement analysis looks at the past until the current moment and it is used as a tool to measure and evaluate the adopted strategy.
Financial statements are supposed to be based on useful information that is comparable (comparisons between two or more companies in the same industry at a point of time) and consistent (relevant comparisons within the same company over a period of time), especially with relevance (timely) and reliable (verifiable) as characteristics.
Nevertheless, this analysis is based on financial information reported by accounting in which key non-financial information is not described (types of clients, revenues), leading to relevant limitations.
A major issue of this analysis concerns the source of the information reported by the accounting area, which is miscalculated, containing numerous prepositions and estimates (allowance for uncollectible receivables, periodic depreciation, the costs of warranties, and contingent losses) making it clear that the financial statements will not be so accurate and might have misleading information (Keiso et al., 2002).
Basic Concepts
Financial statements measure two dimensions: profitability (from the income statement) and financial soundness (from the balance sheet).
On the other hand, there are two types of financial analysis: the horizontal analysis (to analyse the financial statements over the years) and the vertical analysis (when it is at a specific point of time (financial structure)). This last one is extremely useful for comparing the performance of a company with its competitors and it is especially helpful in analysing statement data, like the percentage of costs in sales (Hermanson et al., 1989).
There are two types of users for financial analysis in the literature:
22 - Internal (insiders): Performance appraisal and value creation, external analysis simulation, which should be a relevant part of this work.
The financial statements can be divided into three main aspects:
- The income statement measures the company’s profitability over a certain accounting period of time, providing the net profit (gross profit (sales-cost of goods sold) -expenses) of the company (Clausen, 2009). The accounting period covers the transactions occurred in a certain period of time (Delaney et al., 2002). A positive number indicates a company, at least, with profits. In financial terms, it is also possible to analyse the income statement with margins based on sales, providing a more appropriate way to take decisions and analyse a company’s performance. As in a horizontal perspective, it allows for comparisons between performances over the years.
- The balance sheet presents the financial position of a company at a certain point of the time and it is composed of the value of assets (resources controlled by the company which expect to generate future inflow for the company), liabilities (obligations from the past, which the company will have to liquidate in the future and represented an outflow for the company) and equity (owners’ residual interest) in a company. The value of assets is always equal to the sum of debt and equity. The balance sheet does not report profits but there is a positive relationship between assets and profit (Clausen , 2009).
-Cash flow statements show the cash in/out flows of a company coming from, operating, investing and financing activities. The cash flows are useful to analyse future cash-flows, coverage for the debt obligations and knowledge of financial and investing activities (Delaney et al., 2002).
Note: Consult Annex 2 and 3
General financial analysis based on sales
Some proposed margins for analysing the company’s general performance are based on sales: Gross profit margin, Operating Profit Margin, Net profit margin Ratio.
Gross profit is a very important measure of profitability, because without an adequate gross margin, a company will be unable to pay its obligations and build a sustained strategy.
The Operating Profit Margin measures the company’s ability to turn sales into pre-tax profits and should be used to compare the company with others in the same industry. In general, the operating profit margin is an indicator of management skill and operating efficiency.
23 Net profit will reveal if a company generates a final positive or negative cash flow. The Net Profit Margin ratio can measure how efficient the company was and it also measures the effect of financial expenses on the company and can compare the performance of one year with other years and competitors.
Solution G: Application of some general ratios:
Using the TAP data, the next table shows the earnings for 2003, 2004 and 2005.
Table 4: Analysis based on sales
Source: Made by the author
The gross profit margin is positive every year, although the value is decreasing year by year, showing the strong impact of variable expenses.
Compared with operating profit margin, TAP also reveals a deficit performance, showing a strong impact on fixed costs on the accounting and financial performance of the company.
The Net profit margin is decreasing year by year, although it is important to say that the financial costs are not the ones that represent a higher risk for the company, by the difference between operating and net profit margin.
Note: For additional information see annex 4
Growth
Growth is related to the expansion process and the more as the firm grows the more resources they can access and need (Akpinar, 2009).
The growth analysis consists of understanding if the main variables are growing at the same rate, such as sales and revenues, operating profit and net income, assets and shareholders’ equity earnings per share, dividends per share. The growth analysis should also be used to compare with
Table 4 -
Analysis based on sales
Year
2003
2004
2005
Gross Profit 42,63% 38,64% 30,11%
EBIT 3,32% 1,83% -0,35%
Net Profit of the Year 1,36% 0,59% -0,59%
24 the overall economy, where companies with slower growth than inflation, are 5 times more likely to go bankrupt in the future (Smit et al., 2008). The proper use of this mechanism should use at least 3 years’ data and then a comparison between those years, using a simple Yearly Growth Rate and Average Growth Rate (CAGR).
Solution H: Application of some general ratios:
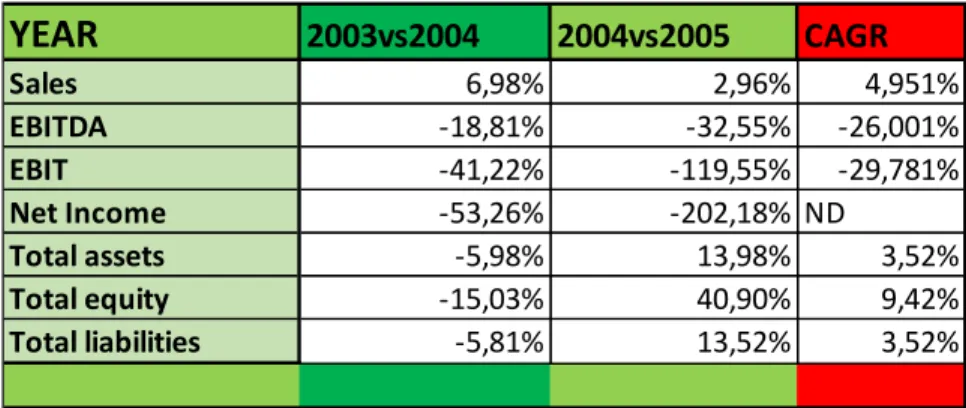
The next table summarizes the most relevant points to analyse in terms of this company’s growth.
Table 5 - Growth analysis
Source: Made by the author
One can conclude that the company’s growth does not seem sustainable as it has decreased over the years, with a negative net income in 2005. By decreasing the CAGR of EBIT and EBITDA it is possible to understand the impact of variable costs, fixed costs and depreciations on the company’s accounts.
The company has to improve and underpin the operating position. This point shows the increase in variable expenses such as fuel in the composition of a negative perspective for the company. Another critical point that should be analysed carefully it is the increase in liabilities, which can put the company in a critical financial position.
Profitability
Profitability is essential for a company to remain healthy since it allows it to grow using its own financial resources. Although the theoretical relationship between company growth and profitability is unclear and has not been the subject of uniformity in empirical research (Coad and
Table 5
- Growth analysis
YEAR
2003vs2004 2004vs2005 CAGR Sales 6,98% 2,96% 4,951% EBITDA -18,81% -32,55% -26,001% EBIT -41,22% -119,55% -29,781% Net Income -53,26% -202,18% ND Total assets -5,98% 13,98% 3,52% Total equity -15,03% 40,90% 9,42% Total liabilities -5,81% 13,52% 3,52%25 Hölzl , 2010), one common opinion is that profitable firms are abler and motivated to grow, because they should have more of their own financial resources and may be able to sustain growth (Nelson and Winter, 1982), confirming the financing constraint theory and the pecking order theory. The financing constraint theory (Goldratt, 1990) argues that non profitable companies which do not own resources from retained earnings to invest will probably disappear because of a lack of sustainability. The money from retained earnings equals to the internal capital, which should be used before external capital, according to the pecking order theory.
The matter to analyse is to understand if the company was able to generate profits in the past if it will continue to do so in the future and analyse the trends in profitability related to the company. The way to calculate the profitability generally uses ratios. These ratios measure the economic, operating and financial profitability of a company: Using Return on Sales (ROS); Return on Assets (ROA), Return on Invested Capital (ROIC) and the Return on Equity (ROE).
The Return on Sales is calculated based on EBIT and sales. Higher values of this ratio reveal a higher operating profitability, indicating a good perspective of sustainability based on the historical values of the company.
Return on Assets measures the operating efficiency based on the firm’s generated profits from its total assets. Again, a higher value expects the company to be economic profitable.
Return on Invested Capital represents the return generated by the allocation of capital by the company, giving a perspective of how well a company uses its money.
Although higher values of ROIC predict a positive creation of value for the owners, it is essential to compare this ratio with the cost of capital expect by them. If ROIC is higher than the cost of capital then the company is being managed in order to increase the value of the company; ROIC can be also considered as an economically profitable ratio Higher values demonstrate a better performance of the company and higher chances to lead it to success.
Return on equity can be seen as a measure of financial profitability, revealing how much profit a company generates with the money invested by providers of equity capital, where higher values reveal better performances. The ROE is also essential to calculate sustainable growth. In order to help the management team know what they need to do, the calculation of the sustainable growth is a must, not only for financial reasons but also for performance evaluation. The reason is
26 because sustainable growth shows the highest value of future earnings and sales can increase without the need to borrow more funds or issue new equity.
Note: Consult segment 2.2.4.2.2.2 – Presentation of EVA (other methodology of management performance analysis)
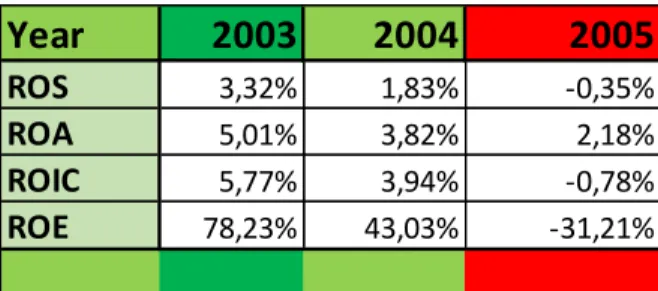
Solution I: Application of some general ratios:
In order to analyse TAP’s profitability, the following table shows the most important ratios. Table 6 – Profitability analysis
Source: Made by the author
The return on sales is decreasing year by year, affected by external forces and from a not yet adequate strategy in order to make the company operate profitably. The gross profit margin decreases, emphasizing the necessity of strong measures to ensure the company’s survival. Again, it is advisable to invest in strategies that lead to cost cutting.
The return on assets follows the same trend as ROS, however, it is possible to see the increase in the asset turnover (revenues/Assets), showing an increase in the efficiency of TAP assets. The ROIC can be seen as good in 2003 and 2004, although in 2005 the value was negative and near 0, which follows the trend of the sector as a whole, showing the decrease of value creation by the decisions adopted by the management team.
ROE it extremely influenced by the low level of Equity compared to the level of net income, which make a very high return on equity in the first 2 years, but, in 2005 that does not happen and the company shows a weak position in terms of profits. The sustainable growth rate in this case is negative in 2005, which indicates the need to borrow more money.
Note: See annex 5, 6, 7, 8, 9 and 10
Table 6
- Profitability Analysis
Year
2003
2004
2005
ROS 3,32% 1,83% -0,35%
ROA 5,01% 3,82% 2,18%
ROIC 5,77% 3,94% -0,78%
ROE 78,23% 43,03% -31,21%
Source: Made by Author
27 Risk analysis
Essentially the efficiency and response to the external environment are what is analysed here. As expected, a company faces some type of risks. The risk measure and analysis can be divided into 3 dimensions: Operating risk (Break even, safety margin and degree of operating leverage) and Financial and total risk (break even, safety margin, the degree of operating and combined leverage).
The company’s financial risk is the result of its owners’ or managers’ choices of alternative financial solutions aimed at achieving the desired target financial performance in the probability of incurring economic damage (Perez , 2015), taking into account the operational and financial dimensions of the company. Al-Shamaileh and Khanfar (2014), say operating leverage refers to the influence of all fixed cost (less interest) in the profits generated by the company and the financial leverage is the effect of the interest on the company’s accounts. It is also possible to identify a combined leverage factor, the effect of both risks simultaneously, measuring the impact of changes in the level of sales on the value of earnings before taxes (Al-Shamaileh and Khanfar, 2014).
This analysis is extremely important in a world where uncertainty is increasing day by day. It is essential for all businesses to try and reduce risk to a minimum level (Baturina, 2009). Risk can be influenced by external (level of the economy, the rate of inflation, the environment of supply and demand, the level of competition) and internal factors (company’s strategy, the existence of funds, the amount of equity, skill level of the team) (Greuning et al., 2000).
Basically, the most important factor is to study the main risks the company is facing, to understand if the earnings are going to react to an economic downturn, to see the volatility of the earnings and to be able to know if the company’s exposure to risk is growing, decreasing or stable.
28
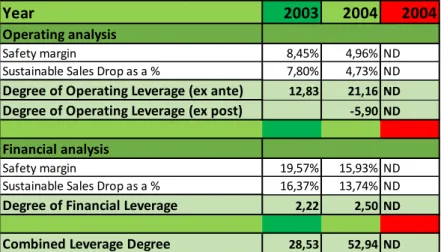
Table 7 : Risk analysis
Source: Made by the author
Again, and following what is expected by the previous analysis, the company shows a very high risk in general. The main reason comes from the operating level, where the company should try an intense strategy to change this point. The main conclusion is that TAP is very sensitive to any environmental changes, with “limited leeway” to respond those changes, as revelled by the level of safety margin and degree of operating leverage.
In terms of financial leverage, the company shows less risk than operational dimension, with values highly under from the operation risk. This means that what is explain the current financial position of the company, it is, mainly explained by operational expenses rather than interest expenses. The level of combined leverage degree is extremely high, and it is increasing substantially year by year.
The main conclusion is that TAP must come up with strategies that reduce the company’s risk, with the necessity of increasing the ROS in order to decrease the level of operation leverage. In order to have access to more sources of capital at reasonable prices to finance the sustainable growth of the company.
Note: Consult annex 11 and 12
Financial Health
Table 7 - Risk Analysis
Year 2003 2004 2004
Operating analysis
Safety margin 8,45% 4,96% ND
Sustainable Sales Drop as a % 7,80% 4,73% ND Degree of Operating Leverage (ex ante) 12,83 21,16 ND
Degree of Operating Leverage (ex post) -5,90 ND
Financial analysis
Safety margin 19,57% 15,93% ND
Sustainable Sales Drop as a % 16,37% 13,74% ND Degree of Financial Leverage 2,22 2,50 ND
Combined Leverage Degree 28,53 52,94 ND Source: Made by Author