Repositório ISCTE-IUL
Deposited in Repositório ISCTE-IUL:
2018-04-19
Deposited version:
Post-print
Peer-review status of attached file:
Peer-reviewed
Citation for published item:
Rita, P., Oliveira, T., Estorninho, A. & Moro, S. (2018). Mobile services adoption in a hospitality consumer context. International Journal of Culture, Tourism, and Hospitality Research. 12 (1), 143-158
Further information on publisher's website:
10.1108/IJCTHR-04-2017-0041
Publisher's copyright statement:
This is the peer reviewed version of the following article: Rita, P., Oliveira, T., Estorninho, A. & Moro, S. (2018). Mobile services adoption in a hospitality consumer context. International Journal of
Culture, Tourism, and Hospitality Research. 12 (1), 143-158, which has been published in final form at https://dx.doi.org/10.1108/IJCTHR-04-2017-0041. This article may be used for non-commercial purposes in accordance with the Publisher's Terms and Conditions for self-archiving.
Use policy
Creative Commons CC BY 4.0
The full-text may be used and/or reproduced, and given to third parties in any format or medium, without prior permission or charge, for personal research or study, educational, or not-for-profit purposes provided that:
• a full bibliographic reference is made to the original source • a link is made to the metadata record in the Repository • the full-text is not changed in any way
The full-text must not be sold in any format or medium without the formal permission of the copyright holders. Serviços de Informação e Documentação, Instituto Universitário de Lisboa (ISCTE-IUL)
Av. das Forças Armadas, Edifício II, 1649-026 Lisboa Portugal Phone: +(351) 217 903 024 | e-mail: [email protected]
1
Mobile services adoption in a hospitality consumer context
Abstract
Purpose
This study presents a model drawn on both the extension of the unified theory of acceptance and use of technology (UTAUT2) and the perceived value for explaining consumer behavior toward mobile hospitality services (MHS) from two perspectives: intention to use and recommendation.
Design/methodology/approach
The partial least square (PLS) was applied to data gathered from 348 validated responses to a survey in order to test a number of research hypotheses.
Findings
Results found that the proposed conceptual model explains 62% of the intention to use MHS, and 51% of the variation in recommendation. Perceived value plays a role in explaining both the intention to use and recommend MHS, with both constructs also helping in explaining behavior intention, to which effort expectancy facilitating conditions and performance expectancy also contribute.
Originality/value
This research goes beyond perceived value by combining it with a cornerstone model used in technology adoption studies, the UTAUT2. The paper addresses updated mobile hospitality services that include but are not limited to mobile hotel reservations.
Keywords
Technology adoption; mobile hospitality services; perceived value.
1. Introduction
The term mobile hospitality services (MHS) was coined to encapsulate what is known by both industry and academic fields as mobile services applied to the hospitality industry. Wang and Wang (2010) used the term mobile hotel reservation (MHR) to address solely mobile hospitality reservations. However, considering the greater breadth of services that can be provided by hotels to their guests via mobile devices, we decided to use a more comprehensive designation. The use of MHS to the hotel industry covers not only information, but also reservations with payment. Mobile apps are being used for many purposes such as digital concierge, accessing big data, and geo-location to sell services to guests within their geographical context (Oh et al., 2013).
Perceived value, seen as a trade-off between benefits and sacrifices, has been used to assess behavior intention to use technology in a few industries such as in the banking sector (Soltani and Gharbi, 2009). Moreover, the Unified Theory of Acceptance and Use of Technology (UTAUT2) has been separately used to explain intention to use technology, more recently near field communication mobile payments (Morosan and Franco, 2016a). However, literature lacks an integrated approach based on both models.
This research extends Wang and Wang (2010) study by covering a research gap in two ways: on the one hand, our conceptual model considers not only perceived value but also the UTAUT2; on the other hand, we go beyond reservations and include more hospitality services that can be used these days by tourists via mobile devices.
This research aims to test strengths and relationships between variables influencing consumer intention to use and recommend MHS. The following relevant contributions are presented: (1) expanding beyond UTAUT2 overall understanding of technology usage, which has a greater importance in the hospitality industry, considering the relevance of information technologies in hotels (Kim et al., 2008); (2) understanding the effective reaction of consumers within the hospitality industry which may guide practitioners to improve the design of technology solutions to achieve an overall better acceptance.
2. Theoretical background
2.1. Mobile hospitality services (MHS)
The current stage of maturity of mobile technologies is driving m-commerce to a holistic presence in everyone’s daily routines. Verma et al. (2012) revealed that the mobile device
innovations recent travelers would prefer include communication, hotel and location based services. A large number of hotel services can be enhanced using mobile technology, such as hotel reservation (Ozturk et al., 2016), check-in/out (Jeong et al., 2016), location-based services (Wang et al., 2014), concierge services (Wang and Wang, 2010), and service requests such as room service or extra amenities (Piccoli et al., 2017). As a response to such challenges, managers started to develop MHS as a form of m-commerce (Morosan and DeFranco, 2016b). Researchers followed suit, with recent hospitality literature devoting a large percentage of effort to such subject. Wang et al. (2016) aimed to understand the reasons for hotels to recently adopt mobile hotel reservation systems. They discovered a relation between hotels’ characteristics (e.g., size and technology competence) and MHS adoption by hotels. However, tourists are pressuring further toward MHS, with hotels offering those services leveraging above the remaining (Law et al., 2015). Tourists expect that the hotel they book to include a wide variety of services to which they can access through their mobile devices. If a hotel does not offer MHS, tourists feel disappointed and are less likely to return or even to recommend it to other prospective tourists (Law et al., 2015). Since electronic word-of-mouth today reaches every corner of the globe, especially in hospitality, thanks to mature tourism online reviews’ platforms such as TripAdvisor (Calheiros et al., 2017), it is of paramount relevance that hotels include MHS in their technology suite. Still, characterizing the types of services and their perceived value by tourists continues to be a research trend valuable from both a theoretical and a managerial perspective (Morosan and DeFranco, 2016b).
Our definition of MHS comprises three parts. First, it is a location based online service. Second, it is achieved through a mobile device connected to wireless Internet and Global Navigation Satellite System (GNSS). Third, it is used as a tool to access, request, and purchase services related to hotels. In the end, this is a mobile technology that offers hospitality corporations a powerful tool that enables consumers a simpler and faster way to order and purchase hotel services.
According to the Task-technology fit (TTF) theory (Goodhue and Thompson, 1995), information technology is more likely to be used and have a positive impact on individual performance when the capabilities of that particular technology match the tasks that must be performed by the user. Accordingly, Serrano and Karahanna (2016) identified that both user capabilities and technology capabilities are important facilitators of task performance. Additionally, personal cognition and social environment can also motivate to technology usage (Lin and Huang, 2008). The level of personalization of web-based applications
positively affects perceived interactivity, leading to users being keener to accept and use technology (Song and Zinkhan, 2008). All these TTF associated factors contribute to a better understanding of technology usage in a hospitality context. Hence, whereas in our study the technology is the mobile device, namely smartphones, the task facilitated by technology is a range of hospitality services, such as information search, response to hotel push marketing, reservation and payment. Both the task and technology concepts were clearly defined in the onset of the questionnaire and a video was shown as an illustrative example, to make sure respondents understood the subjects addressed in the survey.
2.2. Theoretical frameworks of technology acceptance
The unified theory of acceptance and use of technology (UTAUT) is the result of the combinations of eight theories/models of acceptance technology (Venkatesh et al., 2003), drawn from four constructs (performance expectancy, effort expectancy, social influence, and facilitating conditions) which are moderated by gender, age, experience, and voluntariness of use. It has been adopted to study a myriad of technologies within a wide range of industries. UTAUT2 extends it by including the following additional constructs: hedonic motivation, price value, and habit (Venkatesh et al., 2012). These constructs are added with the argument that hedonic motivation, such as enjoyment, is highly relevant in consumer product and/or technology use, and that by integrating it, one complements UTAUT’s strongest predictor, which emphasizes utility.
In the literature, there is empirical evidence validating UTAUT in different contexts, such as tourism (Grace Chen et al., 2009) and mobile banking (Yu, 2012). Also, UTAUT2 has been validated in different contexts such as: e-government services (Krishnaraju et al., 2015); learning management systems (Raman and Don, 2013), where nearly thirty percent of the variance in student’s intentions with facilitating conditions and hedonic expectancy were considerable predictors of the behavioral intention; social recommender systems (Oechslein et al., 2014), by showing that the user's social network information, profile information, and reading behavior positively influenced performance expectancy and the intention to adopt a social recommender system; online purchasing (Pascual-Miguel et al., 2015); and purchasing flights from low-cost carrier websites (Escobar-Rodríguez and Carvajal-Trujillo, 2014), where habit, cost saving, performance and expended effort, hedonic motivation and social factors were key determinants of purchasing. Thus, we extended UTAUT and UTAUT2 models by combining them with Perceived Value and applied the new proposed model to the hotel industry.
2.3. Earlier studies on perceived value
Customer perceived value is a key construct to attain sustainable competitive advantage (Kuo et al., 2013). In the past decade, perceived value has been applied to understand consumer’s adoption of new technologies. Lu et al. (2016) found that hospital elements, such as service quality, hospital credibility and hospital image, influence the perceived value of medical travel. Wang (2014) showed perceived value to be strongly influenced by mobility, perceived usefulness and security, which had, in turn, significant impact on satisfaction and trust in technology, trust in agent and trust in government.
In the context of MHS, we adapt the definition given by Wang and Wang (2010, p. 600) and define perceived value as “a customer’s overall value perception of MHR based on the comparison of its benefits and sacrifice factors when using it”. The research model proposed by Wang and Wang (2010) postulates that perceived value is a strong predictor of behavioral intention to use MHR.
3. Research model
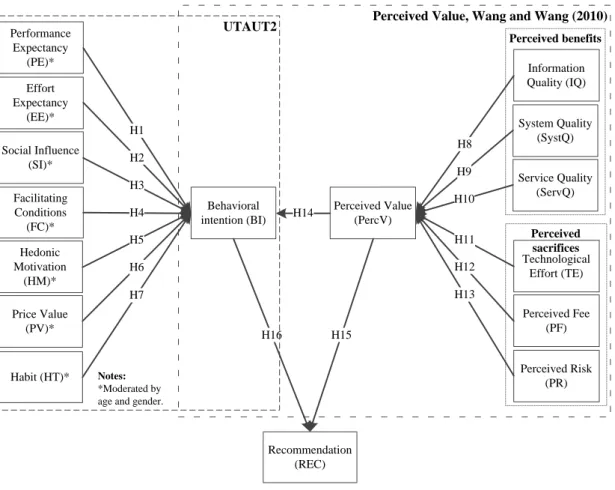
Our study is about a newly adopted service technology (MHS) and as with most newly introduced services, customers tend to assess the benefits of using the new services compared to the existing ones. Additionally, and taking into account that MHS is still in its early stages, we will test the possibility of recommending the service only by having the behavior intention to use it, thus we will add recommendation (Rec) as a dependent variable. We propose to test an enriched UTAUT2 in MHS by incorporating the perceived value model (Figure 1).
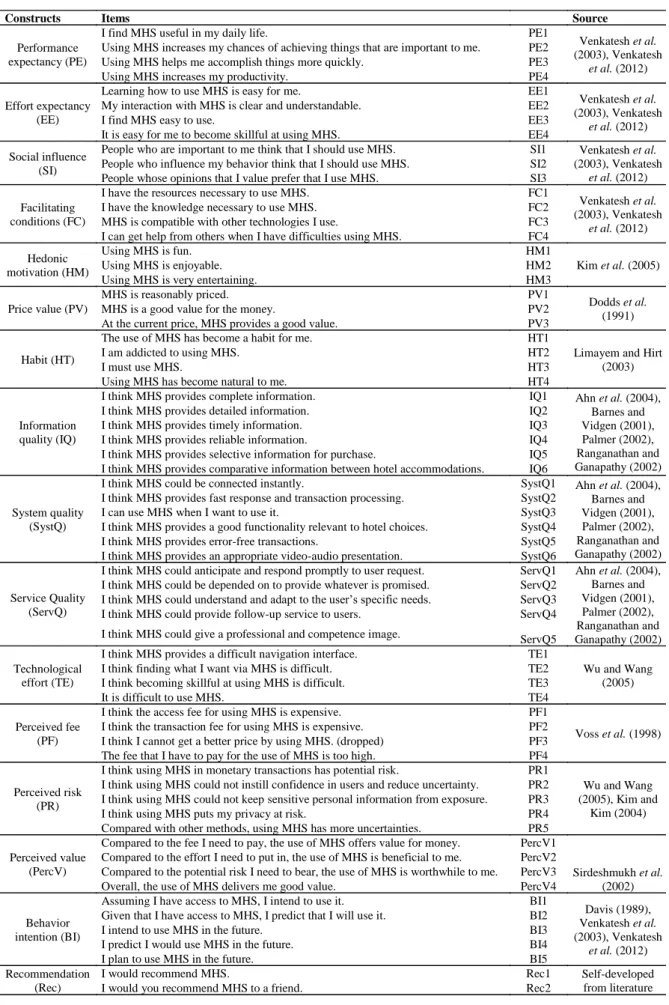
The metrics included in our model were defined based on the literature. Namely, PE, EE, SI, and FC, were adopted from Venkatesh et al. (2003); HM from Kim et al. (2005); PV from Dodds et al. (1991); HT from Limayem and Hirt (2003); BI from Venkatesh et al. (2003) and Davis (1989); IQ, SystQ, ServQ were adopted from Ahn et al. (2004), Barnes and Vidgen (2001), Palmer (2002), Ranganathan and Ganapathy (2002); TE from Wu and Wang (2005); PF from Voss et al. (1998), and PercV from Sirdeshmukh et al. (2002).
Performance expectancy, effort expectancy, and social influence were reported to be strong predictors of intention in Martins et al. (2014). Hedonic motivation, and habit were also found by Baptista and Oliveira (2015) to be the most significant antecedents of behavior intention in the adoption of mobile banking. Escobar-Rodriguez and Carvajal-Trujillo (2014)
highlighted price value and facilitating conditions as main influencers of intention to purchase flights from low-cost carrier websites. Perceived value, including perceived benefits in the Internet retailing environment, were focused by Carlson et al. (2015). Perceived value was also found to drive purchase intention for mobile paid apps (Hsu and Lin, 2015) whereas behavior intentions and recommendations were addressed by Jung et al. (2015) regarding the use of augmented reality technologies in theme parks.
Considering each of the determinants of UTAUT2 and the perceived value factors, we postulate that:
H1. The influence of Performance Expectancy (PE) on Behavioral Intention (BI) will be
positive and moderated by age and gender, such that it will be stronger for younger individuals and men.
H2. The influence of Effort Expectancy (EE) on Behavioral Intention (BI) will be positive
and moderated by age and gender, such that it will be stronger for younger individuals and women.
H3. The influence of Social Influence (SI) on Behavioral Intention (BI) will be positive
and moderated by age and gender, such that it will be stronger for older individuals and women.
H4. The influence of Facilitating Conditions (FC) on Behavioral Intention (BI) will be
positive and moderated by age and gender, such that the effect will be stronger among older women.
H5. The influence of Hedonic Motivation (HM) on Behavioral Intention (BI) will be
positive and moderated by age and gender, such that the effect will be stronger among younger men.
H6. The influence of Price Value (PV) on Behavioral Intention (BI) will be positive and
moderated by age and gender, such that the effect will be stronger among women.
H7. The influence of Habit (HT) on Behavioral Intention (BI) will be positive and
moderated by age and gender, such that the effect will be stronger for older men.
H8. Information Quality (IQ) has a positive effect on Perceived Value (PercV). H9. System Quality (SystQ) has a positive effect on Perceived Value (PercV). H10. Service Quality (ServQ) has a positive effect on Perceived Value (PercV). H11. Technological Effort (TE) has a negative effect on Perceived Value (PercV). H12. Perceived Fee (PF) has a negative effect on Perceived Value (PercV). H13. Perceived Risk (PR) has a negative effect on Perceived Value (PercV).
H14. The overall Perceived Value (PercV) of MHS has a positive effect on Behavioral
Intention (BI) to use MHS.
H15. The overall Perceived Value (PercV) will have a significant positive influence on
Recommendation (Rec).
H16. Behavioral Intention (BI) has a positive influence on Recommendation (Rec).
4. Methods and results
The questionnaire was developed in English, based on the literature, and reviewed by three scholars. The items (Table 1) were measured using seven-point Likert scales, ranging from strongly disagree (1) to strongly agree (7). After validating the survey through a pilot test, the questionnaire was uploaded to an online hosting service, which the respondents could access by clicking on the URL provided in the message delivered through social media platforms. Respondents were shown a video explaining MHS before taking the survey. The video gave sufficiently detailed information for respondents to understand the app’s functionalities and likely benefits to hotel guests. We obtained 409 respondents, of which 348 responses were validated. The majority of respondents (58%) answered that they had already used MHS at least once.
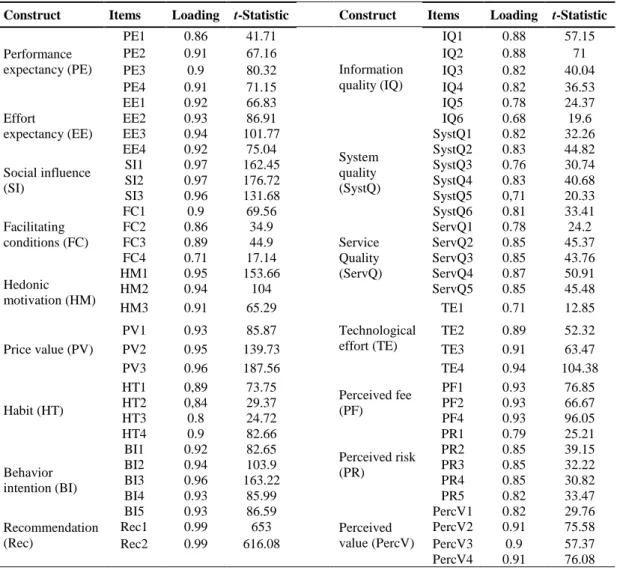
Structural equation modeling (SEM) was adopted for evaluating the hypotheses. The constructs were shown to be statistically significant, with loadings greater than 0.7 (Henseler et al., 2009). Table 2 reports the loadings and statistic values of the items measured. The t-statistic obtained from bootstrapping (500 iterations) shows that all loadings are t-statistically significant at 1%. The PF3 item was excluded due to its low loading and lack of statistical significance. All other items were retained and we can state that all data suggest internal consistency since all items have loadings greater than 0.7.
Additionally, all loadings are statistical significant at 1%, according to the t-statistics test. Therefore, all constructs were retained and we can state that all data suggests internal consistency. Finally, to grant discriminant validity of the constructs, we analyzed the data through the cross-loadings and the Fornell-Larker criterion. The first criterion requires that the loading of each indicator should be greater than all cross-loadings (Wynne, 1998), while the second postulates that the square root of AVE should be greater than the correlations between the construct (Henseler et al., 2009). Our findings reveal that not only the patterns of loadings are greater than the cross-loadings, but also that the square root of AVE is greater than the correlation between each of the pair factors, thus confirming discriminant validity.
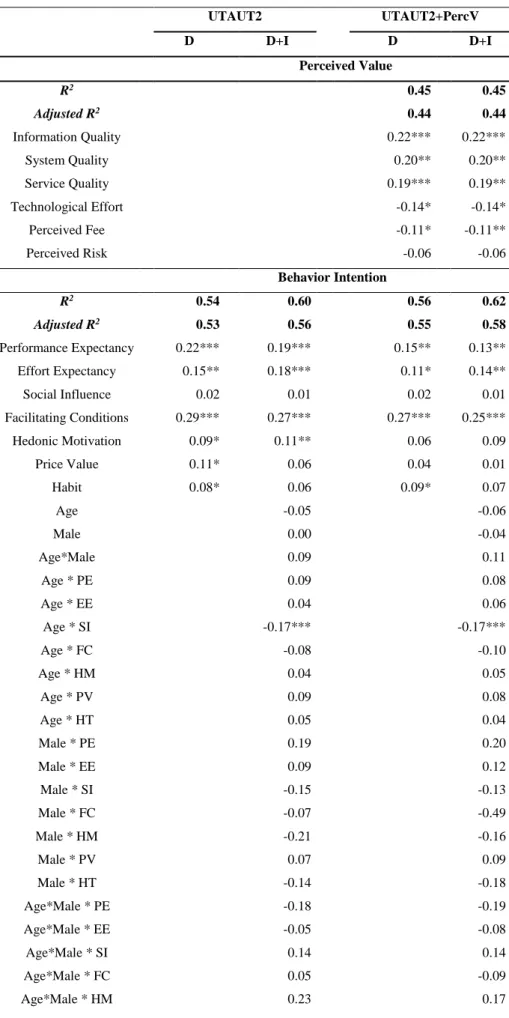
Following construct validity assessment, we analyzed four models: (i) UTAUT2 without interaction effects (D), (ii) UTAUT2 with interaction effects (D+I), (iii) UTAUT2 and perceived value (PercV) (UTAUT2+PercV) without interaction effects (D), and (iv) UTAUT2 and perceived value (PercV) with interaction effects (D+I). Path coefficients, r-squares, and adjusted r-squared for each model tested are presented in Table 3, where it can be seen that all r-squares of the structural model are in the limits recommended by Wynne (1998), i.e. above 0.2.
Findings show that moderating effects consistently influence the model, as the adjusted r-square increased from 0.53 to 0.56 in UTAUT2, while in the combined model it increased from 0.55 to 0.58. Likewise, we observed an increase from 0.53 to 0.55 including direct effects, while it increased from 0.56 to 0.58 considering both direct and interaction effects, as a result adding perceived value to UTAUT2. For recommendation, when we add perceived value to the UTAUT2 model, adjusted r-square increases (0.48 vs. 0.51). Thus, the combined model (UTAUT2 + PercV) with moderating effects surpasses all its predecessors as it improves its explanatory power. Therefore, subsequent analysis is focused solely in this model.
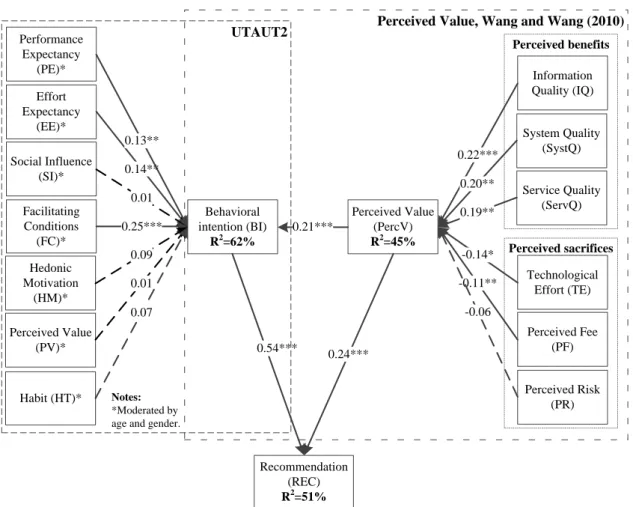
For this model t-statistics were computed, derived from bootstrapping (250 iterations), and it was found that not all direct effects were statistically significant (Figure 2). For instance, performance expectancy (β̂=0.13; p<0.05), effort expectancy (β̂=0.14; p<0.05), facilitating conditions (β̂=0.25; p<0.01), and perceived value (β̂=0.21; p<0.01) were statistically significant in explaining behavior intention of MHS, while social influence, hedonic motivation, price value, and habit were not. Concerning interaction effects, the only one that was statistically significant (Table 1) was age on social influence (β̂= -0.17; p<0.01).
In explaining the perceived value, all but perceived risk were statistically significant, i.e., information quality (β̂=0.22; p<0.01), system quality (β̂=0.20; p<0.05), service quality (β̂ = 0.19; p<0.05), technological effort (β̂= -0.14; p<0.1) and perceived fee (β̂= -0.11; p<0.05).
Both behavioral intention (β̂ = 0.54; p<0.01) and perceived value (β̂=0.24; p<0.01) were statistically significant in explaining recommendation.
6. Discussion
6.1. Theoretical implications
The conceptual model highlights the improvement of UTAUT2 to explain behavioral intentions of using MHS by incorporating perceived value. Previous literature has separately
acknowledged the relevance of both perceived value (Hsu and Lin, 2015) and UTAUT2 (Slade et al., 2015) to understand users’ intentions toward mobile applications and services. Additionally, both models have also been applied to understand tourists’ behavior (e.g., Wang and Wang, 2010; Morosan and Franco, 2016a, respectively). Yet this is the first study combining both UTAUT2 and perceived value toward an integrated model that better explains MHS acceptance by benefiting from encompassing constructs drawn from each of the original models. While some constructs of both models overlap (e.g., technological perceived effort; cost), UTAUT2 additionally focuses on performance, social influence and habit, whereas perceived value emphasizes the quality improvements and risks derived from using the new technology (Figure 1).
The pioneer nature of this study makes it difficult to directly compare the achieved results with previous studies. However, we used as a baseline the study by Wang and Wang (2010), who used the perceived value to understand MHS adoption. While the abovementioned authors collected their responses from tourists in Taiwan, as opposed to our study which is based on tourists staying in Portugal, both studies accounted for the relevance of information and system quality, the technological effort, and perceived cost. Moreover, the similarities between both studies extend to tourists neglecting risk, as in both cases the responses do not support the relevance of the perceived risk toward MHS adoption. As Wang and Wang (2010, p. 605) pointed out, “this contradicts prior research on online sales”. Therefore, the consistency between their study and the results presented here, especially by considering that both took place in two distinct tourism markets (Taiwan and Portugal), highlights this common trend in MHS of tourists failing to recognize the risk factor (also aligned with findings by Chung and Koo, 2015). As electronic attacks to mobile devices are increasing worldwide (Khan et al., 2015), it would be interesting to revisit such theme in the future to see if it persists or if tourists change their perception toward risk as attacks to MHS also increase.
When comparing to Wang and Wang’s (2010) study, the additional contributions stem from the UTAUT2: while there was partial support for the influence of performance in MHS adoption, both social influence and habit were found not to influence MHS. Such findings are consistent with earlier research in other areas, such as internet and mobile banking (e.g. Martins et al., 2014). This suggests that our respondents are not concerned about the opinion of others (family, friends, peers), nor about the price or the habit of usage to influence their use of MHS. Despite the relevance of Perceived Value, UTAUT2 shows a stronger influence on Recommendation of MHS. Facilitating conditions are very important for behavioral
intention of using MHS, and that is followed by both effort and performance expectancy within UTAUT2. Users are more focused on perceived benefits (namely information, system and service quality) of using MHS rather than on perceived sacrifices within the umbrella of perceived value.
6.2. Managerial implications
The findings presented in this study provide interesting insights to hotel managers. As it was pointed out in the previous section, there is an apparent uniformity on the factors that influence MHS adoption, independently of the tourism market. Although two specifically country-based studies (Wang and Wang’s, 2010, and ours) are insufficient to make a generalization, the similarities found in both studies, from two culturally distinct countries (Taiwan and Portugal) according to Hofstede’s dimensions (Hofstede et al., 2010), seem to have been influenced by today’s smaller and interconnected world. This suggests the conclusions drawn from this study can be transposed to other geographies. While further studies on this subject are in demand to prove or refute such generalization, managers can use the findings presented to support MHS investments in those two countries. These include: (1) assuring the right information is available in a timely way everywhere the guest desires, (2) addressing system quality issues, such as good functionality and appropriate video-presentation, instant connection, fast response, transaction and error-free processing as well as the compatibility of technologies, and (3) focusing on platforms that are as user-friendly and easy to use as possible, since both facilitating conditions and effort expectancy are important factors in the intention to use MHS. Since service quality is so important, hoteliers should focus on stressing customization ability to users’ specific needs, follow-up and high-quality services. For instance, the system could be configured in such a way as to maintain follow-up connection with clients by asking for a review or by presenting a questionnaire at the end of their stay. Moreover, the system could identify where customers are, and when powering their mobile phones in a specific area, the hotel would send a message asking if the client would be interested in a specific service which would help to improve customers’ service quality perception. Performance expectancy, specifically providing a useful mobile application that enables consumers to achieve more quickly tasks that are important to them and increase their productivity constitutes another relevant issue.
The business value of the current paper has also the potential to go beyond current mobile devices (smartphones/tablets). In fact, wearable computing technology being developed is seen as an extension of the mobile movement. As an illustrative example, the launch of
Apple’s first wearable, the Apple iWatch, shows that it already has a number of features that are of interest to hotel guests that underpin our research focus and findings. Examples of those features include getting directions to the hotel and checking guest reservation details.
6.3. Limitations and future research
Even though rigorous research procedures were used, this study has some limitations that could be addressed in future studies. Data collection was limited to Portugal, and the vast majority of respondents were college educated, and therefore more open to new technology and services. As maturity advances in MHS, research may be in-depth by adding more factors that might influence user intention and, in this more mature state, actual usage of MHS.
References
Ahn, T., Ryu, S., & Han, I. (2005). The impact of the online and offline features on the user acceptance of Internet shopping malls. Electronic Commerce Research and Applications, Vol. 3 No. 4, pp. 405-420.
Baptista, G., & Oliveira, T. (2015). Understanding mobile banking: The unified theory of acceptance and use of technology combined with cultural moderators. Computers in Human Behavior, Vol. 50, pp. 418-430.
Barnes, S. J., & Vidgen, R. (2001). An evaluation of cyber-bookshops: the WebQual method. International Journal of Electronic Commerce, Vol. 6 No. 1, pp. 11-30.
Calheiros, A. C., Moro, S., & Rita, P. (2017). Sentiment Classification of Consumer-Generated Online Reviews Using Topic Modeling. Journal of Hospitality Marketing & Management, Vol. 26 No. 7, pp. 675-693.
Carlson, J., O’Cass, A., & Ahrholdt, D. (2015). Assessing customers’ perceived value of the online channel of multichannel retailers: A two country examination. Journal of Retailing and Consumer Services, Vol. 27, pp. 90-102.
Chung, N., & Koo, C. (2015). The use of social media in travel information search. Telematics and Informatics, Vol. 32 No. 2, pp. 215-229.
Davis, F. D. (1989). Perceived usefulness, perceived ease of use, and user acceptance of information technology. MIS quarterly, pp. 319-340.
Dodds, W. B., Monroe, K. B., & Grewal, D. (1991). Effects of price, brand, and store information on buyers' product evaluations. Journal of marketing research, pp. 307-319.
Escobar-Rodríguez, T., & Carvajal-Trujillo, E. (2014). Online purchasing tickets for low cost carriers: An application of the unified theory of acceptance and use of technology (UTAUT) model. Tourism Management, Vol. 43, pp. 70-88.
Goodhue, D. L., & Thompson, R. L. (1995). Task-technology fit and individual performance. MIS Quarterly, pp. 213-236.
Grace Chen, Y., Chen, Z. H., Ho, J. C., & Lee, C. S. (2009). In-depth tourism's influences on service innovation. International Journal of Culture, Tourism and Hospitality Research, Vol. 3 No. 4, pp. 326-336.
Henseler, J., Ringle, C. M., & Sinkovics, R. R. (2009). The use of partial least squares path modeling in international marketing. Advances in international marketing, Vol. 20 No. 1, pp. 277-319.
Hofstede, G., Hofstede, G. J., & Minkov, M. (2010). Cultures and organizations: Software of the mind. Revised and expanded (3rd Edition). New York: McGraw-Hill USA.
Hsu, C. L., & Lin, J. C. C. (2015). What drives purchase intention for paid mobile apps?–An expectation confirmation model with perceived value. Electronic Commerce Research and Applications, Vol. 14 No. 1, pp. 46-57.
Jeong, M., Lee, M., & Nagesvaran, B. (2016). Employees’ use of mobile devices and their perceived outcomes in the workplace: A case of luxury hotel. International Journal of Hospitality Management, Vol. 57, pp. 40-51.
Jung, T., Chung, N., & Leue, M. C. (2015). The determinants of recommendations to use augmented reality technologies: The case of a Korean theme park. Tourism Management, Vol. 49, pp. 75-86.
Khan, J., Abbas, H., & Al-Muhtadi, J. (2015). Survey on Mobile User's Data Privacy Threats and Defense Mechanisms. Procedia Computer Science, 56, 376-383.
Kim, D. Y., Park, J., & Morrison, A. M. (2008). A model of traveller acceptance of mobile technology. International Journal of Tourism Research, Vol. 10 No. 5, pp. 393-407.
Kim, S. S., Malhotra, N. K., & Narasimhan, S. (2005). Research note—two competing perspectives on automatic use: A theoretical and empirical comparison. Information Systems Research, Vol. 16 No. 4, pp. 418-432.
Krishnaraju, V., Mathew, S. K., & Sugumaran, V. (2016). Web personalization for user acceptance of technology: An empirical investigation of E-government services. Information Systems Frontiers, pp. 1-17.
Kuo, N. T., Chang, K. C., Cheng, Y. S., & Lai, C. H. (2013). How service quality affects customer loyalty in the travel agency: The effects of customer satisfaction, service recovery, and perceived value. Asia Pacific Journal of Tourism Research, Vol. 18 No. 7, pp. 803-822. Law, R., Leung, R., Lo, A., Leung, D., & Fong, L. H. N. (2015). Distribution channel in hospitality
and tourism: Revisiting disintermediation from the perspectives of hotels and travel agencies. International Journal of Contemporary Hospitality Management, Vol. 27 No. 3, pp. 431-452. Limayem, M., & Hirt, S. G. (2003). Force of habit and information systems usage: Theory and initial
validation. Journal of the Association for Information Systems, Vol. 4 No. 1, pp. 65-67. Lin, T. C., & Huang, C. C. (2008). Understanding knowledge management system usage antecedents:
An integration of social cognitive theory and task technology fit. Information & Management, Vol. 45 No. 6, pp. 410-417.
Lu, H. Y., Wu, W. Y., & Chen, S. H. (2016). Influences on the perceived value of medical travel: the moderating roles of risk attitude, self-esteem and word-of-mouth. Current Issues in Tourism, Vol. 19 No. 5, pp. 477-491.
Martins, C., Oliveira, T., & Popovič, A. (2014). Understanding the Internet banking adoption: A unified theory of acceptance and use of technology and perceived risk application. International Journal of Information Management, Vol. 34 No. 1, pp. 1-13.
Morosan, C., & DeFranco, A. (2016a). It's about time: Revisiting UTAUT2 to examine consumers’ intentions to use NFC mobile payments in hotels. International Journal of Hospitality Management, Vol. 53, pp. 17-29.
Morosan, C., & DeFranco, A. (2016b). Co-creating value in hotels using mobile devices: A conceptual model with empirical validation. International Journal of Hospitality Management, Vol. 52, pp. 131-142.
Oechslein, O., Fleischmann, M., & Hess, T. (2014, January). An application of UTAUT2 on social recommender systems: Incorporating social information for performance expectancy. In 2014 47th Hawaii International Conference on System Sciences (pp. 3297-3306). IEEE.
Oh, H., Jeong, M., & Baloglu, S. (2013). Tourists' adoption of self-service technologies at resort hotels. Journal of Business Research, Vol. 66 No. 6, pp. 692-699.
Ozturk, A. B., Nusair, K., Okumus, F., & Hua, N. (2016). The role of utilitarian and hedonic values on users’ continued usage intention in a mobile hotel booking environment. International Journal of Hospitality Management, Vol. 57, pp. 106-115.
Palmer, J. W. (2002). Web site usability, design, and performance metrics. Information systems research, Vol. 13 No. 2, pp. 151-167.
Pascual-Miguel, F. J., Agudo-Peregrina, Á. F., & Chaparro-Peláez, J. (2015). Influences of gender and product type on online purchasing. Journal of Business Research, Vol. 68 No. 7, pp. 1550-1556.
Piccoli, G., Lui, T. W., & Grün, B. (2017). The impact of IT-enabled customer service systems on service personalization, customer service perceptions, and hotel performance. Tourism Management, Vol. 59, pp. 349-362.
Raman, A., & Don, Y. (2013). Preservice teachers' acceptance of learning management software: An Application of the UTAUT2 Model. International Education Studies, Vol. 6 No. 7, pp. 157-164.
Ranganathan, C., & Ganapathy, S. (2002). Key dimensions of business-to-consumer web sites. Information & Management, Vol. 39 No. 6, pp. 457-465.
Serrano, C. I., & Karahanna, E. (2016). The Compensatory Interaction Between User Capabiities and Technology Capabilities in Influencing Task Performance: An Empirical Assessment in Telemedicine Consultations. MIS Quarterly, 40(3), 597-621.
Sirdeshmukh, D., Singh, J., & Sabol, B. (2002). Consumer trust, value, and loyalty in relational exchanges. Journal of marketing, Vol. 66 No. 1, pp. 15-37.
Slade, E. L., Dwivedi, Y. K., Piercy, N. C., & Williams, M. D. (2015). Modeling consumers’ adoption intentions of remote mobile payments in the United Kingdom: extending UTAUT with innovativeness, risk, and trust. Psychology & Marketing, Vol. 32 No. 8, pp. 860-873.
Soltani, I., & Gharbi, J. E. (2009). Determinants and consequences of the website perceived value. The Journal of Internet Banking and Commerce, Vol. 13 No. 1, pp. 1-13.
Song, J. H., & Zinkhan, G. M. (2008). Determinants of perceived web site interactivity. Journal of Marketing, Vol. 72 No. 2, pp. 99-113.
Venkatesh, V., Morris, M. G., Davis, G. B., & Davis, F. D. (2003). User acceptance of information technology: Toward a unified view. MIS Quarterly, pp. 425-478.
Venkatesh, V., Thong, J. Y., & Xu, X. (2012). Consumer acceptance and use of information technology: extending the unified theory of acceptance and use of technology. MIS Quarterly, Vol. 36 No. 1, pp. 157-178.
Verma, R., Stock, D., & McCarthy, L. (2012). Customer preferences for online, social media, and mobile innovations in the hospitality industry. Cornell Hospitality Quarterly, Vol. 53, pp. 183-186.
Voss, G. B., Parasuraman, A., & Grewal, D. (1998). The roles of price, performance, and expectations in determining satisfaction in service exchanges. Journal of Marketing, pp. 46-61.
Wang, C. (2014). Antecedents and consequences of perceived value in Mobile Government continuance use: An empirical research in China. Computers in Human Behavior, Vol. 34, pp. 140-147.
Wang, D., Xiang, Z., & Fesenmaier, D. R. (2014). Adapting to the mobile world: A model of smartphone use. Annals of Tourism Research, Vol. 48, pp. 11-26.
Wang, H. Y., & Wang, S. H. (2010). Predicting mobile hotel reservation adoption: Insight from a perceived value standpoint. International Journal of Hospitality Management, Vol. 29 No. 4, pp. 598-608.
Wang, Y. S., Li, H. T., Li, C. R., & Zhang, D. Z. (2016). Factors affecting hotels' adoption of mobile reservation systems: A technology-organization-environment framework. Tourism Management, Vol. 53, pp. 163-172.
Wu, J. H., & Wang, S. C. (2005). What drives mobile commerce?: An empirical evaluation of the revised technology acceptance model. Information & management, Vol. 42 No. 5, pp. 719-729.
Wynne, C. W. (1998). Issues and Opinion on structural Equation Modelling. MIS Quarterly, Vol. 22 No. 1, pp. 1-8.
Yu, C. S. (2012). Factors affecting individuals to adopt mobile banking: Empirical evidence from the UTAUT model. Journal of Electronic Commerce Research, Vol. 13 No. 2, pp. 104-121.
Table 1 - The items.
Constructs Items Source
Performance expectancy (PE)
I find MHS useful in my daily life. PE1
Venkatesh et al. (2003), Venkatesh
et al. (2012)
Using MHS increases my chances of achieving things that are important to me. PE2 Using MHS helps me accomplish things more quickly. PE3 Using MHS increases my productivity. PE4
Effort expectancy (EE)
Learning how to use MHS is easy for me. EE1
Venkatesh et al. (2003), Venkatesh
et al. (2012)
My interaction with MHS is clear and understandable. EE2
I find MHS easy to use. EE3
It is easy for me to become skillful at using MHS. EE4 Social influence
(SI)
People who are important to me think that I should use MHS. SI1 Venkatesh et al. (2003), Venkatesh
et al. (2012)
People who influence my behavior think that I should use MHS. SI2 People whose opinions that I value prefer that I use MHS. SI3
Facilitating conditions (FC)
I have the resources necessary to use MHS. FC1
Venkatesh et al. (2003), Venkatesh
et al. (2012)
I have the knowledge necessary to use MHS. FC2 MHS is compatible with other technologies I use. FC3 I can get help from others when I have difficulties using MHS. FC4 Hedonic
motivation (HM)
Using MHS is fun. HM1
Kim et al. (2005)
Using MHS is enjoyable. HM2
Using MHS is very entertaining. HM3
Price value (PV)
MHS is reasonably priced. PV1
Dodds et al. (1991) MHS is a good value for the money. PV2
At the current price, MHS provides a good value. PV3
Habit (HT)
The use of MHS has become a habit for me. HT1
Limayem and Hirt (2003) I am addicted to using MHS. HT2
I must use MHS. HT3
Using MHS has become natural to me. HT4
Information quality (IQ)
I think MHS provides complete information. IQ1 Ahn et al. (2004), Barnes and Vidgen (2001), Palmer (2002), Ranganathan and Ganapathy (2002) I think MHS provides detailed information. IQ2
I think MHS provides timely information. IQ3 I think MHS provides reliable information. IQ4 I think MHS provides selective information for purchase. IQ5 I think MHS provides comparative information between hotel accommodations. IQ6
System quality (SystQ)
I think MHS could be connected instantly. SystQ1 Ahn et al. (2004), Barnes and Vidgen (2001), Palmer (2002), Ranganathan and Ganapathy (2002) I think MHS provides fast response and transaction processing. SystQ2
I can use MHS when I want to use it. SystQ3 I think MHS provides a good functionality relevant to hotel choices. SystQ4 I think MHS provides error-free transactions. SystQ5 I think MHS provides an appropriate video-audio presentation. SystQ6
Service Quality (ServQ)
I think MHS could anticipate and respond promptly to user request. ServQ1 Ahn et al. (2004), Barnes and Vidgen (2001), Palmer (2002), Ranganathan and Ganapathy (2002) I think MHS could be depended on to provide whatever is promised. ServQ2
I think MHS could understand and adapt to the user’s specific needs. ServQ3 I think MHS could provide follow-up service to users. ServQ4 I think MHS could give a professional and competence image. ServQ5
Technological effort (TE)
I think MHS provides a difficult navigation interface. TE1
Wu and Wang (2005) I think finding what I want via MHS is difficult. TE2
I think becoming skillful at using MHS is difficult. TE3 It is difficult to use MHS. TE4
Perceived fee (PF)
I think the access fee for using MHS is expensive. PF1
Voss et al. (1998) I think the transaction fee for using MHS is expensive. PF2
I think I cannot get a better price by using MHS. (dropped) PF3 The fee that I have to pay for the use of MHS is too high. PF4
Perceived risk (PR)
I think using MHS in monetary transactions has potential risk. PR1
Wu and Wang (2005), Kim and
Kim (2004) I think using MHS could not instill confidence in users and reduce uncertainty. PR2
I think using MHS could not keep sensitive personal information from exposure. PR3 I think using MHS puts my privacy at risk. PR4 Compared with other methods, using MHS has more uncertainties. PR5
Perceived value (PercV)
Compared to the fee I need to pay, the use of MHS offers value for money. PercV1
Sirdeshmukh et al. (2002) Compared to the effort I need to put in, the use of MHS is beneficial to me. PercV2
Compared to the potential risk I need to bear, the use of MHS is worthwhile to me. PercV3 Overall, the use of MHS delivers me good value. PercV4
Behavior intention (BI)
Assuming I have access to MHS, I intend to use it. BI1
Davis (1989), Venkatesh et al. (2003), Venkatesh
et al. (2012)
Given that I have access to MHS, I predict that I will use it. BI2 I intend to use MHS in the future. BI3 I predict I would use MHS in the future. BI4 I plan to use MHS in the future. BI5 Recommendation
(Rec)
I would recommend MHS. Rec1 Self-developed from literature I would you recommend MHS to a friend. Rec2
Table 2 - Loadings of the measurement model.
Construct Items Loading t-Statistic Construct Items Loading t-Statistic
Performance expectancy (PE) PE1 0.86 41.71 Information quality (IQ) IQ1 0.88 57.15 PE2 0.91 67.16 IQ2 0.88 71 PE3 0.9 80.32 IQ3 0.82 40.04 PE4 0.91 71.15 IQ4 0.82 36.53 Effort expectancy (EE) EE1 0.92 66.83 IQ5 0.78 24.37 EE2 0.93 86.91 IQ6 0.68 19.6 EE3 0.94 101.77 System quality (SystQ) SystQ1 0.82 32.26 EE4 0.92 75.04 SystQ2 0.83 44.82 Social influence (SI) SI1 0.97 162.45 SystQ3 0.76 30.74 SI2 0.97 176.72 SystQ4 0.83 40.68 SI3 0.96 131.68 SystQ5 0,71 20.33 Facilitating conditions (FC) FC1 0.9 69.56 SystQ6 0.81 33.41 FC2 0.86 34.9 Service Quality (ServQ) ServQ1 0.78 24.2 FC3 0.89 44.9 ServQ2 0.85 45.37 FC4 0.71 17.14 ServQ3 0.85 43.76 Hedonic motivation (HM) HM1 0.95 153.66 ServQ4 0.87 50.91 HM2 0.94 104 ServQ5 0.85 45.48 HM3 0.91 65.29 Technological effort (TE) TE1 0.71 12.85 Price value (PV) PV1 0.93 85.87 TE2 0.89 52.32 PV2 0.95 139.73 TE3 0.91 63.47 PV3 0.96 187.56 TE4 0.94 104.38 Habit (HT) HT1 0,89 73.75 Perceived fee (PF) PF1 0.93 76.85 HT2 0,84 29.37 PF2 0.93 66.67 HT3 0.8 24.72 PF4 0.93 96.05 HT4 0.9 82.66 Perceived risk (PR) PR1 0.79 25.21 Behavior intention (BI) BI1 0.92 82.65 PR2 0.85 39.15 BI2 0.94 103.9 PR3 0.85 32.22 BI3 0.96 163.22 PR4 0.85 30.82 BI4 0.93 85.99 PR5 0.82 33.47 BI5 0.93 86.59 Perceived value (PercV) PercV1 0.82 29.76 Recommendation (Rec) Rec1 0.99 653 PercV2 0.91 75.58 Rec2 0.99 616.08 PercV3 0.9 57.37 PercV4 0.91 76.08
Table 3 - Structural model results for UTAUT2 and UTAUT2+PercV. UTAUT2 UTAUT2+PercV D D+I D D+I Perceived Value R2 0.45 0.45 Adjusted R2 0.44 0.44 Information Quality 0.22*** 0.22*** System Quality 0.20** 0.20** Service Quality 0.19*** 0.19** Technological Effort -0.14* -0.14* Perceived Fee -0.11* -0.11** Perceived Risk -0.06 -0.06 Behavior Intention R2 0.54 0.60 0.56 0.62 Adjusted R2 0.53 0.56 0.55 0.58 Performance Expectancy 0.22*** 0.19*** 0.15** 0.13** Effort Expectancy 0.15** 0.18*** 0.11* 0.14** Social Influence 0.02 0.01 0.02 0.01 Facilitating Conditions 0.29*** 0.27*** 0.27*** 0.25*** Hedonic Motivation 0.09* 0.11** 0.06 0.09 Price Value 0.11* 0.06 0.04 0.01 Habit 0.08* 0.06 0.09* 0.07 Age -0.05 -0.06 Male 0.00 -0.04 Age*Male 0.09 0.11 Age * PE 0.09 0.08 Age * EE 0.04 0.06 Age * SI -0.17*** -0.17*** Age * FC -0.08 -0.10 Age * HM 0.04 0.05 Age * PV 0.09 0.08 Age * HT 0.05 0.04 Male * PE 0.19 0.20 Male * EE 0.09 0.12 Male * SI -0.15 -0.13 Male * FC -0.07 -0.49 Male * HM -0.21 -0.16 Male * PV 0.07 0.09 Male * HT -0.14 -0.18 Age*Male * PE -0.18 -0.19 Age*Male * EE -0.05 -0.08 Age*Male * SI 0.14 0.14 Age*Male * FC 0.05 -0.09 Age*Male * HM 0.23 0.17
Age*Male * PV 0.05 -0.19 Age*Male * HT -0.19 0.08 Perceived Value 0.23*** 0.21*** Recommendation R2 0.48 0.48 0.51 0.51 Adjusted R2 0.48 0.48 0.51 0.51 Perceived Value 0.24*** 0.24*** Behavioral Intention 0.69*** 0.69*** 0.54*** 0.54***
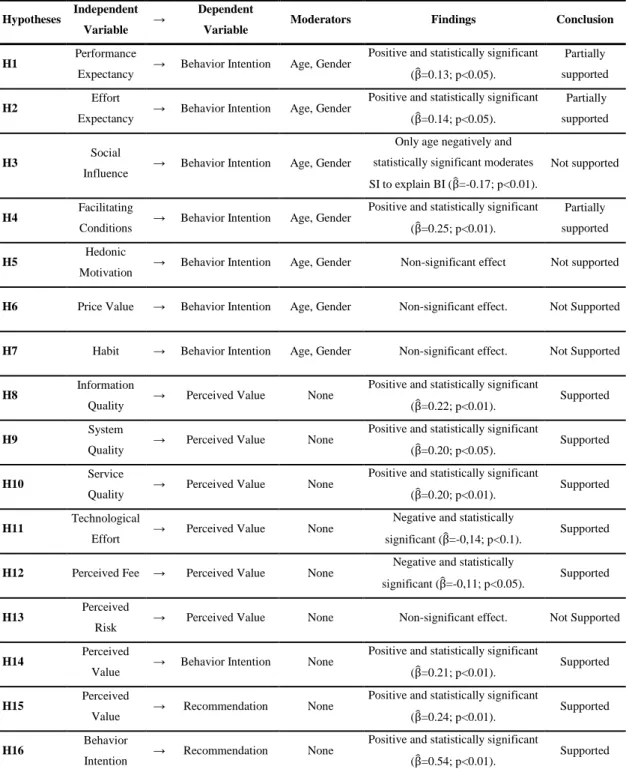
Table 4 - Hypotheses Testing.
Hypotheses Independent Variable →
Dependent
Variable Moderators Findings Conclusion
H1 Performance
Expectancy → Behavior Intention Age, Gender
Positive and statistically significant (β̂=0.13; p<0.05).
Partially supported
H2 Effort
Expectancy → Behavior Intention Age, Gender
Positive and statistically significant (β̂=0.14; p<0.05).
Partially supported
H3 Social
Influence → Behavior Intention Age, Gender
Only age negatively and statistically significant moderates SI to explain BI (β̂=-0.17; p<0.01).
Not supported
H4 Facilitating
Conditions → Behavior Intention Age, Gender
Positive and statistically significant (β̂=0.25; p<0.01).
Partially supported
H5 Hedonic
Motivation → Behavior Intention Age, Gender Non-significant effect Not supported
H6 Price Value → Behavior Intention Age, Gender Non-significant effect. Not Supported
H7 Habit → Behavior Intention Age, Gender Non-significant effect. Not Supported
H8 Information
Quality → Perceived Value None
Positive and statistically significant
(β̂=0.22; p<0.01). Supported
H9 System
Quality → Perceived Value None
Positive and statistically significant
(β̂=0.20; p<0.05). Supported
H10 Service
Quality → Perceived Value None
Positive and statistically significant
(β̂=0.20; p<0.01). Supported
H11 Technological
Effort → Perceived Value None
Negative and statistically
significant (β̂=-0,14; p<0.1). Supported
H12 Perceived Fee → Perceived Value None Negative and statistically
significant (β̂=-0,11; p<0.05). Supported
H13 Perceived
Risk → Perceived Value None Non-significant effect. Not Supported
H14 Perceived
Value → Behavior Intention None
Positive and statistically significant
(β̂=0.21; p<0.01). Supported
H15 Perceived
Value → Recommendation None
Positive and statistically significant
(β̂=0.24; p<0.01). Supported
H16 Behavior
Intention → Recommendation None
Positive and statistically significant
Performance Expectancy (PE)* Effort Expectancy (EE)* Social Influence (SI)* Facilitating Conditions (FC)* Behavioral intention (BI) Recommendation (REC) H2 H3 H4 H16 H8
Perceived Value, Wang and Wang (2010) UTAUT2 H1 Hedonic Motivation (HM)* Price Value (PV)* H5 H6 Habit (HT)* H7 Information Quality (IQ) System Quality (SystQ) Service Quality (ServQ) Technological Effort (TE) Perceived Fee (PF) Perceived Risk (PR) Perceived Value (PercV) H9 H10 H11 H12 H13 H14 H15 Perceived benefits Perceived sacrifices Notes: *Moderated by age and gender.
Performance Expectancy (PE)* Effort Expectancy (EE)* Social Influence (SI)* Facilitating Conditions (FC)* Behavioral intention (BI) R2=62% Recommendation (REC) R2=51% 0.14** 0.01 0.25*** 0.54*** 0.22***
Perceived Value, Wang and Wang (2010) UTAUT2 0.13** Hedonic Motivation (HM)* Perceived Value (PV)* 0.09 0.01 Habit (HT)* 0.07 Information Quality (IQ) System Quality (SystQ) Service Quality (ServQ) Technological Effort (TE) Perceived Fee (PF) Perceived Risk (PR) Perceived Value (PercV) R2=45% 0.20** 0.19** -0.14* -0.11** -0.06 0.21*** 0.24*** Perceived benefits Perceived sacrifices Notes: *Moderated by age and gender.
Note: In order to simplify, the figure presents only direct effects; *p < 0.10; **p < 0.05; ***p < 0.01; dashed lines indicate no statistical significance.