Doutoramento em Gestão de Informação
Doctorate Program in Information Management
NOVA Information Management School
Instituto Superior de Estatística e Gestão de Informação
DOCTORATE
PROGRAM
Information Management
Specialization in Geographical Information
Systems
Contributions for the improvement of
specific class mapping
Joel Dinis Baptista Ferreira da Silva
A thesis submitted in partial fulfilment of the
requirements for the degree of Doctor in Information
Management
November, 2016
Prof. Doutor Mário Caetano, Co-supervisor Prof. Doutor Fernando Bação, Co-supervisor
Contributions for the improvement of specific class mapping
Copyright © Joel Dinis Baptista Ferreira da Silva, Instituto Superior de Estatística e Gestão da Informação, Universidade Nova de Lisboa.
A NOVA Information Management School e a NOVA University of Lisbon têm o direito, perpétuo e sem limites geográficos, de arquivar e publicar esta dissertação através de exemplares impressos reproduzidos em papel ou de forma digital, ou por qualquer outro meio conhecido ou que venha a ser inventado, e de a divulgar através de reposi-tórios científicos e de admitir a sua cópia e distribuição com objetivos educacionais ou de investigação, não comerciais, desde que seja dado crédito ao autor e editor.
This document was created using the (pdf)LATEX processor, based in the “unlthesis” template[1], developed at the Dep. Informática of FCT-NOVA [2].
When solving a problem of interest, do not solve a more general problem as an intermediate step - Vladimir Vapnik
Ac k n o w l e d g e m e n t s
A few lines are too short to make a complete account of my deep appreciation for my supervisors. To Professor Mário Caetano and Professor Fernando Bação, I wish to thank them for their trust and encouragements which have been essential throughout these four years. Thank you for being an enthusiastic and sagacious individuals who provided me a sound support. And I also wish to thank Professor Giles Foody. Al-though I have never met him personally, he has always provided great insights and replies to my often annoying e-mails.
I am indebted to my friends and colleagues from NOVA IMS for providing me a good environment in which to work. I am grateful to Professor Marco Painho, Tiago Oliveira, Luis Almeida, Alexandre Baptista, Cleiton Rodrigues, Otávio Sian, Ângela Santos, Rita Ferreira and Raquel Silva.
I wish to thank to my aunt Guida, to my mother Mina, to my sister Maria and to my father Luis for their encouragements throughout my graduate work. And finally I wish to thank to my girlfriend and partner Raquel for her love and support.
A b s t r a c t
The analysis of remotely sensed imagery has become a fundamental task for many environmental centred activities, not just scientific but also management related. In particular, the use of land cover maps depicting a particular study site is an integral part of many research projects, as they are not just a fundamental variable in environ-mental models but also base information supporting policy decisions.
Land cover mapping assisted by supervised classification is today a staple tool of any analyst processing remotely sensed data, insomuch as these techniques allow users to map entire sites of interest in a comprehensive way.
Many remote sensing projects are usually interested in a small number of land cover classes present in a study area and not in all classes that make-up the landscape. When focus is on a particular sub-set of classes of interest, conventional supervised classification may be sub-optimal for the discrimination of these specific target classes.
The process of producing a non-exhaustive map, that is depicting only the classes of interest for the user, is called specific class mapping.
This is the topic of this dissertation. Here, specific class mapping is examined to understand its origins, developments, adoption and current limitations. The main research goal is then to contribute for the understanding and improvement of this topic, while presenting its main constrains in a clear way and proposing enhanced methods at the reach of the non-expert user. In detail, this study starts by analysing the definition of specific class mapping and why the conventional multi-class supervised classification process may yield sub-optimal outcomes.
Attention then is turn to the previous works that have tackled this problem. From here a synthesis is made, categorising and characterising previous methodologies. Its then learnt that the methodologies tackling specific class mapping fall under two broad categories, the binarisation approaches and the singe-class approaches, and that both types are not without problems. This is the starting point of the development component of this dissertation that branches out in three research lines.
First, cost-sensitive learning is utilised to improve specific class mapping. In previ-ous studies it was shown that it may be susceptible to data imbalance problems present in the training data set, since the classes of interest are often a small part of the training set. As a result the classification may be biased towards the largest classes and, thus, be
In this approach errors committed in the minority class are treated as being costlier than errors committed in the majority class. Cost-sensitive approaches are typically implemented by weighting training data points accordingly to their importance to the analysis. By shifting the weight of the data set from the majority class to the minority class, the user is capable to inform the learning process that training data points in the minority class are as critical as the points in the majority class. The results of this study indicate that this simple approach is capable to improve the process of specific class mapping by increasing the accuracy to which the classes of interest are discriminated.
Second, the combined use single-class classifiers for specific class mapping is ex-plored. Supervised algorithms for single-class classification are particularly attractive due to its reduced training requirements. Unlike other methods where all classes present in the study site regardless of its relevance for the particular objective to the users, single-class classifiers rely exclusively on the training of the class of interest. However, these methods can only solve specific classification problems with one class of interest. If more classes are important, those methods cannot be directly utilised. Here is proposed three combining methodologies to combine single-class classifiers to map subsets of land cover classes. The results indicate that an intelligent combination of single-class classifiers can be used to achieve accurate results, statistically non-inferior to the standard multi-class classification, without the need of an exhaustive training set, saving resources that can be allocated to other steps of the data analysis process
Third, the combined use of cost-sensitive and semi-supervised learning to improve specific class mapping is explored. A limitation of the specific class binary approaches is that they still require training data from secondary classes, and that may be costly. On the other hand, a limitation of the specific class single-class approaches is that, while requiring only training data from the specific classes of interest, this method tend to overestimate the extension of the classes of interest. This is because the classifier is trained without information about the negative part of the classification space. A way to overcome this is with semi-supervised learning, where the data points for the negative class are randomly sampled from the classification space. However that may include false negatives. To overcome this difficult, cost-sensitive learning is utilised to mitigate the effect of these potentially misclassified data points. Cost weights were here defined using an exponential model that assign more weight to the negative data points that are more likely to be correctly labelled and less to the points that are more likely to be mislabelled. The results show that accuracy achieved with the proposed method is statistically non-inferior to that achieved with standard binary classification requiring however much less training effort.
Keywords: Remote sensing; land cover mapping; specific class mapping; cost-sensitive learning; semi-supervised learning; single-class learning
R e s u m o
A analise de imagens de satélite tornaram-se uma peça fundamental em diversas apli-cações de cariz ambiental, não só científicos, mas também administrativos. Em particu-lar, a utilização de mapas de ocupação do solo é uma componente integral em muitos projetos de investigação, devido não só à sua utilização como parâmetro em modelos ambientais, mas também como informação base ao apoio a decisões politicas.
Contudo, em muitos destes projetos, os utilizadores estão tipicamente interessados num pequeno subconjunto das classes presentes na sua área de estudo e não numa completa caracterização. Nestes casos, o uso de métodos convencionais de classificação assistida podem não ser ótimos para a discriminação dessas classes de interesse. A este processo de classificação não exaustiva chama-se mapeamento de classes especificas.
Este é o tópico desta dissertação. Nesta analise, o conceito de mapeamento de classes especificas é examinado de forma a melhor compreender as suas origens, de-senvolvimentos, adoção e limitações. O objetivo principal desta dissertação é assim contribuir para o entendimento e melhoramento deste tópico, apresentando as suas principais condicionantes de uma forma clara, propondo métodos melhorados ao al-cance do utilizador médio.
Este estudo começa por analisar a definição do conceito de mapeamento de classes especificas e a razão pela qual os métodos de classificação assistida convencionais podem não ser apropriados.
Seguidamente, é realizada uma análise aos estudos anteriormente desenvolvidos que exploraram este tema. Daqui é feita a síntese, caracterizando e categorizados as metodologias anteriores.
Deste exame resulta que as metodologias de mapeamento de classes especificas encaixam-se em dois grandes grupos, abordagens de binarização e abordagens mono-classe, e que ambos têm vantagens e desvantagens. Daqui ramificam-se as linhas de investigação que se dividem em três.
Na primeira, é utilizada uma metodologia de aprendizagem cost-sensitive para me-lhorar o mapeamento de classes especificas por binarização. Estudos anteriores de-monstraram que a abordagem por binarização conduzir a classificadores treinados com dados desbalanceados uma vez que as classes de interesse são tipicamente apenas uma pequena componente no conjunto de treino. Como resultado, a classificação pode
é então utilizada para balançar o conjunto de treino. Com esta abordagem os erros cometidos na classe minoritária são mais caros que aqueles cometidos na classe maiori-tária. Estas abordagem são usualmente implementadas fazendo associar a cada ponto um peso que representa o custo em classificar erroneamente esse ponto. Desta forma é possível guiar o processo de aprendizagem de forma a não sacrificar os pontos da classe minoritária para minimizar o erro de classificação global. Os resultados deste estudo indicam que esta abordagem foi capaz de ultrapassar os problemas de desba-lanceamento e produzir um mapa com as classes de interesse exato.
Na segunda linha, é explorada a combinação de classificadores monoclasse para o mapeamento de classes especificas. Os classificadores monoclasse são particularmente atrativos porque só necessitam de dados da classe para o qual estão a ser treinados. Contudo, estes classificadores não conseguem classificar problemas com mais que uma classe. Se houver mais que uma classe de interesse, estes métodos não podem ser aplicados diretamente. Neste estudo são propostas três formas de combinar múltiplos classificadores monoclasse para mapear um subconjunto de classes de interesse. Estas abordagens foram comparadas com a abordagem assistida convencional. Os resultados indicam que uma combinação inteligente de classificadores monoclasse podem ser utilizados para mapear diversas classes de interesse sem perda de exatidão, requerendo, contudo, apenas treino para as classes de interesse.
Na terceira linha de investigação, o uso combinado da aprendizagem cost-sensitive com aprendizagem semi-assistida é explorado com o objetivo de melhorar o mapea-mento de classes especificas. Uma limitação com as abordagens de binarização é que apesar de direcionada para a discriminação de classes de interesse requerem ainda treino para todas as classes, independentemente de serem ou não de interesse, o que pode ser dispendioso. Por outro lado, as abordagens monoclasse apesar de necessita-rem de treino apenas para as classes de interesse tendem sobrestima-las. Isto acontece porque os classificadores monoclasse são treinados sem acesso a informação da parte negativa do espaço de classificação. Uma forma de ultrapassar estas dificuldades é recorrendo à aprendizagem semi-assistida, onde os pontos representando treino das classes sem interesse são obtidos por meio de uma amostragem e seguidamente são rotulados como negativos. Contudo, esse processo pode incluir falsos negativos no conjunto de treino. Para minimizar os efeitos destes potenciais falsos negativos, uma abordagem cost-sensitive é utilizada. Os pesos associados a estes pontos refletem a probabilidade de serem um falso negativo, de modo a que pontos com elevada proba-bilidade recebem menos peso e pontos com baixa probaproba-bilidade recebem mais peso. Os resultados indicam que este método combinado é estatisticamente não inferior ao benchmark, requerendo, contudo, muito menos treino.
Palavras-chave: Deteção remota; mapas de ocupação de solo; mapeamento de classes específicas; apredizagem cost-sensitive; aprendizagem semi-assistida; aprendizagem monoclasse
C o n t e n t s
List of Figures xxi
List of Tables xxv
Acronyms xxvii
1 Introduction 1
1.1 Motivation and research lines . . . 1
1.2 Document organisation . . . 3
1.3 Papers originated from this thesis . . . 4
1.4 Note about notation . . . 4
2 Literature review 7 2.1 Introduction . . . 7
2.2 Specific class mapping . . . 9
2.3 Analysis of previous works . . . 11
2.4 Synthesis of the previous works . . . 18
2.5 Conclusion . . . 20
3 Methodological background 23 3.1 Introduction . . . 23
3.2 Support vector machines . . . 24
3.2.1 Soft margin support vector machines . . . 24
3.2.2 Introducing the kernel trick . . . 26
3.2.3 Adapting SVM to multi-class classification problems . . . 28
3.2.4 One-class support vector machines . . . 30
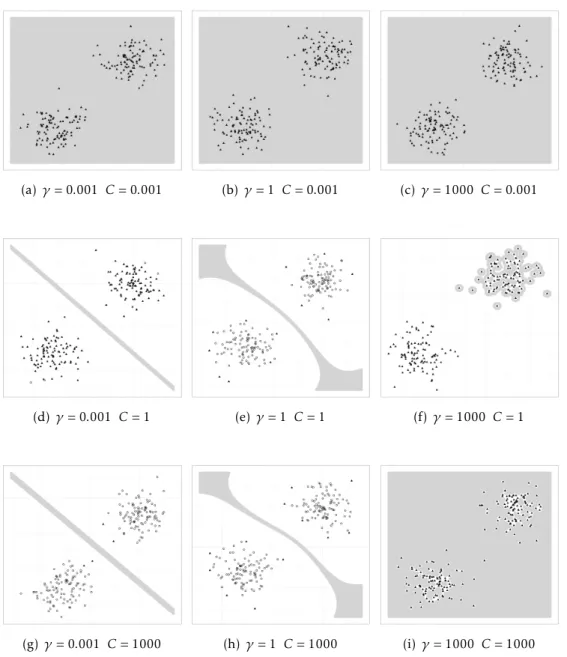
3.2.5 Model selection of support vector machines . . . 32
3.3 Accuracy metrics for binary classification . . . 38
3.4 Comparing the accuracy of classifiers . . . 42
3.5 Conclusion . . . 45
4 Improving specific class mapping by cost-sensitive learning 47 4.1 Introduction . . . 48
4.2.1 Weighted support vector machine . . . 53
4.2.2 Combining binary classifiers. . . 54
4.2.3 Comparison and evaluation of classifiers . . . 56
4.3 Data and methods . . . 57
4.4 Results and discussion . . . 62
4.5 Summary and conclusions . . . 66
5 Combined use one-class classifiers for specific class mapping: An experi-ment with forest classification 69 5.1 Introduction . . . 69
5.2 Background . . . 72
5.2.1 One-class classification . . . 72
5.2.2 Fine tuning one-class classifiers . . . 73
5.2.3 Combining decisions . . . 74
5.3 Data and methods . . . 74
5.3.1 Study sites . . . 74
5.3.2 Data. . . 75
5.3.3 Experiments . . . 76
5.3.4 Accuracy assessment and comparison . . . 78
5.4 Results and discussion . . . 80
5.5 Conclusion . . . 84
6 Specific land cover class mapping by semi-supervised weighted support vector machines 85 6.1 Introduction . . . 85
6.2 Background . . . 89
6.2.1 Bias SVM and weighted SVM . . . 89
6.2.2 One-class SVM . . . 90
6.2.3 Free-parameter tuning . . . 91
6.3 Methods . . . 93
6.3.1 Study area . . . 93
6.3.2 Remotely sensed data and training set . . . 94
6.3.3 Experiments . . . 94
6.3.4 Classification accuracy and comparison . . . 96
6.4 Results and discussion . . . 97
6.5 Conclusions . . . 100
7 Final remarks 101
L i s t o f F i g u r e s
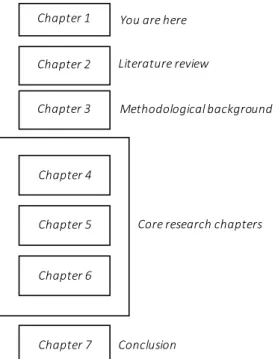
1.1 Diagram representing this document structure. . . 3
3.1 Soft margin support vector machine. The margin is maximum distance between the discriminate plane and the training data points. However, some points not correctly discriminated. . . 25
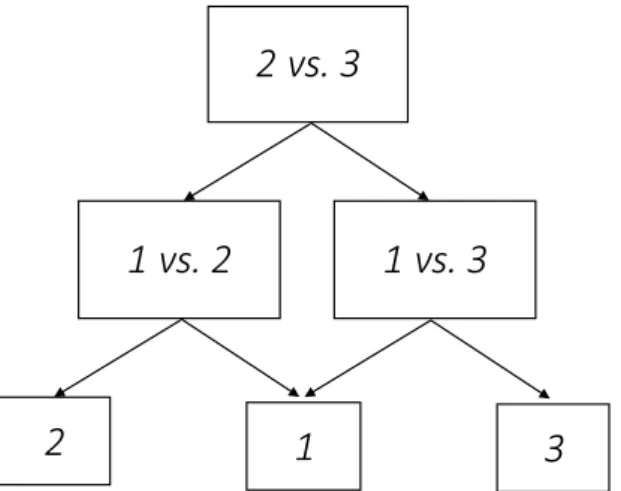
3.2 The directed acyclic graph approach to the application of Support Vector Machines (SVM) to multi-class problems. Here a 3-class problem. . . 30
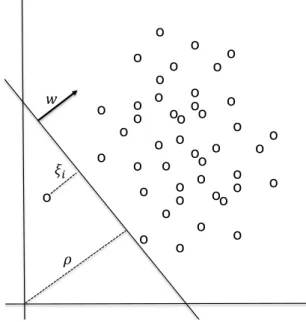
3.3 One class support vector machine. The origin is treated as the only available member of the non-target class. The vector w is normal to the separating hyperplane. . . 31
3.4 Two linearly separable classes, the positives and the negatives, artificially generated. Full triangles represent the support vectors and circles represent other data points. The centre of the positive class (1,1) and the centre of the negative class is (5,5). Variance of both classes is 0.5I where I is the identity matrix. The grey are represents the region where decision is made with a difference not superior to 5%, that is |p+− p−| < 0.05 where p+is the probability of a point to belong to the positive class and p−is the probability of a point to belong to the negative class. . . 34
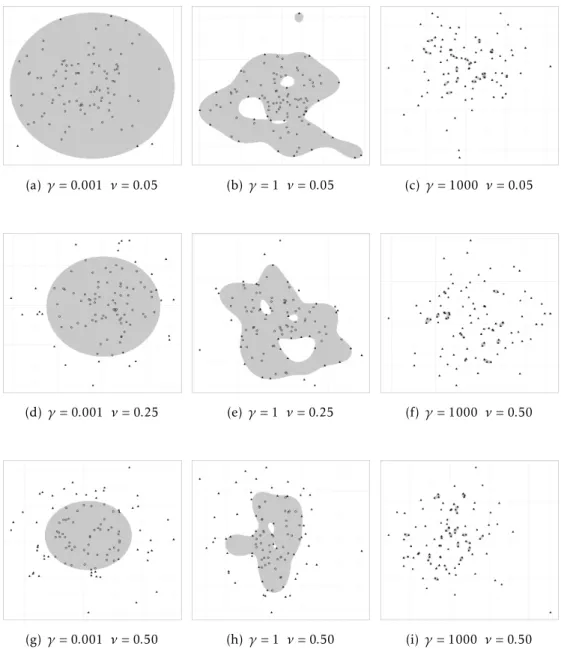
3.5 An artificially generated class. Circles represent points and full triangles the support vectors. The centre of the positive class (1,1) and variance is 0.5I where I is the identity matrix. The grey regions represent the regions classified as class of interest. . . 37
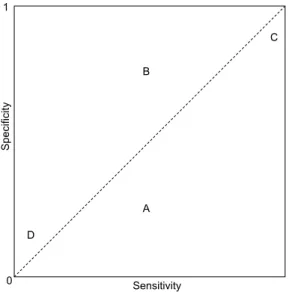
3.6 Graphical representation of sensitivity and specificity. The dashed line represents the 1:1 line. Note that if a point is located on the 1:1 line, this indicates that sensitivity is equal to specificity. Points above the 1:1 line indicates that specificity is larger than sensitivity; and points bellow 1:1 line indicates specificity is smaller that sensitivity. Points A, B, C and D represent the hypothetical performances of four classifiers. . . 40
3.7 Scenarios to illustrate the interpretation of confidence intervals of the dif-ference between proportions. The grey are represents the region of indif-ference. . . 43
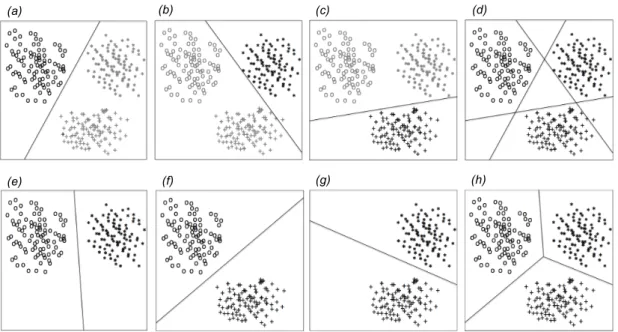
4.1 Binary decomposition of multi-class problem. The frames represent the scatter plot in the feature space of three different classes: circles, stars and crosses. Top row: OVR strategy. Bottom row: OVO strategy. . . 55
4.2 Saloum river delta in Senegal. . . 58
4.3 Illustration of the effects of data imbalance in the training data set with different degrees of balance ratios. The data set was generated artificially and represents a purposely simple classification problem, projected in the feature space. The minority class represented with crosses and the majority class represented with circles. Straight line is the discrimination plane gen-erated with the non-weighted approach. Dashed line is the discrimination plane generated with the weighted approach. In frame (a) balance ratio is 1:2, in frame (b) is 1:3, in frame (c) is 1:5 and in frame (d) is 1:10. . . . . 62
4.4 Binary map showing the areas of high-mangrove (white) and no-high-mangrove (black) classified by the SSVM frame (a) and the FOVO frame (b).. . . 65
5.1 The three study areas located in continental Portugal. . . 75
5.2 (a) second experiment based on OVA strategy; (b) third experiment based on OVO strategy; (c) fourth experiment based on DDAG. X represents a generic pixel and Y the output of the process. 1 represents the first class (deciduous) of interest and 2 represents the second class of interest (coniferous) and 1 vs 2 represents a binary classifier discriminating class of interest 1 from class of interest 2. The minus signal represents the set of pixels that are neither class 1 nor class 2. . . 77
5.3 The overall accuracy and the respective 95% confidence interval of each method in each study site. . . 80
5.4 Difference test results based on 95% confidence interval on the estimated difference in classification accuracy from the benchmark. Note that the re-gion of interest ranges from -2% to +2%. These are the maximum allowed differences between the tested methods and the benchmark. Intervals con-tained in the region of interest indicates, at 0.025 level of significance, that the proposed methods are non-inferior to the benchmark. . . 81
5.5 Sensitivity and specificity of each method in each study site (in parenthe-sis). Frame (a) represents the sensitivity versus specificity of all methods regarding the classification of deciduous class. Frame (b) represents the same thing but regarding the classification of coniferous class. The dashed line represents the 1:1 straight line. Thus the more a method is close to the top-right corner (more sensitivity and more specificity), the better it is classifying the class of interest. . . 82
List of Figures
6.2 The overall accuracies of each method and their respective 95% confidence interval. . . 97
6.3 Sensitivity and specificity of each method under analysis. The dashed line represents the 1:1 line. . . 99
L i s t o f Ta b l e s
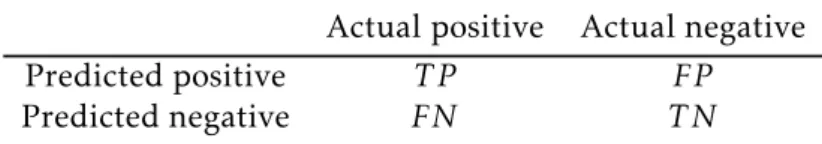
3.1 A 2 × 2 confusion matrix. . . 38
3.2 McNemar 2 × 2 confusion matrix comparing the results of two classifiers. 0 represents incorrect testing data point and 1 represents correct testing data point. p00 represents the proportions of testing data points where both classifiers made incorrect predictions, p11represents the proportions of testing data points where both classifiers made correct predictions, p01 represents the proportions of testing data points where the first classifier made an incorrect prediction but the second predicted correctly, and p10 represents the proportions of testing data points where the second classifier made an incorrect prediction but the first predicted correctly. . . 44
4.1 Binary confusion matrix. . . 56
4.2 Summary of the different experiments: experiments with (*) indicate bench-mark. Exper. stands for experiment, Imbal. for Imbalanced, Cost-sens. for Cost-sensitive and Strat. for strategy. SSVM represents the standard use of SVM; FSVM represents the focused approach with SVM; FOVO represents the focused approach with cost-sensitive and OVO; and FOVR the focus approach with cost-sensitive and OVR. . . 59
4.3 Parameterisation using focused approach. . . 60
4.4 Parameterisation and weights for each pair of classes: using OVO strategy and using OVR strategy. . . 61
4.5 Summary of the accuracy results in percentage obtained with each experi-ment. OA stands for overall accuracy, Ss. for sensitivity and Sp. for speci-ficity for each class of interest. . . 63
4.6 95% confidence interval (CI) on the estimated difference in overall accuracy obtained between the approaches. Results are presented in percentage and decision is done at 5% level of significance . . . 66
5.1 Composition of the each study site. Results are presented in percentage. Others represent the class of land cover types that are neither deciduous nor coniferous forest. . . 75
5.2 Parameterisation of the multi-class SVM for each study site. . . 76
5.4 Parameterisation of the SVM for methods 2 (deciduous vs. coniferous) and OCSVM for method 3 (interest vs. no-interest). . . 78
Ac r o n y m s
BM Benchmark.
BSVM Biased Support Vector Machines. DAG Directed Acyclic Graph.
DDAG Decision Directed Acyclic Graph. FN False Negative.
FOVO Focused One-vs-One. FOVR Focused One-vs-Rest. FP False Positive.
FSVM Focused Support Vector Machines. GLOVIS Global Visualization Viewer.
HM High Mangrove.
KKT Karush-Kuhn-Tucker.
LM Low Mangrove.
NDVI Normalised Difference Vegetation Index. OCSVM One-Class Support Vector Machines.
OVA One-vs-All.
OVO One-vs-One.
OVR One-vs-Rest.
SSVM Standard Support Vector Machines. SVDD Support Vector Data Description. SVM Support Vector Machines.
TN True Negative.
TP True Positive.
UNESCO United Nations Educational, Scientific and Cultural Organization. USGS United States Geologic Survey.
C
h
a
p
t
e
r
1
I n t r o d u c t i o n
1.1
Motivation and research lines
Remote sensing is today an integral part of any Earth science and the information derived from remotely sensed data is utilised in a multitude of applications. In partic-ular, the supervised classification of satellite imagery is of upmost importance, since land cover maps are an important component in many environment research activities, but also for managerial purposes. Thus the number of different types of users and applications is vast and so are their requirements. Although land cover maps that characterise an entire region of analysis are necessary and satisfy particular needs, often users are only interested in a subset of classes present in the region and not on its entire characterisation.
Specific class mapping consists in producing a non-exhaustive thematic map. This contrasts with the conventional mapping process that produces a thematic land cover map depicting all classes thereof present, and thus exhaustively characterising it. The goals of specific class mapping is, then, to depict only a subset of land cover classes of interest present in the study area.
The broad objective of this research is to investigate the usefulness and limita-tions of specific class mapping processes and explore possible ways to improve it with machine learning methodologies.
When users are interested in just a subset of classes present in the study area, of-ten users adopt a conventional supervised classification methodology. In other words, users produce a map depicting all classes regardless of their interest for their applica-tion. Indeed, users solve a large problem than that they need to solve. If the specific class mapping problem is solved by tackling it as a larger problem, that is by mapping
all classes instead of just those of interest, users may obtain sub-optimal results. Addi-tionally, this solution may force users to allocate extra time to collect training pixels to classes of no relevance for theirs objective, thus making the mapping process less efficient.
However, applying a conventional supervised approach to solve the specific class mapping problem directly leads to two technical problems. First, most learning rithms require an exhaustive definition of the study area. In other words, the algo-rithms of classification assume that the training data set utilised to inform the learning of the classifier represents an partition of the space to be classified. If this require-ment is not fulfilled, pixels belonging to untrained classes are allocated to classes represented in the training set. Second, with conventional classification methods the aim is to minimise the general misclassification rate but not necessarily to optimally discriminate the classes of interest. This is because the model that best discriminates the classes of interest may induce classification errors between classes of no interest and thus may not minimise the general misclassification rate.
Specific class mapping has been tackled before, essentially in two different ways. The first way is by binarisation. That is, the multi-class problem is broken down in smaller binary classification problems. Typically this is done by combining every class of no interest in one single nominal class, usually called "others". The second way is by single-class learning. In other words, by developing a classifier utilising only data from the class of interest and thus focusing the entire process on that particular class. However, these approaches are not without problems.
The main difficulties with the binarisation approach are essentially four. First, by agglomerating all classes of no interest in one big nominal class, the resulted class composition may lead to data imbalanced related issues. As consequence, it may bias the learning process toward this big class, underestimating the extension of the classes of interest. Second, if two or more classes are of interest, classifier combination schemes have to be utilised, which may not always be a trivial matter. Third, the free parameters definition have to be focused on the discrimination of the classes of interest. If such is not done, it is not guaranteed that the resulted classifier is optimally defined for the identification of these classes. Fourth, from the operational point of view, a user has to collect training data for all classes present in the region of interest. Thus, in this sense, the training requirements are similar to that of the conventional multi-class supervised methods.
On the other hand, the main difficulties with the single-class approach are essen-tially two. First, since the only available training data are points from the class of interest, it is not possible to compute the classification accuracy to fix the free param-eters. The only possible metric is sensitivity, which only represents one side of the problem. Thus, fine tuning such algorithm may be difficult. Second, if focus is in more than one class of interest, it is necessary the combination of multiple classifiers, which for this type of classifiers is not clear how and is still an on-going research topic. In
1.2. DOCUMENT ORGANISATION Chapter 1 Chapter 2 Chapter 3 Chapter 4 Chapter 5 Chapter 6 Chapter 7 Core research chapters You are here Literature review Methodological background Conclusion
Figure 1.1: Diagram representing this document structure.
general, the difficulties faced by this approach is a consequence of its attractive point, that is the limited need of training and focused approach to the class of interest.
This the starting point of this research. From here three research lines branch out. First, the effects of data imbalanced that may occur in specific class mapping when adopting a binarisation approach is understood and explored and cost-sensitive learning is utilised to minimise its effects. Second, the combined use single-class classifiers with the intention to apply to a specific class mapping scenario is examined and combination schemes are tested for its viability. Third, the combination of semi-supervised learning and cost-sensitive learning is combined to improve the process of specific class mapping.
1.2
Document organisation
The dissertation is composed by six chapters.
Chapter 1, the one the reader is presently reading, summarises the research context, goals and main motivations. Subsection1.1 Motivation and research lines provides a brief characterisation of this dissertation.
Chapter 2 presents the literature review in a digested form, since the core chapters, that is chapters 4, 5, and 6, provide a more specific reviews.
Chapter 3 elaborates, with different degrees of detail, the most important technical concepts that base this research. In other words, concepts support vector machines, one-class support vector machines, and the particularities of how to tune and compare different classifiers are presented in a contained way. This chapter is long and may
be technically dense. However, the reader will find all the necessary elements to fully understand the most technically challenge parts of the core chapters.
Chapters 4, 5, and 6 are the core of this research. They are composed by three standalone manuscripts submitted (at the writing time) in Peer-Reviewed Journals. Their order is not arbitrary in the sense that they are organised as a progression in the research process. Chapter 3 for example starts where previous research on specific class mapping ended, and resumes it tackling its limitations. Chapter 4 learns from the previous chapter and improves it, and the same happens with chapter 5. These three documents share the same structure. They first start with an introduction to the problem and how that work is a follow up of previous analysis. Then a detailed background analysis is undertaken to inform the reader about the most important concepts that sustain the methodological approach. However, if the reader has read chapter 3, this part may be omitted for time saving reasons. Next the data and methods section, where the data employed in the study is described and the methodological steps are explained. The chapters end with a result and discussion section, to explain the most important results of the analysis and with a summary and conclusion.
Chapter 7 presents the overarching final remarks of this work, highlighting the more important results and possible follow ups of this research thematic.
1.3
Papers originated from this thesis
Three papers were originated from this thesis:
1. Silva, J., Dieng, M., Bacao, F., Foody, G., and Caetano, M. Improving specific class mapping by cost-sensitive learning, submitted to International Journal of Remote Sensing.
2. Silva, J., Bacao, and Caetano, M. Combined use one-class classifiers for specific class mapping: An experiment with forest classification, submitted to International Journal of Digital Earth.
3. Silva, J., Bacao, and Caetano, M. Specific land cover class mapping by semi-supervised weighted support vector machines, submitted to Remote Sensing.
1.4
Note about notation
Vectors are represented with bold lowercase letter (latin or greek), for example x. Vec-tors with subscript, like xi, means the i-th vector and not the i-th element of the vector x. To represent thei-th element of the vector x it is used xi. Matrices are represented
with bold uppercase letter (latin or greek), for example X. The (i,j) element of X is represented as Xij. Scalars are represent with normal (i.e. not bold) lowercase letter
1.4. NOTE ABOUT NOTATION
(latin or greek), for example x. For summation notation, Pi,j represents the double summation PiP
C
h
a
p
t
e
r
2
L i t e r a t u r e r e v i e w
Abstract Remote sensing is an important source of data for the production of land cover maps. Particularly important is the supervised classification methodology that allow users to produce maps that meet their specific research goals. In this chapter specific class mapping is defined and the literature review about this topic is presented. The purpose here is not to present a technically explicit description of the concepts and methods, but rather present a short account of these two elements in the remote sensing context. In other words, how they came to be recognised as relevant, defined and what are the main advances in the process of remotely sensed data classification, concerning the classification of specific classes. From the literature, it was possible to organise the different approaches in two boarder categories: the binarisation meth-ods and the single-class methmeth-ods. The main advantages and disadvantages of each approach are highlighted. It was possible to identify that the process of specific class mapping also require the incorporation of specific accuracy metrics and that bias, to and against, the class of interest may occur in the process.
2.1
Introduction
The land cover is the observed biophysical cover on the Earth’s surface, and is key for environmental information [60]. The information provided associated to land cover is utilised in many scientific domains, resource management and policy purposes, and for a range of human activities [107], since it is the manifestation of the local climate, landforms and of the human use of land [25].
Remote sensing data is an important source of land cover information and has been extensively used to map and monitor land cover classes over time in order to fulfil a variety of of scientific and managerial purposes [107]. And supervised classification,
in particular, has been frequently used to derive thematic maps depicting the land cover classes present in the study area from remotely sensed data. Indeed, remotely sensed data classification evolved with the development of the computational domain typically known as machine learning. In early studies, the most commonly utilised methods where parametric, like the maximum likelihood classifiers or unsupervised like K-means and ISODATA [100]. In the 1990s, non-parametric learning algorithms became an option for remote sensing users and the number of studies utilising decision trees and neural networks increased [36]. These approaches do not make any assump-tion about data distribuassump-tion, unlike the parametric classifiers, where it is required the data to be normally distributed. Recent studies where different data sources are utilised also favoured non-parametric methodologies like the support vector machines and the random forest algorithm [36]. The utilisation of these more sophisticated methods was facilitated by the adoption of free software solutions and open source environments such R and Python.
Supervised methods require the user to collect a set of pixels of known class. In general, a training data set is such that:
1. It should have a sufficient number of independent training data points for each land-cover class [112];
2. It should be exhaustive, in the sense that it should contain samples describing all classes and preferably for all apparent classes present in the image [122]; Condition 1 is necessary for a reliable estimation of the classifier parameters. In other words, insufficient independent training data points may result in the Hughes phenomenon [112]. This is an important point specially when dealing with hyperspec-tral data [113]. However, for the purpose of this research, focus is on the second point, due to its importance in the formulation of the specific class mapping problem.
Note the phrasing of condition 2: all classes of interest and preferably for all appar-ent classes. In other words, beside including all land cover classes, the training data set should also include patterns resulted from intraclass variability. For example, their could be different types of water or different types of pasture in the same image frame. Failure to fulfil this condition, may result in an unrepresentative training sets [23].
To fulfil this second condition, remote sensing projects require time and expert image analyst to collect training data, ancillary data and sometimes field work. This may represent too much effort that organisations and institutions may not be able to provide. Additionally, the identification of the apparent classes is complicated, since the definition of the land cover classes and the spectral pattern are often difficult to an human operator to consistently and accurately identify. This becomes even more obvious if the image sampling is executed by more than one image analyst. Nevertheless, collecting training data points is a must for remotely sensed data analysis with supervised learning algorithms.
2.2. SPECIFIC CLASS MAPPING
Supervised methods allow users to tailor the mapping process to suit their own applications, since in each instance the needs can be quite specific [55]. Indeed, users are often not interested in all classes present in the study area but just on a small subset [71]. This is evident in studies where major land cover transformations are object of study, such as deforestation [104] and urbanisation [24,39], or where specific classes are of interest, such as abandoned agriculture [3,99,119], specific tree species [5, 54, 59, 68, 131], wetland species and crops [77, 87], mangrove ecosystems [74,
90,133, 140], to name just a few. In such applications, the use of multi-class image classification methods can be inappropriate [45, 55, 103]. In other words, building a classifier capable of handling effectively only a subset of classes may be a better alternative. In this dissertation, that is called specific class mapping.
The rest of this chapter is organised in the following way: in the section2.2a brief overview of the topic is presented; for example the term "specific class mapping"is de-fined and it is explained why conventional supervised methods may yield suboptimal results. In the section2.3it is presented an analysis of the previous works where the specific class mapping was the central issue. The section is mostly descriptive and tries to cover all the major developments and applications. In section2.4the synthesis is presented and the most important points learnt from analysis of previous works are highlighted and the most relevant concepts are summarised and categorised. This chapter ends with the conclusion.
2.2
Specific class mapping
The term "specific class mapping"refers to the process of non-exhaustive supervised classification of a given region of interest. In other words, it refers the mapping pro-cess of only a subset of classes present in that region [55]. The term, however, is not consensual and, thus, often the problem and the process are not mention directly in research papers. One can find researchers using the phrases like "non-exhaustively de-fined set of classes"[44,56], "supervised classification without an exhaustively defined set of classes"[46], or more closely "mapping a specific class"[47], or less frequently "targeted classification"[103]. In some cases, the title briefly suggests that the base problem is that of classifying a specific class or classes of interest, such in "Opera-tional tree species mapping in a diverse tropical forest with airborne imaging spec-troscopy"[6], "Tree Species Discrimination in Tropical Forests Using Airborne Imaging Spectroscopy"[40], "Tree species classification in the Southern Alps"[28], to list just a few. In this thesis, the term "specific class mapping"was preferred for two reasons: first, although it was not the term utilised in the first study, like [88], it was used in early remotely sensed studies tackling the problem, such as [13,55, 124,125]. And second, it clearly associates the process to the land cover mapping process.
In this way, one can defined the problem of specific class mapping in the following way: the objective of specific class mapping is to map a subset (one or more) of land
cover classes, named as classes of interest, without considering other classes present in the region to be mapped [103]. Thus the specific class mapping process ideally requires the user to exclusively collect data points from those classes of interest, which represents a non-exhaustive sample of the class composition of the mapping region [44, 55]. The technical requirement here is to develop processes that are capable of mapping specific classes without significant decrease in classification accuracy when compared with conventional supervised classification methods. Note that the classes of no interest can be ignored by the analysts for different reasons; for example, the analysts may ignore them to save time and sampling effort or these classes may even be unknown to them [103]. That is common to many operational scenarios where gathering an exhaustive data set for the mapping region is difficult, costly, or not even impossible.
But why are conventional multi-class supervised methods not suitable for specific class mapping? There are essentially two reasons for that. One problem in using multi-class approach for specific multi-class mapping is the exhaustive training requirement. That is the training sample has to contain all classes present in the study area regardless of its importance for the analysis [71]. If the training set is not exhaustive, the classifier, will commit pixels of untrained classes into the set of classes in which the classifier was trained [52,103,125]. This may lead to classification errors that are not identified in the accuracy assessment process [44, 55]. For example, areas of untrained forest may consistently be committed into a particular crop or shrub. As a result, the resulted map overestimates the extension of that crop or shrub. Thus the analyst has to ensure all classes present in the study area are sampled to avoid such errors. This from the op-erational point of view represents additional sampling effort that could be reallocated to other processing steps, such as tuning the learning algorithm or sampling data for accuracy assessment.
Another concern is that a multi-class classifier is often developed to maximise clas-sification accuracy over all land cover classes present in the training rather than focus on the specific classes of interest [55,88]. That is, the classification algorithm seeks to output a classifier with maximum overall classification accuracy, measured over all classes. However, the classes of interest are typically only a small part of the overall training set, and thus the analysis may not be optimal for the discrimination of these specific classes. Indeed, when fixing the free-parameters of classification algorithm in a multi-class problem, the analyst searches for the particular parameterisation that yields the lowest classification error in a series of testing trials, for example 10-fold cross-validation [9]. At each trial, a classifier is trained and its overall accuracy is assessed irrespective of classes under analysis. It is possible then to a particular pa-rameterisation to yield an accurate classifier that omits part or all classes of interests. For example, if the classes of interest represent only 10% of training set and a particu-lar parameterisation yields a classifier that omits these 10% but accurately classifies the remain 90%, the overall accuracy associated to this classifier will be 90% although the
2.3. ANALYSIS OF PREVIOUS WORKS
important areas are completely omitted. This parameterisation, then, may be regarded as a good parameterisation by the fine-tuning process for that particular classification problem. Thus, the classifier derived from this particular parameterisation is an ac-curate classifier for the majority of the classes present in the classification space but inaccurate in the most relevant classes. Conversely, if a particular parameterisation renders a classifier that accurately discriminates the classes of interest (10%) but mis-classifies all others (90%), this classifier will score low and thus its parameterisation is likely to be rejected.
What is proposed with specific class mapping is to apply the Vapnik’s principle that is: when solving a problem of interest avoid solving a more general problem as intermediate step [139]. In other words, if focus is on a particular subset of classes present in the area of study, the analysis should focus on the discrimination of those classes regardless of other classes present in the classification space. Indeed, if one is interested on just a subset of classes, misclassifications between classes of no interest are of no importance [51]. Therefore, when interest is on a subset of classes present in the study area, it may be preferable to follow an alternative approach to the conventional multi-class supervised classification method [125]. In other words, building a classifier capable of handling effectively only a subset of classes may be a better alternative for specific class mapping.
2.3
Analysis of previous works
The concept of specific class mapping can be dated back to 1995 with [88], for is cited in several studies concerning specific class mapping. Although, in [88] the author does not formulate the need for a more specific driven mapping analysis in the same way as in the previous section, he argues that the producer (who carries out the mapping pro-cedure) ultimately has to optimise the mapping process in terms of the requirements of the user (who commissions the map). This is because the most important aspect of a map is its utility, which depends on two factors [88]: the usefulness of a particular class and the quality with which that class was mapped. The responsibility for ensur-ing that the defined classes are useful lies with the user, which defines the product requirements. The responsibility for ensuring that that class is well mapped, on the other hand, lies with the producer. And here is the key point motivating specific class mapping. In other words, specific needs require specific maps that require specific mapping processes. The entire work in [88] can then be summarised in three points:
1. Users who require a map to answer a particular question will be interested in the accuracy of the classes that allow them to answer that question. For example, when study mangrove systems, the dynamics of particular crops, urban and semi-natural features may be secondary [90].
2. The accuracy metrics concerning those classes are then more important to the producer than others. For example, if users are interested in the class mangrove, the accuracy of the class mangrove (say the user accuracy and the producer accuracy) that is of importance. In this way, a user may prefer a map with lower overall accuracy but high user and producer accuracy for the mangrove class, since errors between secondary classes are irrelevant.
3. Thus, it is necessary to drive the classification process "to produce a map for a particular user in which the components of accuracy that concern him or her are optimized at the expense of components of accuracy that are not of interest"[88]. In [88] it is not argued that a specific driven approach is a must if the conditions do not allow the analyst to define an exhaustive training set, but simply that better and useful maps can be produced if the analysts move their classification process to a more user specific driven process. That is, this study main contribution is to contend that there are various different errors which characterise the accuracy of a map and that a particular user will be concerned only with a subset of these. And the classification process has to take that into account. Thus a classifier optimised on one or a few components of accuracy, for example overall accuracy, will not necessarily yield the best possible map for any user.
Perhaps the first reference about non-exhaustively defined training data sets or untrained classes in remote sensing can be found in [58]. Here a method was developed to provide an estimation for a posteriori probability vectors and the estimation of the prior probability of classes. The idea of estimating statistical properties from the training data to later infer the probability of an unseen pixel to belong to a particular class was followed by other researchers, such as [1,102,103].
In [48] and [45], the main concern were the effects of non-exhaustive training data sets in the classification and how one could minimise it. The failure to satisfy the exhaustive composition of the training set was investigated and assessed with reference to hard and soft land cover classifications using neural network. [48] in particular evaluates the use of relative and absolute class membership strength under the presence of untrained classes, fuzzy c-means and possibilistic c-means respectively, to evaluate the sub-pixel land cover class composition. Here three classes were of interest, asphalt, grass and tree, using Daedalus 1268 sensor with eleven spectral wave-bands and 1.5 m geometric resolution. The study main conclusion is that with the frequent presence of untrained classes in the image, it may be inappropriate the use of methods that base their decision on relative class membership, such as the fuzzy c-means, for the estimation of sub-pixel class composition. In contrast, methods that provided absolute membership metrics may be better suited to derived the class composition of sub-pixels, such as the possibilistic c-means. This is because relative methods compute class membership with respect to all defined classes. As result, the
2.3. ANALYSIS OF PREVIOUS WORKS
magnitude of class membership are large or small according to the classes that have been defined in the training stage.
[45] explores how supervised image classification methods, like the multi-layer perceptron and radial-basis neural networks, behave with and without the presence of an exhaustively defined set of classes. Since these two supervised methods are based on one key assumption, that the set of classes has been defined exhaustively, if this assumption is unsatisfied, pixels of an untrained class will commissioned into the set of trained classes. As result some classes will be predicted, leading to an over-estimation of their true extension. Here a data set derived from airborne thematic mapper (ATM) imagery with a spatial resolution of 5 m acquired with a Daedalus 1268 sensor was utilised. A set of six crops were of interest, namely sugar beet, carrots, wheat, barley, grass and potatoes. Although the classifications derived each method differed in the pattern of class allocation, they provided the same high classification accuracy > 85%. However, when the learning algorithms were trained with a rejection option, that is they were allowed to classify a pixel or reject to classify by labelling the pixel as unknown, the classification accuracy decrease significantly, roughly about 12.5%. This is a relevant result and it shows the necessity to identify training data at least for all classes of interest and preferably for all apparent classes in the segment of image to be analysed [122].
In [13] explicit interest in focusing the mapping process in a particular class of interest is mentioned. This differ from previous works in the sense that the authors followed [88] advice to adapt the mapping process to the user needs. Since most supervised learning algorithms aim to maximise the overall probability that a pixel is allocated to a class correctly, rather than focus on the accuracy with which the specific class of actual interest is classified, may lead to an sub-optimal classifier to discriminate the class of interest. Indeed, overall accuracy is just one component of classification accuracy that may not even be the most useful for the user [88]. Here a Landsat 7 ETM+ image was used and the land cover class fen was considered the class of interest as opposed to the other seven, salt marsh, grazing marsh, agriculture, forest, urban, sand and water. These seven classes constituted the others class. Two binary classifiers, trained with class of interest and others data set, were compared with a conventional classifier, trained with all the eight classes. The binary approach were significantly more accurate that the multi-class conventional approach, indicating that a class specific driven classification approach may be more suitable to discriminate particular classes of interest than conventional multi-class way. The authors also in-dicate that the satisfaction of the assumption of an exhaustively defined set of classes requires that much effort, since part of the process is reserved to classes of little, if any, direct interest; and thus savings in training could be achieved by focusing on the specific class of interest.
Indeed, the idea of saving resources in the training stage were taken even further in [55], where training set size requirement for the classification of a specific class was
explored. The authors explored four different approaches to reduce training set size to assess the minimal requirement to an accurate classification: intelligent selection, selective class exclusion, acceptance of imprecise descriptions for spectrally distinct classes, and the adoption of a one-class classifier. These approaches were compared with the often suggested heuristic termed 30p. In other words, each class should be sampled such that there is at least 30 × p where p is the number of bands. The study site was composed by cotton, local rice, basmati rice, sand and built-up land, but only cotton was of interest. Experiments were conducted with data acquired from the In-dian Remote Sensing Satellite LISS-III sensor with three spectral wavebands and 20 m resolution. The results indicate that all approaches were capable to reduce the training requirement and yield accurate classifications comparable to that of the conventional widely used heuristics 30p without significant impact on the discrimination of the class of interest.
In the sequence of [13], [47] explore the use of ensemble methods to classify a spe-cific class of interest. The use of an ensemble could be useful since in many classifiers, such as support vector machines and neural networks, the need to fix free parameters can be difficult and time consuming. The use of multiple classifiers could in principle mitigate that need [148]. The study was carried out with various binary classifiers used to discriminate a specific class of interest from all others. A Landsat ETM+ image of the test site was acquired and training set for the two classes, fenland and "oth-ers", were extracted from the imagery using stratified random sampling, as in [13]. The ensemble was composed by five classifiers, commonly utilised by remote sensing analysts, discriminant analysis, decision trees, support vector machines, multi-layer perceptron, and radial basis function neural network. The outputs of the classifiers were combined using a simple voting procedure to determine class allocation. The ac-curacy of this ensemble was 95.6%, marginally better, but statistically insignificantly, less accurate than the most accurate individual classifier. However, it is difficult to specify the most appropriate classifier in advance, and thus the ensemble approach may represent an operational solution for specific class mapping.
In [124] and [125], it is suggested that a single class classification approach could be appropriate if interest focuses on a specific class. The authors illustrated this with the classification of fenland from Landsat 7 ETM+ imagery and evaluated a range of one-class classifiers, with particular attention to the support-vector data description algorithm. The overall accuracy yield by the benchmark analysis was 68.8%. This represents in general a low accurate map, however as supported by [88], analysis should focus on the classes that best suites the user needs. Here the class is fenland. This was classified with a commission error of 10.0% and omission error of 28.0%. The accuracy of this classification is below used map accuracy targets and the map derived from it may be viewed as being inadequate for use in the monitoring of the class of interest [125]. In particular, the benchmark classification shows a large degree of omission error and, as consequence, the extent of the class of interest was substantially
2.3. ANALYSIS OF PREVIOUS WORKS
underestimated. This is relevant since indicates that a map derived from a general mapping procedure use for specific purposes (here fenland monitoring) may not be optimal for those purposes. The one-class approach yielded a classification that was significantly more accurate than that from the benchmark with commission errors of 2.5% and omission errors of 6.4% for the class of interest. The main highlight is that very accurate land-cover maps of the class of interest can be produced with effort and resources directed on the class of interest
In the same year, [108] explored the same algorithm, support vector data descrip-tion algorithm, to classify a specific class with hyperspectral data. This method was compared with other classification approaches in the discrimination of the class of interest. The experimental results, obtained on different kinds of data (synthetic, hy-perspectral, and multisensor images), indicate the effectiveness of the technique to classify remotely sensed data in the presence of incomplete training data. In partic-ular, the support vector data description provided good results particularly on the multisensor data set, with significant improvement of the classification accuracy with respect to other well-established one-class approaches.
The exploration of single class classifiers for specific class mapping was followed by a string of works. In [109], two semisupervised one-class support vector machine approaches were presented for remote sensing data classification to mitigate the need to heavy fine tuning. Indeed, typically fine tuning is hard because the free parame-ters of the model need to be finely adjusted, but there is not clear indication on how to correctly perform it. Here the authors suggest the use of unlabelled data to over-come that requirement by modelling the data marginal distribution with the graph Laplacian built with both labeled and unlabelled data points. The testing trials were conducted with hyperspectral data. In [94] the authors follow the a similar idea of utilising unlabelled data to improve the learning process of a specific class of interest. A classifier is developed with training data set from the class of interest and unlabelled data, and estimates the probability that a positive training data point has been labeled, and generates binary predictions for testing pixels using an adjusted threshold. The ex-periments where conducted using aerial imagery and indicated that the new algorithm provides high classification accuracy. A similar method is presented in [29] to exploit the information contained in the unlabelled data points to improve the classification accuracy of a standard binary support vector machines. In [15], the mean and product combination rules were applied to the probabilistic outputs generated by single class classifiers, and their performance were evaluated in a urban monitoring application with multi-sensor (optical and SAR) data and multi-source (spectral and contextual) features were used. The results obtained by the ensemble show an improvement in the accuracy despise the high dimensional classification space. And in [101], authors suggest a user-oriented one-class classification strategy, based on the visualisation and interpretation of the classifier outcomes during the data processing. They show that
careful interpretation of the diagnostic plots fosters the understanding of the classifi-cation outcome, such as the class separability and suitability of a particular threshold, for the classification of a particular class of interest.
In applicational studies, where the object of analysis is not the method itself, but rather some application research question, the use of specific class mapping ap-proaches is not frequent. In the majority of the cases, users commonly apply a conven-tional multi-class approach. For example, in [87], interest was on four invasive plant species by a a map with fourteen land cover classes was produced; in [74], interest was on one class, mangrove forest, but twelve were utilised to obtain the land cover map; in [99], interest was on abandoned agricultural land (one class) but five classes were utilised to compute the land cover map random forest and support vector machines; and in [119], where interest was also on abandoned agricultural land, the thematic classification was done using twelve land cover classes using support vector machines.
Although rare, there are instances of applicational studies aware of specific class mapping. For example, in [54] where specific tree species in ancient semi-natural woodland, sycamore, fir, oak, ash and line, are the classes of interest and a two-phase classification approach was adopted to map specific species from aerial sensor imagery. First the prior probabilities were adjusted manually, followed by a sequence of binary classifications in series, like a decision-tree classifier. In particular, following [88] in-dication that the accuracy of the classes that allow them to answer that question are of more importance, the optimisation was performed by adjusting the prior probabilities of class membership to ensure that no pixels of the selected class were omitted from it in the correct classification. In other words, the process was undertaken in a manner that sought to optimise the producer’s accuracy of the class of interest. A consequence this approach is that the selected class of interest may commission pixels that actually belong to other classes and hence overestimate its abundance. In the second phase, the adopted process sought to remove these commissioned pixels through a series of binary classifications applied to the sample of cases predicted to belong to the class of interest from the first phase of the analysis, to gradually subdivide the data until the class of interest have been identified. The first phase of this process is indicates a relevant point for specific class mapping, that is the classification optimisation process should be guided by class specific metrics, such as the producer’s accuracy, to drive the classification process to solve the specific problem instead of global classification problem. In [5] the same methodology was utilised.
In [6,28,59] the binarisation process "classes of interest vs. others" as in [13] was adopted. [59] in particular, has utilised it to discriminate tree species. Here twenty-one tree species were of interest and the remain twenty-four were combined in one single class others with Airborne Taxonomic Mapping Systems sensor package. The authors used a support vector machine classifier for its ability to handle high dimensional data with small training sets, and the one-vs-one approach was adopted generating a total of 210 binary classifiers, one for each pair of classes of interest where one of the classes
2.3. ANALYSIS OF PREVIOUS WORKS
is the nominal class others. Evaluation metrics where specific, similarly to what was done in [54]. Here precision and recall were utilised. Precision and recall are informa-tive metrics for multi-class models, that were combined in the F-score metric. However, is not clear if the free parameter determination was done utilising this metric or the conventional classification accuracy. Nevertheless, the authors accurately identified the effects of data imbalance that may occur when utilising the approach indicated in [13]. To overcome data imbalance problems the authors adopted an weighted ap-proach, by implementing them when running the support vector algorithm after the training data had been split into the training and testing groups. The authors quanti-fied the effect of class imbalance on model accuracy, and veriquanti-fied a trend where species with more samples were consistently over predicted while species with fewer samples were under predicted. Additionally it was verified that standardising the sample size reduced the classifier accuracy but also reduced the level to which the classes were over- or under-predicted.
In [28], in particular, four data sets were utilised to discriminate specific tree species utilising hyperspectral data, multispectral and LiDAR. In the first data set, seven classes were of interest and the eighth consists in the others class. In the second data set, five classes were of interest and the sixth the nominal class. In the third data set, there were two classes of interest and the nominal class. And in the final data set a simple binary classification problem, interest-vs-non-interest was utilised. The support vector machines and random forest were compared in each data set. Both methods yield high accuracies > 85%, but indicating that the support vector machine outperformed the random forest in each data set, regardless of the type of data being used. Unlike, [59], there is no clear indication if data imbalance related problems were detected and, if so, how they were tackled.
In [6], the process of specific class mapping is termed focal species mapping, where focal classes are the classes of interest and non-focal are the classes of no interest. Here three classes were of interest and the remotely sensed data consisted in data acquired from the Carnegie Airborne Observatory Airborne Taxonomic Mapping System and LiDAR. Several approaches were compared, the binary approach and the biased ap-proach. One-vs-rest binary support vector machine and biased support vector machine were found to outperform the standard support vector machine for remote species identification. Additionally, they found that binary support vector machine provided greater sensitivity but slightly lower specificity than biased support vector machine. And in particularly, the precision of binary support vector machine would likely im-prove, if more training data were gathered for the classes of no interest. However, pursuing this track can be costly, specially with high tree species diversity it becomes very costly to comprehensively sample the non-focal tree species. The Biased support vector machine is advantageous here, since it comprehensively samples the spectra of all vegetation present in the region of interest and uses this information to constrain the focal classes.
2.4
Synthesis of the previous works
The analysis to the literature showed that there are essentially two general ways to implement such a specific class classification process. One is to decompose the multi-class problem in a series of binary multi-classification problems to separate the multi-classes of interest from all the rest; and the second is to adopt one-class classifiers that explicitly focus all processing in one class of interest. The first is the binary, or binarisation, approach, where the problem is decompose in a series of binary decisions; and the second is the single-class approach, where single-class classifiers are utilised.
The binary approaches tend to define simpler decision boundaries which reduce the competence areas of each classifier producing locally specialised models [82]. From these small binary problems, the original multi-class problem can be solved using combining strategies such as one-vs-one and one-vs-all [129]. Although studies have shown that binary decomposition performs well in most multi-class problems, it has nevertheless limitations such as being dependent of the combination method and being susceptible to data imbalance and sparse distributions [81]. From the operational point of view, the binary classification approach still requires the sampling of land cover classes of no interest at training collection stage, since it is necessary to sample the classification space outside the classes of interest. And like the multi-class supervised method, if this space is ill-sampled, that is some classes are omitted from the training or under-sampled, it is possible for a classifier to commit some of those areas into a class of interest, over-estimating the true extension of these important classes.
In the binarisation category, one can also include the semi-supervised approaches, since this type of classifier typically utilises a binary classifier or binary decomposition approach. Although, like the single-class approaches, only the classes of interest are sampled by the analyst. But, these tend to be computationally more expensive than the single-class methods, since additional information is extracted from an typically very large number of unlabelled samples [95]. However, they can be much more accurate, specially if significant spectral ambiguities between the classes of interest and the negative class exist. In such cases, a single-class approach may not perform as accurate as a semi-supervised approach or binary approach [69,93].
The binarisation approaches require a form combination scheme. The three most common schemes are the one-vs-rest (also known as one-vs-all), the one-vs-one and the decision directed a cyclic graph. The most common form of the three is the one-vs-rest, use for example in [13]. But the other schemes have been used also, for example [59] used the one-vs-one, and [54] a form of decision directed a cyclic graph. Which of these schemes is the best is an open question [9,30,123], and one can find different studies suggesting different answers [57,138]. For example, one-vs-rest leads to less classifiers, but may suffer from imbalance related issues. One-vs-one, on the other hand, break the problem into simpler problems but require much more classifiers. And decision directed a cyclic graph is the most flexible of the three, but may become too complex.