Emergent heterogeneity in putative
mesenchymal stem cell colonies: Single-cell
time lapsed analysis
Deena A. Rennerfeldt1, Joana S. RaminhosID2, Samantha M. Leff1, Pristinavae Manning1, Krystyn J. Van VlietID1,3*
1 Department of Biological Engineering, Massachusetts Institute of Technology, Cambridge, Massachusetts, United States of America, 2 Department of Materials Science, Faculty of Science and Technology, New University of Lisbon, Caparica, Portugal, 3 Department of Materials Science and Engineering, Massachusetts Institute of Technology, Cambridge, Massachusetts, United States of America
Abstract
Bone marrow stromal cells (BMSCs) include a subset of stem cells that are considered promising for developmental studies and therapeutic applications. While it is appreciated generally that BMSC populations can exhibit morphological and functional heterogeneity upon in vitro culture expansion, the potential for heterogeneity within a single colony forming unit–generated ostensibly from a single mother cell–is less explored but is critical to design of both fundamental studies and cell therapy production. Here we observed BMSC colony formation in real time via time lapsed optical imaging and analysis, to quantify whether and how heterogeneity emerged over multiple cell divisions spanning the duration of a typical colony formation unit assay. These analyses demonstrate that such colonies are neither homogeneous subpopulations of stem cells nor necessarily derived from single originating cells. While the mechanisms for and causes of this intracolony heterogeneity are not under-stood fully, we further demonstrate that extensive cell-cell contacts do not correlate with senescence, but that media exchange was concurrent with diversification in even the most uniform single-cell-derived colonies. These direct quantitative observations and visualiza-tions of colony formation provide new insights that are motivated by significant implicavisualiza-tions for both basic research and stem cell-based therapies.
Introduction
Bone marrow stromal cells (BMSCs), a subset of which are characterized as multipotent mes-enchymal stem cells, are considered potential cell therapies for diverse medical conditions– from bone tissue regeneration to autism and Parkinson’s disease [1–3]. Such culture-expanded BMSC populations have been implemented in over 600 clinical trials since 1995 (http://www. clinicaltrials.gov). Despite these advances at the lab scale and in ongoing clinical trials, how-ever, we are aware of no therapies to date that have been approved by the U.S. Food & Drug Administration for delivery of BMSCs or putative mesenchymal stem cells (http://www. clinicaltrials.gov). a1111111111 a1111111111 a1111111111 a1111111111 a1111111111 OPEN ACCESS
Citation: Rennerfeldt DA, Raminhos JS, Leff SM, Manning P, Van Vliet KJ (2019) Emergent heterogeneity in putative mesenchymal stem cell colonies: Single-cell time lapsed analysis. PLoS ONE 14(4): e0213452.https://doi.org/10.1371/ journal.pone.0213452
Editor: Thomas Abraham, Pennsylvania State Hershey College of Medicine, UNITED STATES Received: September 21, 2018
Accepted: February 21, 2019 Published: April 3, 2019
Copyright:© 2019 Rennerfeldt et al. This is an open access article distributed under the terms of theCreative Commons Attribution License, which permits unrestricted use, distribution, and reproduction in any medium, provided the original author and source are credited.
Data Availability Statement: All relevant data are within the manuscript, its Supporting Information files, our online published protocol (DOI:doi.org/ 10.17504/protocols.io.w2sfgee) and our GitHub repository (DOI:10.5281/zenodo.2551721). Funding: Funded by National Research Foundation of Singapore through the Singapore-MIT Alliance for Research and Technology BioSystems and Micromechanics interdisciplinary research group; US National Science Foundation Graduate Research Fellowship under Grant No. 1122374
It is discussed broadly that one contributing factor of unsuccessful clinical trials is variabil-ity among individual participants. In the case of BMSC autologous therapies, this variabilvariabil-ity of outcome can be attributed to both variability among patients receiving treatment and to the variability among donors of the initial bone marrow aspirates and the ensuingin vitro-expanded BMSC populations derived thereof [4–6]. However, even for cells obtained from a single donor, variation is manifest in the functional heterogeneity–including variable prolifera-tion rates, number of colony forming units, and differentiaprolifera-tion potential–that emerges within in vitro-expanded BMSC populations that are cultured under ostensibly identical culture pro-tocols [5,7–9]. For at least some clinical endpoints, including bone marrow regeneration, it has been shown that functional heterogeneity among the administered BMSCs can lead to sub-stantially diminished therapeutic outcomes [10]. Nevertheless, heterogeneity onset in stem cell cultures–while acknowledged anecdotally–is often overlooked and underappreciated in many studies [11,12]. Further, there is no standardized protocol to maintain or quantify critical qual-ity attributes of culture-expanded BMSCs indicative of safety and efficacy for clinical trials beyond pre-expansion screening of the surface marker panels suggested by the International Society for Cellular Therapy [13], and completed clinical trials typically do not publish their methods and findings in peer-reviewed journals [14,15].
To avoid the complications inherent in studying heterogeneous cell populations, many studies focusing on basic BMSC biology or therapies have used so-called “clonal” BMSCs. These cells are those within a BMSC population that belonged to or were expanded from a sin-gle colony. As such, it is tacitly assumed by most that the colony was derived from a sinsin-gle cell and that cells within the resulting colony were functionally homogeneous stem cells. Such assumptions, which are also implicit in many studies of other cell classes, are sufficiently perva-sive that many consider colony formation as a defining criterion for the putative stem cells within a BMSC population. However, a competing consideration is the demonstration that even cells within a BMSC colony are heterogeneous in terms of gene and surface marker expression and morphology (see Rennerfeldt and Van Vliet [16] for review). Here, we present our findings from time lapse image analysis of multiple colonies grown under a standard col-ony-forming-unit assay culture protocol. We demonstrate variability among colonies gener-ated from cells obtained from the same donor and expanded in the same vessel, and we present a single-cell-analysis of dozens of biophysical and biological properties to report the extent of single-cell-level heterogeneity within individual colonies. Our findings suggest that colonies grown in sparsely plated BMSC cultures most typically are neither accurate represen-tatives of their entire putative stem cell subpopulation nor collections of functionally homoge-neous stem cells originating from a single rapidly dividing mother cell. We further
demonstrate that the onset of senescence within colonies cannot be explained by extensive cell-cell contacts and provide additional evidence demonstrating that common changes in the biochemical environment can instigate deviations in cell behavior. Such findings hold implica-tions for, and suggest future work required to enable, both basic research on stem cell biology and applications of culture expanded BMSCs for therapeutic applications.
Materials and methods
Detailed methods are located following the References, for manuscript readability. These methods include: cell source, expansion, and serial dilution to attain sparsely seeded dishes for colony imaging; time-lapse image acquisition of colony growth; image analysis including extensive image preprocessing to identify and track and distinguish cells over days of continu-ous culture and imaging, parameter extraction and classification; construction of multivariate lineage trees; correlation analysis linking parameters to intracolony heterogeneity; processes
(DAR). The funders had no role in study design, data collection and analysis, decision to publish, or preparation of the manuscript.
Competing interests: The authors have declared that no competing interests exist.
for creating data visualizations; and statistical analysis to identify differences among and within colonies. We have also provided a detailed experimental protocol at protocols.io [17] and source code for image processing and analysis as a GitHub repository [18].
Results
Intercolony heterogeneity can result from multiple progenies within a
putative clone
It is well documented that BMSC colonies derived from a given donor (i.e., single biological cell source) vary substantially from each other in terms of colony size, confluency, and multili-neage potential [5,19–23]. Unfortunately, the vast majority of reported studies involving col-ony formation have not demonstrated rigorously that each colcol-ony included solely the progeny of a single originating cell [16]. To understand the prevalence of single cell origin under typical colony-forming conditions, we plated human BMSCs at low density (approximately 30 cells/ cm2; seeMethods) and imaged at sufficiently high resolution to resolve individual cells (1344 x 1024 pixels per field of view,Fig 1) every 15 min over the course of 14 days. Following conven-tional BMSC culture protocols, cells were fed twice per week, beginning at the end of Day 3 of the experiment. We processed and analyzed these images at the single-cell level for the first four days of growth for 28 colonies, and we further analyzed colony-wide properties at Day 7 up to Day 10 to ensure full colony formation, defined herein as a group of at least 50 cells. This time lapse imaging approach enabled us to confirm definitively the potential for apparent colo-nies to include progeny of multiple originating cells.
We termed colonies originating from a single isolated cell (i.e., only analyzable cell in the viewing frame at the onset of the experiment) as single-cell-derived (SCD) colonies and colo-nies that originated from more than one cell as multi-cell-derived (MCD) colocolo-nies. We observed that nearly half (48%) of colonies analyzed at the single-cell level through Day 4 origi-nated from two BMSCs, while a lower fraction (35%) origiorigi-nated from single cells (Fig 1). For each of the studied colonies,S1 Figincludes lineage trees up to Day 4 and phase contrast images at Days 4, 7, and 10. Importantly, within seven days of colony growth, all SCD colonies contained at least one cell that had migrated toward and infiltrated the originating progeny (S1 Fig, Colonies A, D, E, F, L, P, Q2, T, and Z). Time lapse imaging also enabled us to con-clude that some units which would be designated as a colony at later time points (e.g., Day 7 or 10) were actually multiple colonies that joined to form a larger MCD colony (S1 Fig, colonies Y and F), or a collection of several adjacent progenies of varying proliferative capacity (S1 Fig, Colonies C, H, I, and M). Growth of one SCD and one MCD colony, respectively, is illustrated additionally inS8andS9Figs.
We also categorized the progenies comprising each colony in terms of proliferative capac-ity, in order to understand the proliferation kinetics needed to form a colony in sparsely-seeded conditions. We classified originating cells that yielded more than 16 cells (four popula-tion doublings) at Day 4 as “fast proliferators,” and progenies that produced fewer than 8 cells (three population doublings) as “slow proliferators.” The remaining progeny–any progeny containing 8 to 16 cells at the Day 4 time point–were classified as “moderate proliferators.” Of the 52 progenies contributing to colony formation, 28% were classified as fast proliferators, 50% as moderate proliferators, and 22% as slow proliferators. Several combinations of slow, moderate, and fast-dividing progeny contributed to colony formation (S1 Fig). Among the SCD colonies, only 33% were formed by fast proliferators (S1 Fig, Colonies A, D, and T), and the remaining 67% were formed by moderate proliferators. Additionally, 39% of MCD colo-nies contained at least one slowly proliferating progeny.
We then sought potential correlations with colony properties that did not require detailed time lapse image analysis in an effort to predict multi-cell origin.Fig 2provides images of the colonies after 7 days of growth and summarizes tests for correlation between the number of colony-originating progenies and more readily observable colony features such as colony diameter, confluency, and number of neighboring colonies. The colonies analyzed at Day 7 exhibited an average confluency of 12.7 +/- 4.9% and an average approximate diameter of 1.9 +/- 0.8 mm (S2 Fig). We compared the above colony-level properties to several other detailed parameters, including the number of fast/moderate/slow-proliferating progeny contributing to the colonies, the number and fraction of senescent cells at Day 4 (defined by the failure to divide by Day 7), and the total and cumulative number of cells belonging to colonies over four days of growth (S1 Table). The properties measurable without time lapse image analysis at Day 7 –colony confluency, diameter, and number of neighboring colonies–did not significantly correlate with the number of originating progeny nor with any of the other properties mea-sured (S1 Table), as determined by the critical value of the Spearman rank correlation coeffi-cient [24]. Further, we noted no statistical significance in these three properties between SCD colonies and MCD colonies when using a Bonferroni-corrected p value of 0.0005 as a thresh-old for significance (S2D FigandS1 Table).
Intracolony heterogeneity: Differences emerge among cells within colonies,
even when known to be derived from single cells
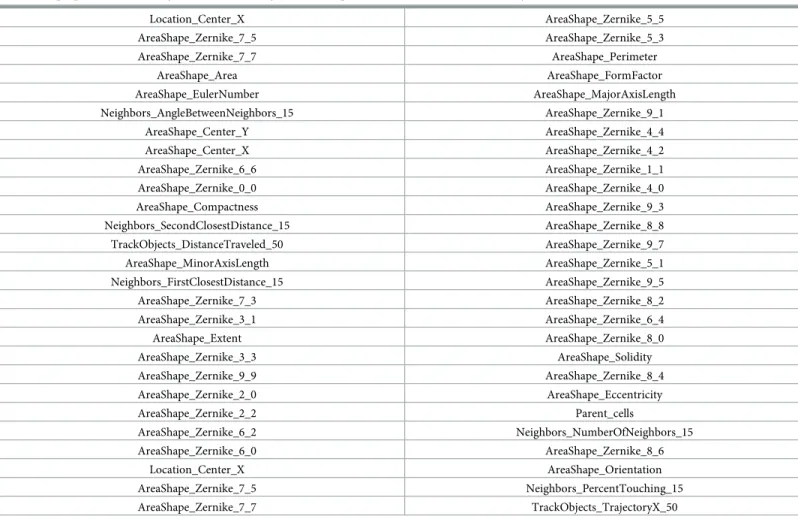
While many studies assume that colonies formed in BMSC cultures are functionally uniform (and therefore differences among cells isolated from a given colony are due to other causes, such as environmental cues), there is evidence to suggest that cells within each BMSC colony are functionally heterogeneous [16]. To test the implicit assumption of intracolony similarity with the benefit of our time lapse imaging data, we conducted principal component analysis (PCA) on the z-score normalized dataset to determine how similar cells within a colony were to each other, compared to cells in other colonies. We quantified a total of 54 properties (see “Materials and methods”) relating to the morphology and location of cells, measured for 1384 cells at every 15 min time point of the cells’ existence during the first four days of colony growth. We combined properties relative to each cell’s timeline–namely, each cell’s properties at the time point of its birth, as well as properties averaged over the course of each cell’s life-time–with additional manually calculated properties (S2 Table) into one dataset for a total of 128 properties.
Upon first inspection, PCA indicated no visually distinct clusters of cells (Fig 3A). Addi-tionally, when ordered by coefficient value, there were no single driving properties dictating a cell’s position in principal component 1 (PC1) and PC2 space (S3 Fig), including the colony identity of the cell. In other words, a given k-means cluster was not enriched for cells from a particular colony, and thus this analysis provided no indication that cells originating within a given colony were more similar to each other than they were to cells from another colony. Fig 1. Colonies observed after four days of growth varied by the number of originating progenies. Of all locations in which colony formation was observed, approximately 35% originated from a single tracked cell, 48% originated from two analyzed cells, and the remainder formed from three or four originating cells that attached near each other at the start of the experiment. Phase contrast images of three representative colonies after four days of growth are displayed, organized by the number of analyzed cells the colonies originated from. Images are montages of nine or sixteen fields of view and were altered post-experiment to artificially color the BMSCs by the progeny they belong to. Cells without color added are BMSCs that migrated into the montaged field of view after initial imaging. Lineage trees of the colonies’ originating cells are also presented, where the width of the lineage lines is representative of the respective cell spread area at each 15 min time point.Lineage trees and images of all colonies at several time points are presented inS1 Fig. Lineage tree outlines indicate the proliferative capacity of the progeny. Dashed line (- -): progeny classified as slow proliferator; dotted line (. . .): progeny classified as moderate proliferator; solid line (–): progeny classified as fast proliferator. Scale bars = 0.5 mm.
Fig 2. Colonies varied by size, confluency, number of originating progenies, and degree of isolation after seven days of growth. Binarized and recolored phase contrast images of all analyzed colonies after seven days of growth. The color of each imaged colony was altered to represent the number of originating cells associated with each colony, as analyzed by time lapse image analysis at the single-cell level up to Day 4. Borders of neighboring colonies that were either touching or overlapping the colonies studied are represented as black arcs and were traced based on the original phase contrast images. The size of the 16 montaged fields of view at Day 7 is also provided for reference. No statistical correlation was found between the number of cells the colony originated from and colony diameter, confluency, or number of neighboring colonies. (SeeS2 Figfor further details.) Colonies are ordered by approximate diameter. Unaltered phase contrast images of all colonies are provided inS1 Fig.
Fig 3. Principal component analysis revealed a trend in generation associated with cell behavior. (A) A total of 128 variables (listed in Methods andS2 Table) related to morphology, location, proliferation, and association with neighboring cells were analyzed using principal component analysis (PCA) for 1384 cells belonging to 28 colonies. k-means clustering revealed no clusters that were especially
However, cells within a given cluster were similar in generation of cell division. This trend with generation was readily apparent when rendered in PC1-PC2 space (Fig 3B). For example,
Fig 3Bshows that cells which were all at Generation 2 were in close proximity in PC space, even though those cells originated from several different colonies, and regardless of the overall proliferative capacity of those colonies (Figs1andS1).Fig 3Cillustrates this point by
highlighting a single colony within the same multi-colony PC space, with each cell in that col-ony colored by generation. This remarkable trend with generation also persisted to varying extents when we conducted PCA on individual colonies (Fig 3D).
Visual representations of colony parameters provide prospective indicators
of intercolony and intracolony heterogeneity
Having identified distinguishing metrics of heterogeneity within a colony, we next considered how the extent of intercolony and intracolony heterogeneity–including properties related to colony diameter, cell area, proliferation kinetics, and cell generation–could be represented visually and concurrently to aid in further classification and insights.Fig 4visually demon-strates the degree of intracolony heterogeneity in cell generation, as well as these other proper-ties, for all colonies analyzed at the single-cell level up to Day 4.Fig 4also provides spatial information in which the extent of cell-level heterogeneity in size and position within a colony can be compared readily with colony size and rates of cell division, reinforcing the finding that larger colonies are not necessarily highly proliferative, and smaller colonies are not necessarily single cell-derived (Fig 2).
As expected, slow-dividing progeny exhibit longer cell lifetimes
Fig 4further demonstrates the variability in proliferative capacity of the originating progenies contained in each colony, classified as slow, moderate, or fast proliferators as defined above. We compared cells belonging to fast- or slow-dividing progeny with respect to several other key properties (S2 Table), including generation, average and maximum spread area, and life-time. Cells that belonged to slow-dividing progeny had longer lifetimes, were born of cells that had longer lifetimes, and had more senescent daughters on average (Student’s t-test, p < 0.05). We further analyzed cells belonging to moderate- or fast-dividing progeny to determine whether or not their behavior was different if they belonged to a colony containing a slow-dividing progeny. Statistically, such cells migrated less within the local environment (as quan-tified by total distance traveled, not persistent trajectory distance) when belonging to a colony containing a slow-dividing progeny and exhibited a larger average spread area 1–2 hours before division (p<0.05), though these differences were small (80μm and 556 μm2, respec-tively, each approximately 20% of the standard deviation of all cells for those properties). It should be noted that cells did not differ in their proliferative capacity when they belonged to a colony containing a slow-dividing progeny: cells were not statistically more likely to have senescent daughters, and second-generation cells did not produce a significantly different number of progenies, when in a colony with a slow-dividing progeny.
distinct, indicating that the biophysical properties of these cells behave as a spectrum rather than signifying discrete subpopulations. (B) Color-coding the same PCA plot by generation revealed a trend in PC1-PC2 space. (C) The same PCA plots are color-coded such that only cells from one colony are highlighted, demonstrating that cells from individual colonies did not cluster together. (D) PCA was also conducted on data subsets containing cell properties from only one colony at a time. The trend in generation was observed in individual colonies to varying extents. All plots highlighting individual colonies were chosen at random using the “rand” function in MATLAB.
Asynchronous cell division and senescence drive intracolony heterogeneity
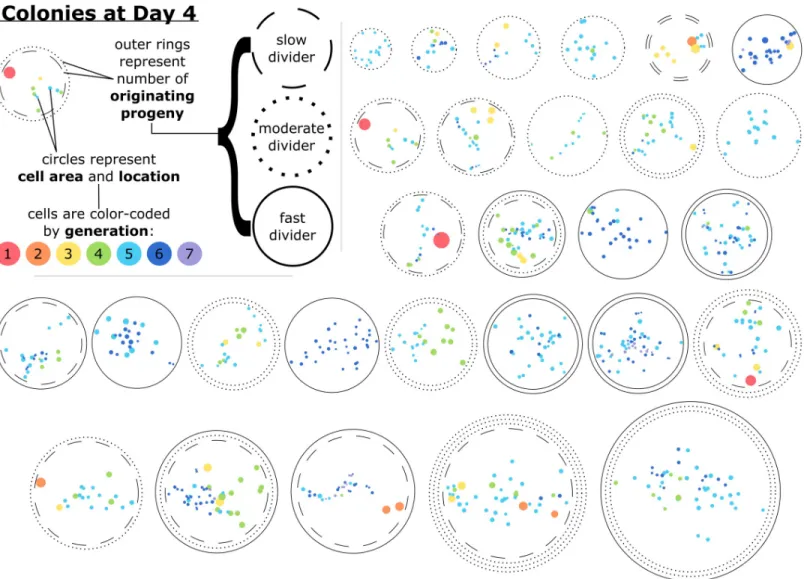
Using cell generation as a metric for heterogeneity, we determined that the standard deviation of generations at Day 4 ranged from 0 to 1.3 generations, with single-cell-derived (SCD) nies exhibiting statistically smaller standard deviations than multi-cell-derived (MCD) colo-nies (p<0.001; seeS4 Fig). One potential cause for differences in generation at any given time point relates to the differences in lifetimes of cells within a colony. There were several cases of twin cells that, while both proliferative, had notable differences in lifetimes and therefore asyn-chronicity in mitotic events in the progeny overall (resulting in a greater distribution in cell generation at a given time point). Cells were classified as “asynchronous” relative to their twin if their lifetimes differed by more than one standard deviation of the lifetime of all dividing Fig 4. Cells within a colony after four days of growth varied by their size, generation, proximity to other cells, and the proliferative capacity of the progeny they belonged to. Glyphs representative of each colony studied at the single-cell level at Day 4 are presented. Cells are represented by filled circles, which are color-coded by generation and oriented based on the coordinates of the final time point of the single-cell time lapse image analysis. Similarly, the spread area of each cell is represented by the size of the color-filled circles. The outer rings of each colony represent the number and proliferative capacity of the originating progeny; slow dividers had less than three population doublings and fast dividers had more than four population doublings by Day 4. The example provided in the upper-left-hand corner is a representation of a colony after four days of development that originated from two cells, one of which proliferated slowly and one that proliferated moderately. This example colony had 10 cells at Day 4 ranging from first to fifth generation, with the first generation cell being relatively isolated and having a large spread area. The colonies are ordered horizontally by their approximate diameter.
cells in the study (0.27 days). Such asynchronous cells are labeled in their respective lineage trees inS1 Fig. Twins classified as asynchronous exhibited statistically longer lifetimes com-pared to twins that divided at relatively the same time (p<0.05), suggesting that asynchronicity within a colony was due to one twin dividing later than expected on average, not earlier. Prolif-erative twins classified as asynchronous also had more senescent daughter cells (p < 0.05), and second-generation cells classified as asynchronous had fewer total progeny (p < 0.05) when compared to twins that divided at approximately the same time.
Another contributing factor for the distribution of generations within colonies at a given time point was the well-documented phenomenon of senescence in MSC cultures [6,7]. We therefore used the two-week time lapse videos to study the future timeline of cells that were present at the final time point of single-cell analysis (approximately Day 4). Each cell analyzed up to Day 4 was also tracked visually in the time lapse videos to determine whether that cell was still present at Day 7 or had divided into two daughter cells within that time frame up to Day 7. Cells present at Day 4 were considered senescent if they did not divide by Day 7, a par-ticularly stringent criterion given that the average lifetime of all dividing cells studied was 0.83 +/- 0.27 days. Only three of the colonies contained zero senescent cells by Day 4 (one of which was single-cell-derived). The fraction of senescent cells in each colony was highly variable; on average, senescent cells comprised 16% +/- 13% of colonies at Day 4. The number of senescent cells in each colony is presented inFig 5and graphically demonstrated inS1 Fig. We found no strong correlations with the number or fraction of senescent cells a colony contained and a col-ony’s confluency, diameter, degree of isolation, or number or proliferative capacity of the orig-inating cells (S1 Table).
While larger cells are senescent, successively dividing cells decrease in size
with increasing generations
Cell spread area provides an additional and well appreciated property by which to evaluate intracolony heterogeneity (demonstrated inFig 4), as the largest of cells within a given MSC population have been shown to be committed osteoprogenitors [9] that have exited the cell cycle [7]. In the present study, cells belonging to slow-dividing progeny had larger average and maximum cell spread areas when compared to cells in fast-dividing progeny (p<0.05), and there was a strong positive correlation for all pooled cells between average cell spread area and the maximum area of the corresponding parent cells (r = 0.71, p < 10−144,S2 Table). Senescent cells continued to grow over their remaining studied lifetimes (Figs5andS5) and had statisti-cally higher maximum and average areas compared to proliferative cells (p<0.01). However, we identified no objective threshold in which all cells below or above a certain cell spread area were predictably proliferative or senescent, respectively (S5 Fig). Contrarily, the average area of many cell progeny decreased with each successive generation; 57% of the progenies exhib-ited a strong negative correlation between area and generation (p < 0.001), and 96% of proge-nies had a negative trend between area and generation to varying degrees of statistical significance (Figs5andS5). There was also a negative correlation between average area and generation for pooled cells from all colonies and time points, even when the average area was calculated only for the first 0.83 days of the cells’ lifetime (to prevent low-generation, senescent cells from inflating this correlation due to larger cumulative area), as presented inFig 5C.
Cell-cell proximity and contact do not correlate with intracolony
heterogeneity
An additional metric assessed for intracolony heterogeneity (Fig 4) was the proximity of each cell to other cells in its colony, which generally relates to the potential for cell-cell contact to
modify cell division time or phenotype. Previous work has shown that the cumulative and average number of cell-cell contacts (where contact is defined as a cell’s edge bordering another within a distance of 15 px, or 9.7μm) in sparsely seeded cultures did not coincide with the proliferative capacity of BMSCs [7]. In the present study, the maximum, average, and cumulative number of neighboring cells–as well as the number of neighboring cells at birth– were calculated for the 1384 cells over the first four days of colony development. We found no strong correlation between these properties and several other key properties, including average and maximum spread area, number of progenies, and lifetime (S2 Table). Further, senescent cells on average did not have a statistically different number of neighboring cells when com-pared to proliferative cells, nor was there a statistically significant difference in number of neighbors between cells that produced two proliferative daughters and cells that produced one or two senescent daughters. There was also no statistical difference in cell contacts between asynchronous dividing twins compared to twins that divided at approximately the same time.
There have been several studies describing MSC proliferation as inhibited under confluent culture conditions [20,25,26], including Ylostalo et al. reporting that cells at the periphery of a Fig 5. Most colonies contained senescent cells after four days of development, which is partially detectable by deviations in area dynamics. The spread area of cells was measured at every fifteen-minute time point for every colony during the first four days of development. Additionally, cells in each colony at Day 4 were monitored via time lapse videos and marked as senescent if they did not divide by Day 7. (A) The number of proliferative and senescent cells at Day 4 is reported. The color of the colony label represents the number of originating progenies, and colonies are rank-ordered by the fraction of cells that were senescent. (B) The Spearman correlation coefficientrsand associated
p value for the comparison of average cell area versus generation is presented for all progenies contributing to colony formation. The majority of progenies exhibited a negative trend between area and generation to varying degrees of statistical significance. The dashed horizontal line indicates the Bonferroni-corrected p value threshold for a significant correlation, and the color of the progeny data points represents the number of originating cells their respective colony developed from. (C) Cells belonging to all colonies also showed a negative trend between area and generation when their datasets were pooled, where the area of each cell was calculated as the average area of all time points during the first 0.83 days of their lifetimes. The Spearman correlation coefficient and associated p value is also reported (N = 1384). (D) Line plots of individual cell area in single progenies over time are presented for three progenies. Data lines are color-coded by cell generation, with the exception of senescent cells (labeled black). Many progenies uniformly produced smaller cells with each new generation (left); however, heterogeneity onset occurred when cells deviated from this trend, occasionally due to senescence (middle) or from cells having longer lifetimes (right). Also displayed for each progeny is the Spearman correlation coefficient and associated p- value for the comparison of average cell area versus generation, as presented in (B).
https://doi.org/10.1371/journal.pone.0213452.g005
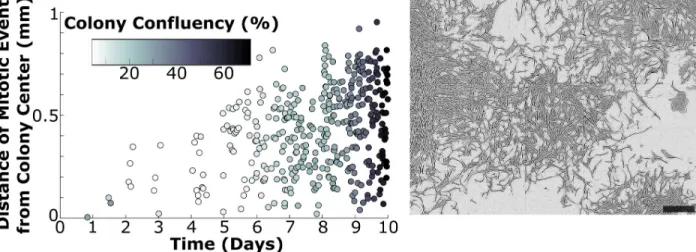
Fig 6. Proliferation continues to occur within confluent colonies. The time and location of each cell division–as well as colony confluency–was measured for the first ten days of colony development in one colony. Mitotic events are reported in terms of their location relative to the colony center at each time point, and the shade of the data points is representative of the measured colony confluency (left). Cells continued to proliferate even at the center of the confluent colony after ten days of development. A phase contrast image of the colony at the final time point is provided (right) as a reference point of the measured confluency. Analysis of a second colony is provided inS6 Fig. Scale bar = 0.5 mm.
colony divided more often than those at the more confluent colony center. However, cells in the present study had relatively few contacts compared to the cited studies, as single-cell time lapse analysis was only and intentionally conducted within the first four days of growth at low plating density. We thus carried out further analysis at later time points to consider the effect of colony confluency on cell division. We manually identified every cell division occurring within a moni-tored colony (using images taken every fifteen minutes as well as the corresponding time lapse video), which we then quantified for time and location (seeMethods). We additionally pro-cessed and quantified colony centroid location and confluency in CellProfiler.Fig 6A demon-strates that cells continued to proliferate in the center of a colony, even under highly confluent conditions.Fig 6includes a phase contrast image of the analyzed colony at Day 10 for reference, and this colony was quantified as 67% confluent at this final time point. We carried out this analysis on one additional colony with similar results (S6 Fig), which matched our qualitative observations from studying the corresponding time lapse videos (S8andS9Figs).
Intracolony heterogeneity can emerge even in initially uniform
single-cell-derived colonies
While most colonies reached a high degree of heterogeneity with respect to cell generation, cell proliferation kinetics, cell area, and degree of cell-cell contacts, there were some colonies which appeared quite uniform in these characteristics for the first four days of growth. We thus con-ducted single-cell time lapse analysis on an SCD colony for which these characteristics and the corresponding lineage tree were relatively uniform at Day 4 to determine whether such a prog-eny was capable of remaining homogeneous upon further cell proliferation and colony growth.
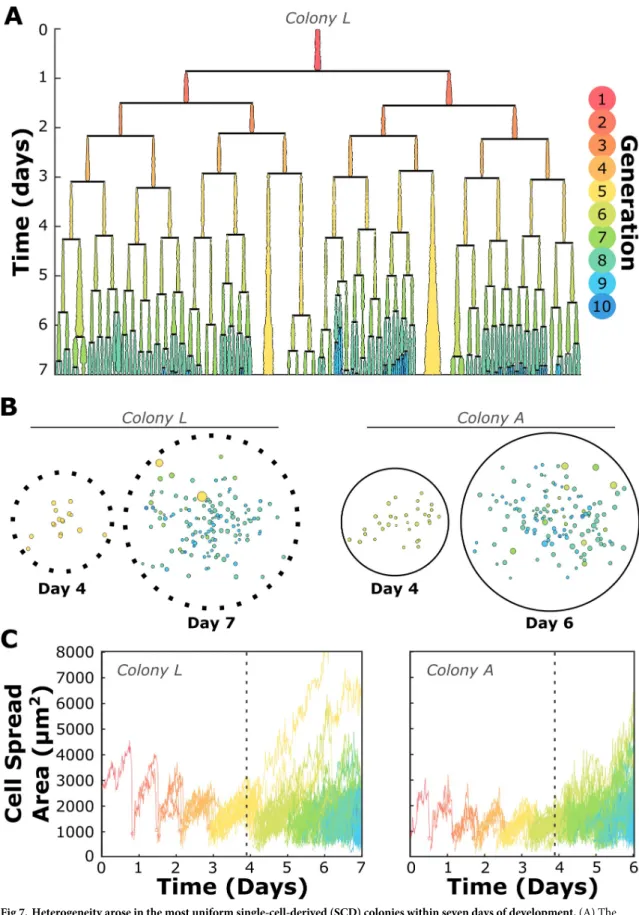
Fig 7presents the resulting lineage tree, demonstrating the onset of senescence and diversity in division lifetime among cells of this once-uniform colony.S1 Figincludes a time-lapse video with cells color encoded to match generation, providing a real-time demonstration of the onset of heterogeneity as colony growth continues. Long-term time lapse analysis of two additional colonies is also presented in Figs7andS7. In all progenies analyzed beyond Day 4, disruption of these coordinated cell divisions and progressive reduction of cell size with increasing genera-tion occurred approximately at the time of medium exchange (Figs7andS7).
Discussion
Single-cell origin must be confirmed rigorously
One key finding in this study is the demonstration that cells plated at low density frequently formed apparent colonies which actually comprised multiple originating cells. Unfortunately, we identified no facile predictive visual marker at Day 7 to indicate how many cells a colony originated from, as evidenced by the lack of significant correlation between the number of originating progeny and colony diameter, confluency, or number of neighboring colonies (S1 Table). The lack of correlation can be explained by the observation that colonies were formed by combinations of progenies of varying proliferative potential (Fig 4). For example, colonies F and Y (S1 Fig) each had 24 cells at Day 4 and both exhibited medium confluency at Day 7, yet one originated from a fast-dividing progeny and the other from two moderately-dividing progenies, respectively.
Interpretation of results in many experiments, including the common CFU assay, can be distorted without knowledge of the number and proliferative capacity of progenies comprising each colony. Of the 52 originating cells in the present study that contributed to the formation of 26 colonies by Day 7, 33 had the potential to form a single colony on their own (i.e., they contained 12 cells at Day 4, which was the number of cells in the slowest dividing SCD colony
Fig 7. Heterogeneity arose in the most uniform single-cell-derived (SCD) colonies within seven days of development. (A) The lineage tree of one SCD colony studied long-term at the single-cell level demonstrates that even a uniformly-proliferating colony will produce large, senescent cells and asynchronous divisions within its progeny before becoming fully developed. Lineage line widths
at that time point). Analysis of the CFU number at Day 7 would have thus indicated only 26 colonies, leading to 20% error in the CFU measurement (Fig 2). Another confounding effect of this phenomenon is the observation that several colonies can eventually combine to form one very large colony (see colonies Y and F inS1 Fig). While the CFU assay may be able to dis-tinguish large differences among populations or treatments (as more colonies will generally form if there are more rapidly dividing progenies), such an error rate renders smaller differ-ences among populations as undetectable unless the number of originating progenies is con-firmed for each colony.
This finding underscores the need for rigorous methods to verify single-cell origin of colo-nies in all studies utilizing colony-derived cells. Even the lowest of plating densities cannot guarantee that cells will not attach near each other, and all SCD colonies in this study were infiltrated by nearby migrating cells within seven days of development. While obtaining colo-nies of single-cell origin might be thought to be ensured by physically isolating single MSCs, our data suggest the need for more rigorous validation than the observation of an apparent sin-gle colony in a well several days after plating. Sinsin-gle-cell isolation is not guaranteed with flow cytometry or serial dilution, as these methods rely on a Poisson distribution with a reported success rate of 26% [21], and so each well must be visually inspected for the presence of a single cell. Single MSCs are notoriously difficult to see in meniscus-dominated dishes such as 96-well-plate wells [16], so fluorescently labeling as demonstrated by Russell et al. [21] pro-vides one approach to such verification if such cell labeling has been validated to not interfere with the cell behavior of interest. Another viable option is demonstrated in Choi et. al [27], who distributed cells into microwells and used an AVISO CellCelector to isolate single cells under the guidance of a microscope, enabling them to observe in real time that only one cell was selected for each well. Though such rigorous methods are time-consuming, the frequency of MCD colonies identified in this study indicates that such approaches are essential to ensur-ing that intracolony heterogeneity is not elevated due to experimental artifact and that the number of colonies formed from a given population is truly representative of the number of progenies that have colony-forming potential.
Cells in a colony are neither clones nor necessarily stem cells
Despite growing evidence and anecdotal appreciation for emergent or inadvertent heterogene-ity within colonies, many experimental designs are fundamentally based on the assumption that all cells derived from the same BMSC colony are homogeneous stem cells. In the present study, we have demonstrated that the morphological and proliferative behavior of MSCs is pri-marily determined by the generations of the cells (relative to the time point of plating), and not to the colony of origin. In other words, if a functionally uniform subpopulation is desir-able, one would obtain a purer population by isolating cells belonging to the same generation rather than cells belonging to the same colony. This finding is evidenced by the trend in gener-ation observed in principal component space (Fig 3B–3D) as well as the observation that cells within a given colony spread throughout PC space rather than clustering (Fig 3C). Even the most uniform and rapidly dividing of progenies in the present study exhibited a broad
represent cell spread area at each 15-minute time point. (B) Glyphs similar to those presented inFig 4for two SCD colonies (seeFig 4
for key) demonstrate the onset of intracolony heterogeneity. Colony L was classified as a moderate proliferator and consisted of 16 5th generation cells at Day 4, and Colony A consisted of 32 6th-generation cells at Day 4. Both colonies developed a distribution in cell area (represented by the size of the color-filled circles) and generation (represented by color) at the later time points indicated. (C) Area-vs-time curves of individual cells for the same two SCD colonies. Graph lines are again color-coded by cell generation. Both colonies presented a decrease in cell area with each new generation, a trend that ceased at approximately the time point the cell medium was replaced (indicated by vertical dashed lines) as part of the conventional BMSC culture protocols of focus in this study.
distribution of cell properties within seven days (Fig 7; see alsoS7andS10Figs), which is still less time than the standard 10–14 days colonies are expanded in typical studies. Further evi-dence of the functional heterogeneity among cells within MSC colonies is the finding that 91% of colonies contained senescent cells after only four days of expansion–cells that would be con-sidered stem cells by virtue of belonging to a colony and were not, by definition, stem cells. Notably, our criterion in classifying cells as senescent at Day 4 was especially stringent, as cells were not classified as such unless they did not divide before Day 7 –meaning that a cell could be born from cell division just before Day 4, have a lifetime 10 standard deviations above the mean, and still be considered proliferative if it divided before Day 7.
These findings on emergence of biophysical heterogeneity at the intracolony level add to the existing body of evidence of heterogeneity in MSC colonies at the transcription and trans-lation level, as reviewed in Rennerfeldt et al. [16]. For example, Ylostalo et al. [20] found that cells at the inner regions of BMSC colonies were upregulated for genes related to extracellular matrix production, while cells at colony peripheries expressed genes associated with the cell cycle. Similarly, Tremain et al. [28] also concluded that BMSC colonies are heterogeneous in gene and protein expression, reporting that colonies expressed genes associated with late-stage differentiation of several contrasting lineages and were not uniform in expression of various surface markers. However, the design and nature of those prior gene and protein expression studies did not allow for verification of the number of originating cells within each colony at Day 1 (single-cell-derived and multi-cell-derived colonies), nor morphological and biophysical attributes that are more readily accessible duringin vitro culture.
Meaningful progress necessitates better understanding of basic MSC
behavior in vitro
The onset of heterogeneity within colonies–even those that were known to have originated from a single cell and were initially uniform in area and proliferation kinetics (Fig 7 )–demon-strates that any subpopulation, however pure initially, will become functionally heterogeneous within one week of growth under current standard culture protocols. Such heterogeneity and lack of characterization can result in reduced therapeutic outcomes [10] and leads to increased experimental noise for the manifold important MSC studies that do not or cannot employ sin-gle-cell resolution. To make meaningful progress in using MSCs as therapeutic agents, several areas of investigation are further needed, including gaining a better understanding of the mechanisms underlying promising results on the benchside, quantifying the therapeutic effects of functionally different subpopulations within a typically expanded MSC population, more concise metrics by which to characterize subpopulations of therapeutically effective MSCs, and sterile and non-retrospective methods to obtain purified populations of MSCs shown to have those critical quality attributes. In order to achieve these milestones, we require increased understanding of the causes of heterogeneity onset under conventional culture protocols.
Though time lapse image analysis is a powerful tool for characterizing cell behavior and can potentially measure hundreds of cell properties, relatively few possible causes of behavioral deviations can be tested without additional coupling to other existing technologies such as RNA sequencing or analysis of surface markers. Nonetheless, some possible causes of hetero-geneity onset have been explored in the present study while minimally perturbing the culture system. Heterogeneity was enabled partly by cells within a progeny changing systematically with each new generation. We found that most progenies produced smaller cells with each generation under standard culture conditions (Fig 5). This slow change in cell behavior with each successive generation is further demonstrated by the trend with generation in PC1-PC2 space (Fig 3), which represents a linear combination of dozens of properties. Combined with
the observations that overall mitotic events within a colony were rarely synchronous (Fig 6; see alsoS1andS5Figs) and became less so with time (Figs7andS7), this slow, asynchronous change in cell behavior with generation and time in culture is one enabler of the eventual onset of heterogeneity in traditional MSC cultures.
Colony confluency surprisingly appeared to have no effect on heterogeneity nor the cells’ ability to proliferate, as mitotic divisions frequently occurred even at the center of a confluent colony after 10 days of growth or more (Figs6andS6,S8andS9), and no strong correlations were found between the average, maximum, and cumulative number of cell-cell contacts and several key properties (S2 Table). The lack of association between degree of cell-cell contacts and behavior does not necessarily conflict with results reported on confluency affecting cell behavior in previous studies. For example, cells grown in extremely confluent conditions– beyond the detailed analysis of this study–did eventually stop proliferating and acquired a more quadrilateral morphology several days after 100% confluency was attained (S8andS9
Figs). Further, cell-cell contact in this study was defined as cells coming within 15 pixels (9.7μm) of each other, a metric that does not describe the extent of interaction between the cells, and generally cells had very few cell-cell contacts during their first four days of growth due to being in a sparsely seeded culture. Finally, studies comparing confluent to sparsely seeded cells would naturally yield substantially different properties if confluent cells were cul-tured for longer periods of time, as longer-term cultures would have higher generations of cells and therefore potentially different characteristics (Fig 3).
In the same vein, an additional cue for the onset of heterogeneity could be in the many fac-tors differentially secreted by various subpopulations in a given culture [10] as well as the dynamics of available nutrients supplied by expansion medium. Between times of medium exchange, secreted factors from cells accumulate in the expansion medium, and available nutrients become increasingly depleted, both with time and with successive cell divisions. One could speculate that this progressive change in the cells’ biochemical environment could explain the change in cell properties with each generation; later generations were born at later time points (rs= 0.90, p< 10−200) and therefore were possibly exposed not only to a higher
concentration of signaling molecules but also decreased nutrients. (Cell media was not exchanged until Day 4 in this study as part of conventional biweekly media exchange proto-col.) Such an empirical trend with generation is particularly interesting considering that the generation assigned to the analyzed cells was relative to the beginning of the experiment. In other words, all “first generation” cells reported here were any number of generations in their previous passages prior to our time lapse imaging experiment. Yet, once the cells were removed from a ~70% confluent culture and plated in very sparse conditions, the cells exhib-ited biophysical properties more similar to each other than to cells in their own progeny sev-eral generations later (Figs3and5). Further, upon initial plating, the so-termed first
generation cells had an unusually long growth phase (S5 Fig) that has been documented else-where [7]; most first generation cells did not divide until ~1 day after plating (approximately the average lifetime of all cells studied), despite the fact that these cells were presumably at dif-ferent cell cycle points when harvested at the previous passage. These findings motivate future studies that explore whether media composition (and changes in that media composition over culture time) are causal or correlative in the resetting or adaptation of these cell attributes dur-ing passagdur-ing.
While it was of primary interest to determine whether or not colonies that appeared homo-geneous at Day 4 eventually diversified in our study, analysis of select colonies beyond Day 4 (the time point at which medium was also exchanged, incidentally) was also motivated by the quantitative observation that cell spread area decreased with each new generation. We did not design this study to determine whether heterogeneity was caused by the media exchange
protocol or composition, but we recognized that this media exchange step in a conventional culture protocol addresses nutrient depletion and byproduct removal. Indeed, as is demon-strated in Figs7andS7, rapidly and uniformly dividing colonies exhibited abrupt and strong deviations from generational trends upon replacement of the culture medium at Day 4. We also note that cells belonging to colonies that contained slow-dividing progeny migrated a shorter distance over the course of their lifetimes (p < 10−6) and had a larger area before divi-sion (p < 0.01) when compared to cells belonging to colonies containing only fast or moderate proliferators; future studies could be designed to explore whether the local chemical environ-ment (e.g., cell-secreted factors) differ for cells of different proliferative capacity as another possible source for the seemingly stochastic deviations in the generational trends of a given progeny (Figs5andS5). Of course, such effects of chemical promoters of BMSC intracolony and population heterogeneity are speculative in the current study design. These observations are included to motivate future efforts in elucidating the effects of expansion medium replen-ishment and signaling from BMSC subpopulations, as well as contributions thereof to the causes of emergent heterogeneity in proliferating MSCs.
Conclusions
We provide herein a detailed analysis of dozens of morphological, positional, and proliferative kinetics of colony-forming cells, obtained through time lapse image analysis. We have demon-strated that colonies developed under sparsely seeded conditions (approximately 30 cells/cm2) were rarely formed by single cells. Regardless of origin, most colonies demonstrated heteroge-neity in terms of proliferative capacity and biophysical properties after only four days of growth (Figs4andS1), and even the most uniform single-cell-derived colonies were infiltrated by neighboring progenies and exhibited heterogeneity within seven days (Figs7andS7), sug-gesting that heterogeneity onset even in putative stem cell colonies is inevitable under cur-rently typical culture conditions. Additionally, after only four days of growth, a fraction of cells in nearly all colonies became senescent and by definition were no longer stem cells. Our find-ings suggest that, typically and unless otherwise confirmed, colonies grown in sparsely plated BMSC cultures are neither accurate representatives of the entire putative stem cell subpopula-tion, nor collections of functionally homogeneous stem cells originating from a single rapidly dividing mother cell.
This analysis demonstrated that physical cell-cell contacts did not alter the biophysical properties or proliferative capacity of cells, (Figs6andS6), a quantification that matched our previous findings [7] as well as our observations of extended time lapse movies of colony for-mation (S8andS9Figs). We have additionally reported that BMSCs, regardless of their prolif-erative and biophysical history during previous expansion, slowly change their behavior with each successive generation and that cells within the same generation could exhibit behavior more similar to each other than to cells belonging to the same colony or cells in their own progeny born later in time. Such phenomena demonstrate the need for further study of how the traditional culture conditions (and perturbations of such) impact rapidly dividing cells of any origin. More specifically, these findings provide first steps toward developing a better understanding of the mechanisms underlying biophysical and functional heterogeneity onset, in an effort to improve therapeutic outcomes for this promising class of stem cells.
Materials and methods
1. Contact for reagent and resource sharing
Further information and requests for resources and reagents should be directed to and will be fulfilled by the Lead Contact and corresponding author, Krystyn Van Vliet ([email protected]).
2. Experimental model and subject details
2.1 Cell source. BMSCs were obtained through generous donation by RoosterBio, Inc.
(Frederick, MD, USA) at passage 2 (P2). The cells were obtained from a healthy male donor (age 31–45). The cells were screened by the company for positive adipogenic and osteogenic differentiation staining, as well as for biomarkers via flow cytometry with the following results: <5% positive for CD14, CD34, and CD45; >99% positive for CD166, CD105, CD90, and CD73. These cells are commercially referred to by the company as human bone marrow-derived mesenchymal stem cells.
2.2 Cell culture: Expansion and freezing. BMSCs were cultured in expansion medium
containing 89% low-glucose Dulbecco’s Modified Eagle Medium, 1% penicillin-streptomycin (10,000 U/mL), and 10% fetal bovine serum (FBS) lot-screened for colony formation, popula-tion doublings, and differentiapopula-tion into the adipogenic and osteogenic lineages. Cells were cul-tured until 70% confluent, detached using trypsin-EDTA (0.05%) and cryogenically frozen as P3 in a solution of 90% FBS and 10% dimethyl sulfoxide until further use. For experiments, cells were thawed at P3 and plated at 500 cells/cm2in the same expansion medium described above. Cells were fed twice per week and, upon reaching 70% confluency, were trypsinized as P4 cells and replated for experimentation. All reagents were purchased from ThermoFisher Scientific (Waltham, MA, USA).
3. Method details
3.1 Cell plating sensity assay. 3.1.1 Motivation. To our knowledge, an assay to estimate
actual plating density used in experiments involving BMSCs has not been published prior to this work. In our time lapse imaging experiments, we used glass Petri dishes rather than the traditional tissue culture polystyrene ones to optimize image quality. While we did plasma treat the glass approximately two hours prior to seeding, we hypothesized that fewer cells would attach to the dish than expected, motivating the development of a protocol to estimate actual plating density.
3.1.2 Plating into petri dishes using limiting dilution. Petri dishes that were 60 mm in
diameter and that each contained a glass well 35 mm diameter were plasma treated for 10 min-utes using a plasma chamber (Diener Electronic, Ebhausen, Germany). Dishes were then placed under a UV light in a sterile tissue culture hood for approximately two hours while cells were counted and diluted. Prior to plating, dishes were also rinsed with water to remove any dust acquired from plasma treating and to ensure the glass surface was hydrophilic.
BMSCs were expanded to 70% confluency in T-175 flasks and trypsinized as P4 cells. Fol-lowing trypsin neutralization and centrifugation, the cells were counted using a standard glass hemacytometer. After counting, cells were pipetted again to ensure uniform suspension, and 10% of the cell solution was transferred to a microcentrifuge tube and diluted with expansion medium to 1 mL. Cells in the 1 mL suspension were again pipetted, and 100μL of that 1 mL was pipetted into a new centrifuge tube and diluted to 1 mL. This process was repeated until a suspension of approximately 1,000 cells/mL was achieved (usually 3 dilutions were needed). The final suspension of cells was then plated into the glass well of a Petri dish at a theoretical density of 100 cells/cm2. This entire process was then repeated for each Petri dish using a new, unique dilution, where one experiment consisted of five dishes.
3.1.3 Plating density measurements. After approximately six hours (the time at which
imaging began in the main experiment), cells were fixed and stained with a 0.5% solution of crystal violet (Sigma Life Science, St. Louis, MO, USA) in 100% methanol (Sigma-Aldrich, St. Louis, MO, USA). All cells present in each dish were then counted (N = 5 dishes for each of two experiments), and the plating density was calculated by dividing the number of cells by
the surface area of the glass well. Counting cells was aided by drawing a grid on the bottom of each dish in a fashion akin to a hemocytometer. In the first experiment, the plating density was 17 +/- 5 cells/cm2, and in the repeat experiment the density was 29 +/- 4 cells/cm2, from which we have concluded that, in our hands, a theoretical plating density of 100 cells/cm2 on glass-bottomed dishes leads to a much lower actual plating density.
3.2 Time lapse imaging. 3.2.1 Initial image acquisition. Time lapse imaging of
develop-ing colonies was conducted in two separate, identical experiments. For each experiment, BMSCs were plated into five plasma-treated glass Petri dishes in the same fashion as outlined above (seePlating into Petri Dishes using Limiting Dilution in the Cell Plating Density Assay section prior to this one). After approximately six hours, dishes were inspected to ensure cells had attached. The dishes were then assessed for how far apart individual cells were. The dish with the most isolated cells was used in time lapse imaging, and the remaining four were kept in an incubator at 5% CO2and cultured in parallel as positive controls of cell growth.
Expan-sion medium was added to all dishes such that the total volume was 5 mL.
Imaging was done with the petri dish kept in a stagetop incubator (Tokai Hit, Shizuoka, Japan) set at 5% CO2 and the water bath kept filled with filtered, autoclaved water for maxi-mum possible humidity. A temperature probe was kept submerged in the MSC expansion medium at all times as a feedback sensor so that the stagetop incubator could be kept at 37˚C, and the instrument was calibrated for temperature control before each use. Imaging was done with an Olympus IX81 microscope (Olympus, Shinjuku, Tokyo, Japan) with a phase contrast 10x objective. Beginning at the top of the glass well, the dish was systematically scanned left to right, top to bottom for attached cells. Cells that were especially large and circular in morphol-ogy, reminiscent of the often-cited “Type II” morphology [8], as well as cells that had more than 2 neighbors in the field of view (FOV), were omitted from imaging; the location (micro-scope coordinates) of all other cells was captured using Metamorph’s Multidimensional Data Acquisition application, with the cell(s) of interest positioned at the center of the FOV. This process was carried out to capture the location of as many cells as possible over the course of one hour in an effort to begin imaging before cell division occurred, resulting in the capturing of 55 locations in one experiment and 70 locations in the second. Once the locations were recorded, a MATLAB script was used to calculate the appropriate stage coordinates such that each location had a 2x2 FOV grid (1.7 x 1.3 mm). These coordinates were saved as a text file and imported back into Metamorph. Time points were set to every fifteen minutes, and imag-ing began approximately 7.5 hours after initial platimag-ing.
3.2.2 Monitoring of colony development. As the BMSCs migrated and proliferated into
colonies, there was a need to increase the number of fields of view (FOV) during the course of the 14-day experiments. However, because our microscope stage was limited to being able to capture 400 images per 15-minutes time point, locations being monitored needed to be omit-ted with each FOV expansion. This monitoring was made possible through a MATLAB script that organized images by the location they belonged to, stitched the images into a montage, and made a video (seeS8andS9Figs). The script ran every hour in order to reduce the total number of files in the output folder of Metamorph and to ensure that any videos monitored would represent the most current state of each location.
Videos were monitored daily for colony growth. Approximately two days after initial seed-ing, some of the monitored cells were close to migrating out of the FOV grid, and so the num-ber of FOVs for each location was increased from 4 (2x2 FOVs, 1.7 x 1.3 mm) to 9 (3x3 FOVs, 2.6 x 2.1 mm). Locations in which cells were proliferating slowly (or not at all) were omitted from further monitoring in this transition. This process was continued until the FOV grid needed to be expanded again to a 4x4 FOV grid (Day 4, 3.5 x 2.6 mm) and finally a 5x5 FOV grid (Day 8, 4.3 x 3.3 mm). A total of 15 monitored locations remained in each experiment
after the transition to a 5x5 FOV grid, and these areas were monitored for approximately 14 days. Out of the combined 30 colonies, 28 were suitable for analysis, while the other two migrated too rapidly for single cell tracking. In two of the remaining 28 locations, the colony under development at Day 4 merged with another nearby analyzed colony by Day 7 (see colo-nies O1/O2 and Q1/Q2 inS1 Fig). Both experiments resulted in approximately 1.1. terabytes of raw data (phase contrast images) each.
3.3 Single-cell measurements of time lapse images. 3.3.1 Image processing and cell seg-mentation. Several specific and detailed steps were required in order to track cells in each
col-ony at the single-cell level. All colonies were processed and tracked as individual datasets, and estimates for the time required of each step for a typical colony are provided. The first step consisted of masking the images in an attempt to remove all background pixels and was per-formed using the phase contrast reconstruction algorithm proposed by Yin and Kanade [29], which minimizes a quadratic cost function and then applies thresholding in an attempt to seg-ment cells. All acquired phase contrast images of the 28 aforeseg-mentioned locations (approxi-mately 25,000 images per colony) were masked using high-performance clusters located at the Massachusetts Green High-Performance Computing Center (Holyoke, MA, USA).
Masked images were then run through a simple pipeline in CellProfiler version 2.0.11710 [30] that identified all objects (i.e., BMSCs and artifacts not removed in masking) in the image, converted those objects into a new image, and saved that image separately. The resulting “identified objects” (IO) image was a representation of how CellProfiler interpreted individual cells; each interpreted object was a different color, and touching cells that were not successfully segmented would appear as the same color. From there, side-by-side stacks of images–one stack of the original phase contrast images, and one stack of the identified objects images– were opened side by side in ImageJ [31]. The windows synchronization tool enabled research-ers to correct the identified objects images by directly tracing the phase contrast images with the paintbrush. The following corrections were made to the identified objects images: 1) all cells present in the colony that belonged to the originating progeny had a 10-pixel white dot placed on them as a “seed” for downstream processing, 2) in the case of larger, flatter cells, the cells were outlined to connect missing pieces of the cell caused by overly-aggressive masking, and 3) cells that were touching (as shown by appearing as the same color in the identified objects images) were segmented by drawing a null-pixel (black) line 5 pixels wide between their touching borders. Cells that were touching (i.e., sharing perimeters, and therefore not easily identified as separate objects in a single static image) were often identified by researchers by flipping through several images at previous and future time points. For each colony, images corresponding to 374 15-minute time points were processed in this way and took approxi-mately 22–70 hours per colony (depending on the size and complexity of the colony). These adjusted identified objects images were then processed in a second CellProfiler pipeline that filled in all holes created by cell outlines and eliminated any objects not seeded in the previous step (approximately 12–17 hours per colony, depending on the available memory and process-ing power of the computer used). These processed images were then saved, inspected to ensure they were representative of the phase contrast images (e.g., no cells were missing, and no debris was present), and then submitted to tracking in CellProfiler.
3.3.2 Tracking and measurements in CellProfiler. Images processed using the methods in
the previous section were run through a simple pipeline in CellProfiler that identified primary objects, assigned those objects numbers, tracked the objects, displayed the object numbers on the images, and saved the images (approximately 22–36 hours per colony, depending on the available memory and processing power of the computer used). The resulting output file was then run through a MATLAB script (versions 2014a through 2016a; The MathWorks Inc., Natick, MA, 2000) that assigned a unique identifier to each cell (e.g., if one cell was present at
day 1, it was assigned an ID of 1, and its children IDs of 2 and 3 at later time points) as well as the corresponding object number of that cell at every time point. The result was a two-dimen-sional matrix of object numbers, with rows corresponding to each of 374 time points and col-umns corresponding to each unique cell over time. Cells that did not exist at any given time point (e.g., the originating cell after it divided into two unique daughter cells) were given an object number of 0. This matrix was exported as an Excel spreadsheet for further analysis.
The resulting spreadsheet was formatted in Excel to highlight all cells with a value of 0 for ease of visualization. The spreadsheet was then inspected for tracking errors: a given column contained non-zero object numbers for all time points (rows) the corresponding cell was in existence. At the time point a column began containing zeros (signifying a supposed division), two columns previously containing zeros would begin yielding non-zero object numbers (sig-nifying the daughter cells of the dividing cell). Any instances where this was not the case was considered an error and subject to further investigation. Further, the object number of a divid-ing cell at its final time point, as well as the object numbers of the corresponddivid-ing daughter cells at the next time point, were noted and verified in the tracked images (which displayed the object number of each cell at each time point). Any errors found in this manner (for instance, two cells that were not properly segmented for a time point and therefore appeared in the spreadsheet as one cell disappearing without two new cells appearing) were corrected, and the image set was run through the tracking pipeline again. This process was iterative, with the total active time for correcting each colony amounting to approximately 2–3 hours (depending on the complexity of the colony and the number of initial errors), and the tracking process requir-ing approximately 22–36 hours for each iteration (dependrequir-ing on the memory and processrequir-ing power available for a given computer used).
Once no apparent tracking errors were present, the images were run through a more com-plex tracking pipeline in CellProfiler, which included several more modules in addition to the ones in the previous pipeline. These modules measured the area occupied in each image, infor-mation about neighboring cells for each cell (where a neighbor was considered at 15 pixels away), and information about the cells’ size and shape (approximately 70–110 hours per col-ony, depending on the computing power of the computer used). The pipeline further saved images of the identified objects as .mat files (which, when loaded into MATLAB, yielded a 2D matrix of every pixel in the image, where the values were either 0 for a null pixel or the object number for a pixel belonging to an identified object) for further use in data visualization (see “Procedures for Data Visualization” below). The resulting output file was then run through a MATLAB script that constructed cell lineage trees (with the width of the lineage lines repre-sentative of cell spread area, developed for Whitfield et al., 2013), which were inspected for any further possible errors. Errors spotted, if any, were corrected and run through the extensive pipeline again. The occurrence of errors at this stage was rare and took less that one hour to correct (plus an additional 70–110 hours to run through CellProfiler again). The resulting out-put file for each colony was analyzed further using MATLAB (see “Single-Cell Time Lapse Image Analysis” in the Quantification and Statistical Analysis section below).
Overall, each colony required 4–8 weeks of full-time work (where a week here is defined as 50 hours, with 100% of time devoted to processing) in order to process 374 images per colony at the single-cell level. Together, all processed colonies are a result of the combined efforts of 25 researchers, though we note that improvements and semi-automation of the processing over this period resulted in reduced human time required for validated image processing.
3.4 Procedures for data visualization. 3.4.1 Image overlay to represent cell generation and progeny (Figs1andS1). During tracking, .mat files were saved for each image (time
point) in a given colony. Uploading these files into MATLAB displayed a 2-D matrix represen-tative of the image, where each entry in the matrix was a value corresponding to a pixel. The