Centre for Tourism Research, Development and Innovation (CiTUR)
XI INTERNATIONAL TOURISM CONGRESS - ITC´19 | 167
Title XI International Tourism Congress - The Image and Sustainability of Tourism
Destinations (Proceedings Book).
Editing and Property Centre for Tourism Research, Development and Innovation (CiTUR)
Printing Online Edition http://itc.citur-tourismresearch.com/
Editorial Board
Susana Teles | Paulo Almeida | Mara Franco | João Paulo Jorge
ISBN: 978-989-97395-1-2
The Book is open access and double-blind peer reviewed.
Authors are responsible for the linguistic and technical accuracy of their contributions
© 2020 Centre for Tourism Research, Development and Innovation (CiTUR)
Financed by national funds through FCT - Foundation for the Science and Technology, I.P. (UID / GES / 04470/2019)
Proceedings Book – XI International Tourism Congress (ITC’19), 05-07 November 2019, Funchal, Portugal
390
Exploring Environmental Satisfaction in Tourist Sites: A View to
Madeira Island
Luís Motaa, Mara Francob, Renato Marquesc and Bruno Gaspard
a University of Madeira, CiTUR-Madeira
Colégio dos Jesuítas, 9000-082 Funchal; [email protected] b University of Madeira, CiTUR-Madeira
Colégio dos Jesuítas, 9000-082 Funchal; [email protected] c University of Madeira
Colégio dos Jesuítas, 9000-082 Funchal; [email protected] d University of Madeira
Colégio dos Jesuítas, 9000-082 Funchal; [email protected]
Abstract
Characterizing tourism sustainability and studying environmental satisfaction in tourist sites, is part of a pilot study taking place in Madeira island. Tourism stakeholders and associations of relevant tourism services were interviewed to diagnose environmental issues arising from tourism activity and to identify tourist sites with priority in the study. Satisfaction was benchmarked in four tourist sites using individual attributes and overall fulfilment after experience on Madeira island. Sites ranged from two well-known walking routes in Rabaçal and Ribeiro Frio, representing a concern regarding conservation and visitation to the UNESCO site, the Laurisilva of Madeira; the viewpoint of Cape Girão with a skywalk positioned at 580m high, and the Santa Maria Street in Funchal, a popular street for eating-out, nightlife and street art paintings on entrance doors of the buildings. The experimental hypotheses assumed the same satisfaction level for all sites and by comparing Means of independent samples T-test, tourist sites were benchmarked for the study. Ribeiro Frio was pointed out as hotspot for tourism activity with many apprehensions, but statistics revealed the highest level of environmental satisfaction among visitors and tourists, followed by the viewpoint of Cabo Girão, Rabaçal and Santa Maria Street, and. Despite satisfaction being linked to the amount of people crowding an area, Ribeiro Frio was downgraded to the last position regarding on-site concentration of people. Such information is crucial for tourism planning and to assist further development. Parks, protected areas and tourist sites have attached an important perceived value, having managers interested in understanding
visitors’ opinion in order to overcome challenges related to management, protection and conservation
issues.
Keywords: Environment, benchmarking, island planning satisfaction, tourism
1.
Introduction
Characterizing tourism sustainability and studying environmental protection in tourist sites, is part of a pilot study taking place on Madeira island. Tourism managers concerned with possible impacts from visitor flow, use operational data in the planning and management of attractions (González-Guerrero, Robles, Pérez, Ibarra, & Martínez, 2016). The increasing number of tourists in important locations of the Madeira island is raising concerns about environmental degradation, likewise existing natural resources. Therefore, this study aims to explore individual attributes related
to visitors’ environmental satisfaction after visiting touristic sites on Madeira Island. The UNESCO
Proceedings Book – XI International Tourism Congress (ITC’19), 05-07 November 2019, Funchal, Portugal
391
viewpoint with a skywalk laying over a 580m high cliff giving view to the Funchal amphitheater,
being one of the “must go” sites when visiting the island; the Santa Maria Street dated from 1430, is
crowded with restaurants and terraces among street art painted on entrance doors, inviting people walking along the street.
2.
Literature Review
Tourists make use of consumer services (Dortyol, Varinli, & Kitapci, 2014), making the sector an attractive study area for consumer behaviour. Nevertheless, tourism’s growth is limited by natural, environmental and social constraints. Therefore, it is necessary to understand sustainability limits for each destination, which can be resource based (McKercher, 1993), activity based (Butler, 2011) or community based (Hughes, 1995). Limits can be set depending on human values and perceptions about resources, indicators, criteria and impacts (Saarinen, 2006). Sustainability lays on specific pillars targeting social, cultural, environmental and economic activities, and development is what we do (Brundtland, 1987). Tourism is a transversal activity as well as being responsible for impacts on the
ecosystem, contributing to changing peoples’ awareness towards the sustainability goals.
Studies focused on sustainable tourism and tourism planning, revealed storied keywords in which, satisfaction is linked to the subjects (Mota, Teixeira, & Gonçalves, 2018). Visitor satisfaction level influences overall judgment of natural areas (Stankey, 1988). Visitor use based on satisfaction levels, represents the lack of specificity, as it does not consider differences among visitors. Satisfaction levels differ and is a result from the total amount of visitors, or density per square meter, being the outcome from the listed satisfaction from a specific area (Lindberg, McCool, & Stankey, 1997). Tourist sites have a perceived value for visitors, likewise for managers interested in new approaches in the service sector. There is a whole experience to be assessed regarding satisfaction linked to the original expectation, with satisfaction being measured as the emotional state of each visitor.
Satisfaction is linked to on-site alternatives available for enjoyment, if it is pleasant and surpass
the visitors’ expectation (Santos, Serrallonga, & Dallari, 2018). Being composed by individual
attributes and the overall fulfilment after experience, its perception is sought to be taken into policy-making processes and management practices. In turn, perception is much more than actual expectation regarding on-site attributes, services and infrastructure. Service quality is an asset conferring satisfaction levels to visitors (Moore et all., 2015), likewise individual attributes relating the courteousness of personnel found in any instance of the visitors’ journey, conditions and maintenance of the tourist attraction (Needham & Rosenberger, 2011) with responsible environmental management (Wiberg, 2009).
2.1 Tourism sustainability and satisfaction on Madeira Island)
Tourism potential on Madeira Island lays mainly on natural resources available for the activity. The LIFE09 INF/P/00045 (Life Eco Compatible) was a joint project developed on the Madeira Archipelago in 2010-2015 to transmit and keep available important information for managing sites from the Natura 2000 network. Within this action, visitors answered a survey designed to register the amount of people visiting protected areas, establishing their profiles and register their satisfaction lever regarding the visit (IFCN-IP-RAM, 2018). In 2010-2012 and 2014, the Portuguese Institute for Forests and Natural Conservation had in place a survey to register
visitors’ opinion about one of the most visited sites on Madeira, Ponta de São Lourenço. They were
649 visitors registering their satisfaction levels regarding personnel, services and facilities available along the trail and picnic areas, likewise their cleaning conditions and overall visit to the site (IFCN-IP-RAM, 2018a).
Almeida, Soares and Alves (2013) are studying tourism as an economic activity and their contribution to the variety of offers on Madeira Island. Reports state the value given to the
experience and the opportunity to have direct contact with nature. Tourists’ motivation to visit the
Destination is linked to the unique island landscape, trekking on levadas and the climate. The
demand for tourism satisfaction increases as visitors become more familiar with the destination,
looking for authenticity and fulfillment in new expectations of tourism activities (Valls, Mota, Vieira, & Santos, 2019).
Proceedings Book – XI International Tourism Congress (ITC’19), 05-07 November 2019, Funchal, Portugal
392
3.
Methodology
Tourism stakeholders and associations of relevant tourism services were interviewed to recognize environmental issues arising from tourism activity, and which tourist sites would gain priority in the study. Information was cross-checked with the major tourism flow and scientific studies
for obtaining the state of art of tourism activities on Madeira Island. As four tourist sites were indicated for benchmarking, parametric tests were used to compare two independent samples at the time. The statistic test verified if the variances were equal when relating the Means of independent Two-Sample t-Test (Maroco, 2004). The probability that individual attributes are less than 0.05 implied that the null hypothesis can be statistically rejected (TBA, 2009).
Assuming the Mean for the satisfaction level was equal in all sites, the following hypotheses were considered:
H0: µRabaçal = µRibeiro Frio, with µ being the Mean of the satisfaction
level. H1: µRabaçal ≠ µRibeiro Frio, with µ being the Mean of the
satisfaction level.
H2: µRabaçal = µCabo Girão viewpoint, with µ being the Mean of the satisfaction
level. H3: µRabaçal ≠ µCabo Girão viewpoint, with µ being the Mean of the
satisfaction level. H4: µRabaçal = µSanta Maria Street, with µ being the Mean of the satisfaction level.
H5: µRabaçal ≠ µSanta Maria Street, with µ being the Mean of the satisfaction level. H6: µRibeiro Frio = µCabo Girão viewpoint, with µ being the Mean of the satisfaction
level. H7: µRibeiro Frio ≠ µCabo Girão viewpoint, with µ being the Mean of the
satisfaction level. H8: µRibeiro Frio = µSanta Maria Street, with µ being the Mean of the satisfaction level.
H9: µRibeiro Frio ≠ µSanta Maria Street, with µ being the Mean of the satisfaction level. H10: µCabo Girão viewpoint = µSanta Maria Street, with µ being the Mean of the satisfaction
level. H11: µCabo Girão viewpoint ≠ µSanta Maria Street, with µ being the Mean of the
satisfaction level.
The SPSS 23 was set with 5% significance level to reject the average of the satisfaction levels being identical. This study takes satisfaction levels regarding individual attributes as this could be a predictor for overall satisfaction and recommendation for visiting a site. Following the statistic test, each variable was codified to highlight different Means in each tourist site.
3.1.The measurement tool
The questionnaire was drafted in English then translated into the most-common tourist languages in Madeira, namely Portuguese, French, Spanish and German. The translations were carried out by native speakers of each language and then back translated to check conceptual equivalence (Sekaran, 2003). The questionnaire had three parts; the first was intended to collect details about the trip. The questionnaire was directed to local visitors and workers and to both, domestic and foreign tourists. It included a question asking if the interviewee had a disability and another enquiring about the amount of money spent at the nature-based tourist attraction. The second part registered the satisfaction level to study common aspects among sites. Questions related to site management and environmental conditions were adapted from published studies from Needham & Rosenberger (2011), Okech (2010) Wiberg (2009) and Zacarias et al. (2011). There were also some new questions about the cleanliness of the attraction and respective sense of crowding. A 7-point Likert-type scale was used to measure satisfaction level, with 1 representing
“not satisfied” and 7 “very satisfied”. The third section aimed to collect sociodemographic
information, ending with a comment box for suggestions.
3.2.Sampling
Proceedings Book – XI International Tourism Congress (ITC’19), 05-07 November 2019, Funchal, Portugal
393
adapted to each site and to random people. Seven days between May and June, were taken for fieldwork at Casa do Rabaçal, where 481 people answered the questionnaire after visiting PR6/PR6.1; 430 people registered their answers at the Cabo Girão viewpoint during seven days within the first two weeks of august. The same questionnaire was delivered to 468 people at the beginning of the trail PR11 after visiting Ribeiro Frio during twelve days between August and September, and during six days within the first two weeks of December, 167 people answered the questionnaire at the Santa Maria Street. The total of 1546 questionnaires satisfied the requirement for a representative sample with a 95% confidence interval of the universe of 2,158,943 people, covering the total population in the Madeira Archipelago and total arrivals to Madeira by plane and cruise ship.
4. Findings and discussion
Table1: Research question for benchmarking environmental satisfaction and sense of crowding.
Environment R-RF R-CG R-RSM RF-CG RF-RSM
CG-RSM
Information signs 2 1 1 1 1 2 Availability of parking areas 1 2 1 1 2 1 Number of rubbish bins 1 1 1 1 1 1 Number of toilets/bathrooms 1 1 1 1 2 1 Conditions of toilets/bathrooms 2 1 2 1 2 1 Condition/maintenance of the tourist attraction 1 1 2 1 1 1 Presence of wildlife 1 2 1 1 1 1 Overall cleanliness of the attraction 2 1 1 2 1 1 Forest condition 1 1 1 1 1 1 Native plants in the landscape 2 1 1 1 1 1 Levels of noise pollution 1 1 1 2 1 1 Levels of air pollution 2 1 1 1 1 1 Opportunities to learn about nature 2 1 2 1 2 1 Conscious environmental management 2 2 1 1 1 1
Sense of crowding
Souvenirs area 1 1 1 1 2 1 Food & beverage area 1 2 2 1 1 1 Parking area 1 1 1 1 2 1 Along the attraction 1 1 1 1 2 2 Note: R (Rabaçal), RF (Ribeiro Frio), CG (Cabo Girão viewpoint), RSM (Santa Maria Street)
From interviewing stakeholders and associations, attributes were identified and linked to the most popular tourist sites on Madeira Island. Sites for trekking in the Laurissilva forest located in Rabaçal, Ribeiro Frio and the Cabo Girão viewpoint were the most cited due to its ecological value, attractiveness and number of visitors perceived by the interviewees. There was a perception of congestion and crowding, wondering the impact created by tourism activity. The belief is higher than the expectation of assets found in each property enhancing visitors’ satisfaction level (Moore et all., 2015). The Santa Maria Street was introduced in the study to have an outstanding site for comparison. Besides being a popular area for visiting, it is unique with a view to the amphitheater of Madeira, the magnificent street art scenery and stage for local businesses, eating out, music and night life.
Using the SPSS for running the independent two sample test relating two tourist sites, first the Levene test verified the homogeneity of variances. For each significance below 0.05, hypotheses with equal variance were rejected. Following the same hypothesis to reject identical Means for
Proceedings Book – XI International Tourism Congress (ITC’19), 05-07 November 2019, Funchal, Portugal
394
satisfaction levels, Table 1 provides the overview of each individual attribute related to visitors’ environmental satisfaction and the respective sense of crowding after visiting touristic sites on
Madeira Island. The coding assigned the value “1” when for different Means with p<0.05 and number “2” when Means were statistically equal with p>0.05.
The study placed emphasis on the Means calculated as they carry higher potential to explore differences between attributes on each tourist site. The four locations have different characteristics
and surroundings with a variety of assets enhancing visitor’ satisfaction (Moore et all., 2015; Santos,
Serrallonga, & Dallari, 2018). Attributes are not specific such as the exact number of parking spaces available, indication of the magnitude of pollution levels, what type of wildlife encountered, type and quality of information signs, etc. Instead, they were related to general condition of the property, and differences among visitors were not considered (Lindberg, McCool, & Stankey, 1997).
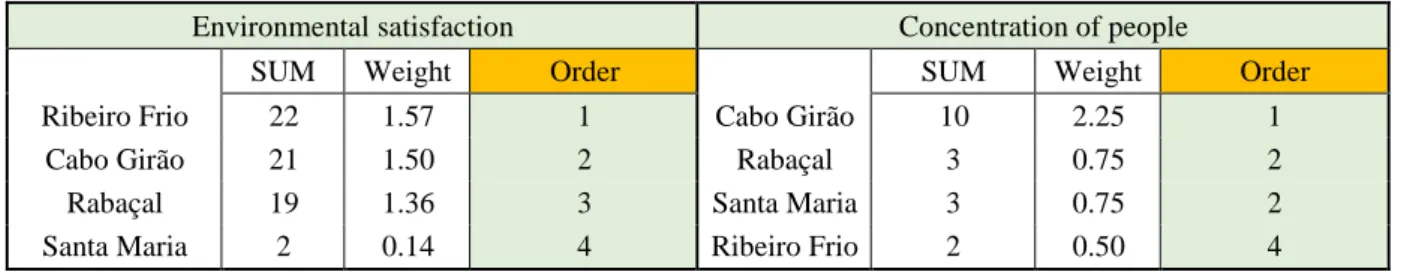
Tourist sites located in the Laurissilva of Madeira registered less differences in the statistical Mean calculated for individual attributes, and manufactured tourist sites such as the Cabo Girão viewpoint and the Santa Maria street have great number. The coding used on Table 1 was considered to highlight tourist sites registering higher Mean values. Table 2 provides the ranking associated to this study in regards environmental satisfaction and the respective sense of crowding. Analyzing different Mean values obtained, Ribeiro Frio was positioned in the first place with higher environmental satisfaction. This site was previously cited with major concerns regarding environmental impacts created by high number of visitation and traffic congestion. Nevertheless, the site was mentioned more often by having higher satisfaction levels in the benchmark. The sense of crowding positioned RF on the last place as it is linked to other variables than only the concentration of visitors found in the attraction. During fieldwork, it was observed traffic congestion, cars parking along the road, and groups of visitors up to 86 people arriving to the site. As explained by Moore et all. (2015), service quality experienced during the visit and surrounding environment influences the
visitor’s perception for registering higher/lower satisfaction level, in which on-site attributes play a
secondary role.
Table 2: Ranking of satisfaction on tourist sites and sense of crowding.
Environmental satisfaction Concentration of people
SUM Weight Order SUM Weight Order Ribeiro Frio 22 1.57 1 Cabo Girão 10 2.25 1
Cabo Girão 21 1.50 2 Rabaçal 3 0.75 2 Rabaçal 19 1.36 3 Santa Maria 3 0.75 2 Santa Maria 2 0.14 4 Ribeiro Frio 2 0.50 4
The Santa Maria Street was ranked in the last position regarding environmental satisfaction, but it was ranked number two regarding on-site magnitude of people crowding the circa 700m of street length. The way is crowded with restaurants taking pedestrians in a zigzag through terraces and street artwork painted on entrance doors. Like on Santos, Serrallonga, and Dallari (2018) study, it is highlighted the importance of on-site alternatives available for enjoyment.
5. Conclusions and implications
When assuming equal satisfaction levels in the benchmark, managers can immediately test attributes conferring understanding of the magnitude for satisfaction levels. It is a valuable information for stating success or drawing corrective actions related to property management. This
study was an opportunity for benchmarking visitors’ fulfilment in different sites of the island, being
a contribution for reporting on-site satisfaction levels. Furthermore, it is a contribution for better performance regarding the suggested environmental attributes.
Proceedings Book – XI International Tourism Congress (ITC’19), 05-07 November 2019, Funchal, Portugal
395
6.
Acknowledgements
The authors thank the Tourism Project: Characterization, Impact and Sustainability of Madeira Tourism (M14-20-01-0145- FEDER-000007), a research unit from the CITUR - Centre for Tourism Research, Development and Innovation (Hub University of Madeira), co-financed by the Operational Program Madeira 2014-2020, Portugal 2020 and the European Community, through the European Fund for Regional Development.
7. References
Brundtland, G. (1987). Our Common Future: Report of the World Commission on Environment and Development. Oxford, England: Oxford University Press.
Butler, R. W. (2011). Tourism area life cycle. Oxford, England: Goodfellow Publishers Limited.
Dortyol, I. T., Varinli, I., & Kitapci, O. (2014). How do international tourists perceive hotel quality?:
An exploratory study of service quality in Antalya tourism region. International Journal of
Contemporary Hospitality Management, 26(3), 470-495.
Gonzalez-Guerrero, G., Robles, A.K.O., Perez, M.E.V., Ibarra, R.M., & Martinez, T.C. (2016). The Application of the Tourist Carrying Capacity Technique and its Critical Analysis for Tourism
Planning. Tourism Planning & Development, 13(1), 72-87.
Hughes, G. (1995). The cultural construction of sustainable tourism. Tourism Management, 16(1),
49-59.
IFCN-IP-RAM (2018). [Life Eco Compatible]. Unpublished raw data.
IFCN-IP-RAM (2018a). [Ponta São Lorenço visitors’ satisfaction]. Unpublished raw data. Maroco, J., & Bispo, R. (2003). Estatística Aplicada às Ciências Sociais e Humanas. Lisbon,
Portugal: Climepsi.
McKercher, B. (1993). Some Fundamental Truths About Tourism: Understanding Tourism's Social
and Environmental Impacts. Journal of Sustainable Tourism, (1), 6-16.
Moore, S.A., Rodger, K., & Taplin, R. (2015). Moving beyond visitor satisfaction to loyalty in nature-based tourism: A review and research agenda. Current Issues in Tourism, 18(7), 667–683. Mota, L., Teixeira, S., & Gonçalves, F., (2018). Remarks from Tourism and Sustainable Tourism – A
Bibliometric Study. Enlightening Tourism. A Pathmaking Journal, 8(2), 99-127.
Needham, M.D., & Rosenberger, R.S. (2011). Comparison of day users, overnight users, and survey
approaches at Champoeg State Heritage Area. Retrieved from Oregon State University, Department of Forest Ecosystems and Society:
http://nature.forestry.oregonstate.edu/sites/default/files/2009-
1%20Champoeg%20Final%20Project%20Report%20-%20Needham%20and%20Rosenberger%20-%2003-09-2011.pdf
Lindberg, McCool, & Stankey, 1997. Rethinking Carrying Capacity. Annals of Tourism Research,
24(2), 461-464.
Okech, R. N. (2010). Socio-cultural Impacts of Tourism on World Heritage Sites: Communities' Perspective of Lamu (Kenya) and Zanzibar Islands. Asia Pacific Journal of Tourism Research,
15(3), 339-351.
Saarinen, J. (2006). Traditions of sustainability in tourism studies. Annals of Tourism Research, 33(4), 1121-1140.
Santos, F., Serrallonga, M., & Dallari, F. (2018). Touirsm at World Heritage Sites: Opportunities and Challenges. In S. Ascaniis, Maria Gravari-Barbas, & L. Cantoni (Eds), UNESCO UNITWIN
Proceedings Book – XI International Tourism Congress (ITC’19), 05-07 November 2019, Funchal, Portugal
396
Network “Culture Tourism and Development” (pp. 21-29). Retrieved
from
https://www.fun-mooc.fr/asset-v1:Paris1+16012+session01+type@asset+block/MOOC_TM at UWHS_manual.pdf
Sekaran, U. (2003). Research Methods for Business (4th ed.). New York: John Willey and Sons. Stankey, G. H. (1988). Carrying Capacity in Recreation Settings. Bo Shelby and Tom Heberlein.
Journal of Leisure Research, 20(1), 81-83.
TBA (2009). A simple guide to statistics [PDF]. Retrieved
from http://www.tropical-biology.org/wp-content/uploads/2015/01/Statistics.pdf
Valls, J.F., Mota, L., Vieira, S.C.F., & Santos, R. (2019). Opportunities for Slow Tourism in Madeira.
Sustainability, 11(17), 4534. https://doi.org/10.3390/su11174534
Wiberg, D.S. (2009). Development of a survey measuring visitor satisfaction and service quality of
cultural and natural sites in Belize. (Master Thesis, Utah State University, Logan, Utah, USA).
Retrieved from https://digitalcommons.usu.edu/etd/294/
Zacarias, D. A., Williams, A. T., & Newton, A. (2011). Recreation carrying capacity estimations to