AUDIT FEES AND FIRM PERFORMANCE
por
Vânia Nogueira Moutinho
Dissertação do Mestrado em Finanças e Fiscalidade
Orientada por
António de Melo da Costa Cerqueira Elísio Fernando Moreira Brandão
i ABOUT THE AUTHOR
Vânia Nogueira Moutinho was born in 1988. She has always lived in Maia, where she concluded high school. In 2010 she graduated in Economics from the School of Economics and Management at the University of Porto (Faculdade de Economia do Porto).
ii ACKNOWLEDGEMENTS
Firstly, I would like to thank my supervisors, António Cerqueira and Elísio Brandão, for their timely encouragements and guidance throughout these months of work.
I would also like to thank my family, for understanding the importance of this stage of my life and providing me the conditions to thrive.
My closest friends have shown me continued support and for that I am extremely grateful. Natasha Gomes, Alicia Nogueira, Diana Silva and Ricardo Biscaia: your kind attention and suggestions (even if not content related) have helped me in many ways.
Finally, I cannot stress enough how deeply grateful I am to Rafael Correia, for his patient reassurance and constant certainty in my success.
iii ABSTRACT
There are multiple studies investigating firm performance, in particular studies identifying firm characteristics that drive performance. On the other hand, research on the pricing of audit fees provides credible evidence that the financial condition of a client is a critical factor, in the sense that riskier clients demand more thorough audit procedures. This study investigates the relationship between audit fees and firm performance. Using a sample of U.S. publicly traded, non-financial firms covering the period from 2000 to 2008, a fixed effects model is presented to estimate firm operating performance. The model included standard control variables, such as size, leverage, sales growth and research and development intensity. In addition, measures of corporate governance were introduced. This study provides empirical evidence on the relationship between firm performance and audit fees. Specifically, increases (decreases) in operating performance are connected with decreases (increases) in audit fees. This investigation provides initial grounds on the performance perspective of the stated association.
iv CONTENTS
1. Introduction ... 1
2. Literature Review and Hypothesis Development ... 3
Determinants of Firm Performance... 3
Audit Fees and Firm Performance ... 4
Hypothesis ... 5 3. Research Design ... 7 Sample ... 7 Variables ... 8 Model ... 10 4. Results ... 13 Univariate Results ... 13 Multivariate Results ... 16 5. Concluding Remarks ... 21 Appendix ... 23 References ... 28
v LIST OF TABLES
Table 1 - Variable definitions and number of firm-year observations ... 9
Table 2 – Expected signs for coefficients of equation (3.1) and brief theoretical explanations ... 12
Table 3 – Descriptive Statistics of equation (3.1) variables ... 14
Table 4 – Correlations of equation (3.1) variables ... 14
Table 5 – Equation (4.1) estimation results ... 16
Table 6 – Equations (4.2) and (4.3) estimation results ... 20
Table 7 – Industry profile of sample firms ... 25
Table 8 – Descriptive Statistics of variables subsequently included in the model ... 26
Table 9 – Equations (4.2) and (4.3) with previous audit fees variable estimation results ... 27
vi LIST OF FIGURES
Figure 1 – Boxplots of the variable Earning Power before and after winsorization at the 1st and 99th percentiles ... 23 Figure 2 – Histograms of the variable Assets (winsorized) before and after logarithmization ... 24
1 1. INTRODUCTION
This study investigates the relationship between audit fees and firm performance. In order to make decisions, investors must consider all relevant information about firm performance, and primarily rely on financial statement information. These statements include, in particular, information on fees for audit and non-audit services, subject to mandatory disclosure in the U.S. since 2001 (SEC, 2000). Audit fees have been shown to be related to corporate performance (Hay et al., 2006; Stanley, 2011). Auditors have a potentially privileged position to forecast the client’s economic condition. The risk-based approach of audit planning and subsequent pricing means that clients perceived by the auditor as risky are typically assigned more labor (Bell et al., 2008), which in turn results in higher audit fees. So, audit fees are expected to be a sign of current and future performance (Stanley, 2011).
This research analyzes both theoretically and empirically the relationship between audit fees and firm performance. After specifying the context in which such association arises, a sample of U.S. publicly traded, non-financial firms covering the period from 2000 to 2008 is used in fixed effects regressions on firm operating performance, using the least squares dummy variable (LSDV) estimator. The dataset is mainly composed of financial statement information, downloaded from Thomson Datastream.
This research can be included among the studies that analyze determinants of firm performance. The empirical model includes standard control variables, such as size, leverage, sales growth and research and development intensity. In what concerns the influence of corporate governance on corporate performance, the entrenchment index (E-Index) developed by Bebchuk et al. (2009b) is used. As an additional test, this index is substituted by the insider ownership or the institutional ownership of the firm. Moreover, external auditing and corporate governance can be seen as complementary controls, i.e. a firm with more efficient corporate governance is likely to require more external auditing services (Hay et al., 2008). In view of this evidence, it will be interesting to see if governance and audit fees are both relevant when studying firm performance.
2
Empirical tests provide evidence on the negative relationship between firm performance and audit fees. Specifically, increases (decreases) in operating performance are connected with decreases (increases) in audit fees. This relationship also applies to financial performance. Even though more research is needed, this investigation provides initial grounds on the performance perspective of the stated association. Previous studies found that the economic condition of a client firm plays an important role in the amount of fees paid to the auditor. Additionally, this study documents a negative impact of audit fees on firm performance, so, the main contribution of this research adds both to the audit pricing and to the firm performance literatures.
The remainder of this dissertation is organized as follows. First, the relevant literature is reviewed and the theoretical hypothesis is developed. Then, sample construction and model specification are displayed. The fourth section presents and discusses estimation results. Concluding remarks and future research suggestions are provided in the fifth section.
3 2. LITERATURE REVIEW AND HYPOTHESIS DEVELOPMENT
As stated in the first section, the objective of this study is to analyze the relationship between firm performance and audit fees. To do so, it is necessary, on the one hand, to consider commonly accepted factors of firm performance, and, on the other hand, to understand the origins of the referred relationship. Consequently, this section begins with a review of the main determinants of firm performance, which are later on included as control variables in the constructed model. Then, significant contributions to the audit pricing literature are analyzed, in order to comprehend how audit fees relate to firm performance. Lastly, this study’s hypothesis is developed.
Determinants of Firm Performance
Many have been the studies of the impact on firm performance of a particular phenomenon. This segment provides a review of investigators’ work on presumably key drivers of firm performance.
Lee (2009) examines the particular importance of size among the determinants of firm performance. According to this author, there are three types of factors affecting firm performance. The first concerns the general economic conditions (i.e., the business cycle); the second relates to the firm’s market environment (i.e. its industry context); and the third regards firm-specific factors, which include size, market share, sales growth, inventory management, debt management, capital intensity, advertising intensity and research and development expenses. Because the last three factors may constitute entry barriers, they can be viewed as firm-specific (but) industry oriented-factors. Indeed, Artz et al. (2010) show that research and development spending can have an impact in performance when associated with effective inventions and innovations (patents and product announcements), thus showing improvements in the firm’s competitive position.
Another line of research focuses on the influence of corporate governance. A well governed firm for the purpose of its influence on firm value or performance is described, for example, as: (1) a firm in which shareholders’ rights are not restricted
4
(e.g., Gompers et al., 2003; Bebchuk et al., 2009b); (2) a firm whose directors or board members have adequate ownership (e.g., Bhagat and Bolton, 2008); or (3) a firm whose owners apply tactics to influence managerial activities (e.g., Connelly et al., 2010). Hence, it seems there is a fair preoccupation on the alignment of shareholders’ and managers’ interests/conduct. Results show that good governance faced as in (1) is associated with increased firm value and stock market performance (Gompers et al., 2003; Bebchuk et al., 2009b), but after considering the inter-relations between governance and performance such association only applies to operating performance (Bhagat and Bolton, 2008). The ownership of board members (as in (2)) is also associated with current and future operating performance (Bhagat and Bolton, 2008). Management’s awareness of diverse owner interests increases shareholder influence on firm performance and strategy (Connelly et al., 2010).
Audit Fees and Firm Performance
There is a significant branch of literature dedicated to the understanding of audit pricing. In 1980, Simunic developed a representative model of the process by which audit fees are determined, and since then various authors have continued to bring forth empirical results that show which factors concur to the setting of audit fees. In this segment some of those contributions relevant to this study are reviewed.
Theoretically, the amount of fees for audit services that a client firm pays to its audit firm reflects the level of audit work the latter has to perform in the auditing process. The definition of this level of work embodies the auditor’s assessment of the process’s complexity and the desired level of risk. In other words, all other things considered, if an auditor wishes to decrease the risk of issuing a clean opinion when there are materially relevant distortions in the client’s financial statements, he generally acts on the nature, extent and timing of audit procedures, which, naturally, influence the final amount of required fees.
Additionally, increasing audit efforts are determined by the audit firm’s likelihood of incurring in future losses due to the engagement with that specific client (e.g., Bell et al., 2008; Choi et al., 2008; Simunic and Stein, 1996). Those losses include litigation costs, sanctions from regulatory entities and image and reputation damages. There is empirical evidence that when there is a perception of high levels of liability
5
exposure, audit firms adjust their required fees (Simunic and Stein, 1996); audit fees are influenced by the litigation environment (i.e. the legal regimes of different countries) where the audit firms operate on (Choi et al., 2008); in the face of increasing litigation costs, big audit firms have avoided engagements with risky clients (Jones and Raghunandan, 1998). Pratt and Stice (1994) also found evidence of the existence of an additional premium (relative to increasing level of work) to cover litigation costs.
How exactly do audit firms assess risk engagement, according operation complexity, consequent level of work and corresponding price? Several studies have found, among others, client characteristics that play an important role in this setting. Meta-analyses of audit fee research conducted by Hay et al. (2006) and Hay (2012) report significant associations between audit fees and the following client attributes: size (measured, for example, by total assets, or sales), complexity (e.g., number of subsidiaries, business segments, foreign subsidiaries), risk (e.g., inventory and/or receivables), profitability (e.g., return on investment, loss), leverage and liquidity, internal control, governance (e.g., outside directors, audit committee) and industry. This evidence indicates, in particular (and most notably for this study), the influence of some measures of the client’s financial condition on audit fees’ determination. An interesting recent finding is that audit fees reflect the client’s future performance, because auditors have access to some information that contains forward-looking judgments (e.g., uncollectible receivables, obsolete inventory, pension and warranty costs) (Stanley, 2011). Moreover, the disclosed audit fee is also found to be related with errors in forecasts of earnings made by financial analysts, which could indicate a superlative precision in the predictions of auditors when compared with the predictions of financial analysts. The potential usefulness of this evidence is, of course, a sign embed in the disclosed audit fee of the firm’s future economic condition other market participants could pay attention to.
Hypothesis
As stated before, when pricing their services auditors have in consideration information provided by the client firm. This information may be indicative of the firm’s current and future economic condition, and there has been empirical evidence relating the disclosed audit fees with the client’s current operating performance. Should
6
this connection be true, then a firm’s operating performance may in part be explained with current audit expenses. Hence, the following hypothesis is formulated:
7 3. RESEARCH DESIGN
This section is dedicated to the outline of this study’s model. Initially, the sampling process is described. Secondly, selected variables and respective definitions and sources are presented. Lastly, the equation subject to regression is delineated, as well as predictions of coefficients’ signs.
Sample
During this research, there was a constant vigilance regarding data requirement versus data availability. The principal source was the database Thomson Datastream, which holds extensive historical financial information. However, in order to account for corporate governance mechanisms in the performance model, a different source was needed, since Thomson Datastream does not provide many variables concerning corporate governance. Access to corporate governance specific databases was impractical due to financial restraints. Therefore, it was decided that a publicly available measure should be used.
The Harvard Law School provides at its Program on Corporate Governance webpage data on a corporate governance index – the E-index (Bebchuk et al., 2009b) – for firms followed by the Investor Responsibility Research Center (IRRC) that could be most successfully identified by Thomson Datastream. According to Bebchuk et al. (2009b), each IRRC publication includes corporate governance information for approximately 1400 to 1800 firms, which represent more than 90% of the U.S. stock market capitalization.
From the year 2000 to the year 2008, the E-index file contains observations for 2881 unique firms without dual-class stock, of which Thomson Datastream identified 2656. Because financial firms have a different structure than non-financial firms, those that presented two-digit Standard Industrial Classification (SIC) codes between 60 and 69 were excluded from the sample (following Stanley, 2011). Consult Table 1 for the number of firm-year observations available for each of the variables used in this study.
8
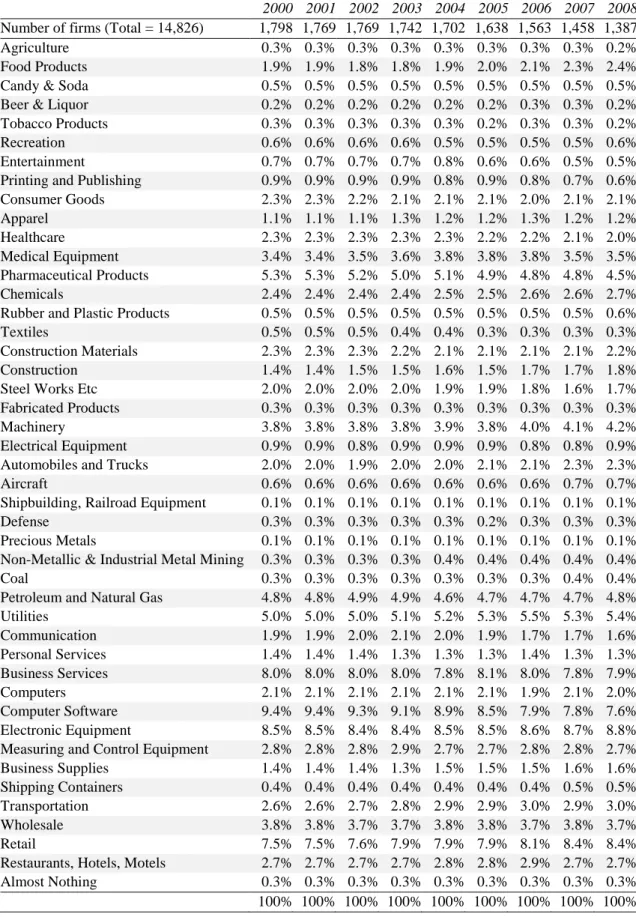
Table 7 in the appendix section provides the industry profile of sample firms using the 49 industry classification of Fama and French.
Variables
Table 1 provides variable definitions and data sources. The majority of variables derives from financial statement information and was retrieved from Thomson Datastream.
There is empirical evidence that when audit firms determine their fees they rely on certain client characteristics, one of them being the client’s financial condition (Simunic, 1980; Pratt and Stice, 1994; Choi et al., 2010). Stanley (2011) uses an operating performance factor in his audit fee model as representative of the client business risk. In order to assess how audit fees relate to firm performance a set of performance and firm value measures were, therefore, used: earning power (Bhagat and Bolton, 2008), return on assets (Lee, 2009), return on equity (Sami et al., 2011), and Tobin’s Q (Gompers et al., 2003; Bebchuk et al., 2009b; Bhagat and Bolton, 2008). The main focus of this study is operating performance, but financial performance and firm value measures were alternatively introduced as dependent variables, to see if the test variable holds its (ir)relevance.
The audit fees variable was initially introduced in logs, as is usual in the audit pricing literature. The performance model includes the following control variables: assets (in logs), for firm size (Lee, 2009), research and development intensity (Lee, 2009; Connelly et al., 2010), capital intensity (Lee, 2009), sales growth (Lee, 2009), leverage (Bhagat and Bolton, 2008; Bebchuk et al., 2009b), and the E-index as representative of corporate governance (Bebchuk et al., 2009b; Bhagat and Bolton, 2008). This last variable can assume the values zero to six if a firm in a certain year has adopted none to six of the following provisions to limit shareholders’ rights: staggered board; limitation on amending bylaws; limitation on amending the charter; supermajority to approve a merger; golden parachute; and poison pill (Bebchuk et al., 2009b). It is important to refer that the E-index is a construct based on data from the IRRC publications, which for the sample period from 2000 to 2008 occurred in 2000, 2002, 2004, 2006, 2007 and 2008. Here, as in Bebchuk et al. (2009b), firm values for the years 2001, 2003 and 2005 were copied from the previous years, under the
9
assumption that provisions to diminish shareholders’ rights did not change between IRRC publications.
Table 1 - Variable definitions and number of firm-year observations
Source Firm-year observations
Dependent variables Earning Power
Earnings Before Interest and Taxes on Assets.
Thomson Datastream:
18191 Earnings before interest and taxes (EBIT)
02999 Total assets
14,260
Return on Assets
Net Income on Assets.
Thomson Datastream:
01651 Net income – bottom line 02999 Total assets
14,804
Return on Equity Thomson Datastream:
08301 Return on equity – total %
14,330
Tobin’s Q
(Book Value of Assets + Market Value of Equity – Book Value of Equity – Deferred Taxes) / Book Value of Assets. Thomson Datastream: 02999 Total assets 08001 Market capitalization 03501 Common equity 03263 Deferred taxes 14,146
Audit Fees variable
Audit Fees Thomson Datastream:
01801 Auditor fees
11,225
Control variables
Assets Thomson Datastream:
02999 Total assets
14,819
R&D Intensity
Research and Development Expenses on Sales.
Thomson Datastream:
08341 Research and development/sales
9,805
Capital Intensity
Total Assets on Sales
Thomson Datastream: 02999 Total assets
01001 Net sales or revenues
14,790
Sales Growth
Sales 1-year growth
Thomson Datastream:
08631 Net sales/revenues – 1 yr annual growth
14,611
Leverage
Long Term Debt on Assets.
Thomson Datastream: 03251 Long term debt 02999 Total assets
14,802
Corporate Governance
E-index.
Data collected at the website of Harvard Law School (Bebchuk et al., 2009a)
10,243
This table presents definitions of variables, data sources and number of firm-year observations. The sample period is from 2000 to 2008.
10
After careful examination of extreme outliers in the audit fees variable, some values were found to have measurement errors. Consulting statements and reports filed to the Securities and Exchange Commission (SEC) of the firms and years in question confirmed this and thus these values were manually corrected1. The same procedure for the rest of the variables showed such errors did not generally exist. All unbounded continuous variables were winsorized at the 1st and 99th percentiles2.
Model
To test the hypothesis, the following equation is estimated, using panel data:
where i subscripts denote firms and t subscripts denote years, δ and θ stand for firm and year fixed effects, respectively, μ represents the error term and the remainder variables are defined in Table 1. The estimation method is LSDV.
The hypothesis is confirmed if there is a significant negative relationship between audit fees and the operating performance measures. Audit fees are projected to arise for client firms with poor financial condition, because they are perceived as riskier in terms of the auditor’s liability exposure; so, higher levels of audit work are expected to be allocated, resulting in increasing fees (e.g., Bell et al., 2008; Simunic and Stein, 1996).
The coefficient sign for assets is expected to be positive, as it is well accepted that gains in efficiency and superior market power driven by the increase of a firm’s dimension prompt firm performance, although the relationship may not be linear (Lee, 2009).
1 Mainly, these measurement errors consisted in values being registered in millions of dollars when in fact they should have been registered in thousands of dollars. Understandably, there was a need to correct such errors or they would affect estimation results.
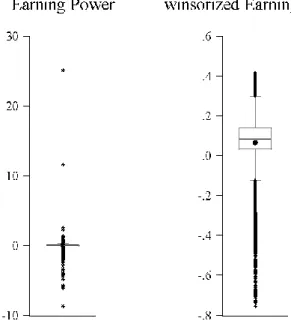
2 Figure 1 in the appendix section shows the effect of this procedure on one variable.
11
According to Brush et al. (2000), an increased sales growth allows the use of full capacity, allocating fixed costs to more revenue, thus increasing firm profitability. In addition, growth is beneficial to firms operating in industries with economies of scale. Therefore, sales growth is also expected to be positively associated with the dependent variables.
At the operational level, the impact of leverage on performance must be only negatively significant for high levels of leverage. Regarding the ROE, the impact of leverage on performance depends on the relative values of the earning power and the cost of debt.
The higher the E-index value a firm holds, the more restricted are its shareholders rights and, consequently, the less “well governed” the firm is; so this variable coefficient sign is expected to be negative (Bebchuk et al., 2009b).
Capital and research and development intensities supposedly increase the market power of a firm (Lee, 2009). Artz et al. (2010) found that research and development spending is positively associated with patents, as well as product announcements, but these have opposite influences on the firm’s profitability. The sign of the coefficient associated with capital intensity is expected to be positive, but mixed results regarding research and development spending cause no predictions to be made as to the direction of this last influence on firm performance.
12 Table 2 – Expected signs for coefficients of equation (3.1) and brief theoretical
explanations
Coefficient Associated variable Expected sign Theoretical explanation
α1 Ln(Audit_Fees) (-)
Clients in a poor economic state are perceived as riskier and as such attributed more audit effort, resulting in higher audit fees. That is to say higher audit fees relate to lower firm performance.
α2 Ln(Assets) (+)
Larger firms obtain gains in efficiency related to economies of scale, as well as an influential position on their industry (market power). These attributes tend to make them more profitable.
α3 R&D_Intensity
While research and development intensity is generally perceived as empowering to the firm within its industry, results have shown mixed conclusions. No predictions are made.
α4 Capital_Intensity (+)
Capital intensity constitutes an entry barrier, increasing a firm’s market power, which translates to higher profitability.
α5 Sales_Growth (+) Increasing sales growth renders full capacity usage, resulting in higher profitability.
α6 Leverage (+/-) It depends on the variable used to measure firm performance.
α7 E_Index (-)
Firms with many restrictions to shareholders’ power (higher values of this index) are less well governed, in the sense that managers are relatively more able to pursue individual interests rather than those of the firms’ owners. As a result, lower performance levels are expected.
13 4. RESULTS
The empirical results are presented in this section. Initially, data are analyzed through descriptive statistics and correlations. As a result, some changes in the initial model are made. Finally, estimation results are reported and analyzed, and conclusions are drawn.
Univariate Results
Analysis of histograms and boxplots for all variables revealed numerous extreme outliers, except for the corporate governance measure E-index. As previously stated, some of the audit fees extreme outliers were measurement errors and for that reason they were cautiously corrected; all other variables did not prove to register such errors. Winsorization at the 1st and 99th percentiles for each variable annual distribution (except the E-index) decreased the presence of extreme outliers, thus preventing possible biased results. In addition, the assets and audit fees variables are logarithmized, in order to linearize their effect on firm performance3.
Descriptive statistics of variables included in equation (3.1) are presented in Table 3, and Table 4 reports correlations among the same variables.
The three performance measures, EP, ROA and ROE, have mean values of approximately 6.6%, 2.0% and 5.7%, respectively. Mean firm value, represented by Tobin’s Q, is approximately 2.1. Average firm size (measured by total assets) is $4,154,097,000 and average fees paid to audit firms are $3,293,000.
The examination of variables correlations (Table 4) allows to conclude that the three performance measures are, unsurprisingly, highly correlated. The test variable, Ln(Audit Fees) is, for the sample used, positively correlated with EP, ROA and ROE and negatively correlated with Tobin’s Q. Spearman correlations for the corporate governance measure also show a negative relation with Tobin’s Q. Ln(Assets) and Sales Growth are positively correlated with EP, ROA and ROE, while R&D Intensity, Capital Intensity and Leverage are negatively correlated with those variables.
14 Table 3 – Descriptive Statistics of equation (3.1) variables
Mean Median Maximum Minimum Std. Dev. Observations
EP 0.066 0.085 0.417 -0.752 0.158 14,260
ROA 0.020 0.047 0.304 -0.862 0.155 14,804
ROE 0.057 0.110 1.012 -1.842 0.344 14,330
Tobin’s Q 2.104 1.606 9.192 0.672 1.497 14,146 Audit Fees ($mil.) 3.293 1.600 32.100 0.140 4.995 11,225 Ln(Audit Fees) 7.437 7.378 10.377 4.942 1.118 11,225 Assets ($mil.) 4,154.097 987.676 56,032.050 35.766 8,874.150 14,819 Ln(Assets) 13.949 13.803 17.841 10.485 1.579 14,819 R&D Intensity 0.111 0.029 2.210 0.000 0.278 9,805 Capital Intensity 1.544 1.067 13.814 0.248 1.755 14,790 Sales Growth 0.149 0.094 2.010 -0.537 0.328 14,611 Leverage 0.192 0.166 0.875 0.000 0.186 14,802 E-Index 2.724 3.000 6.000 0.000 1.335 10,243
This table reports descriptive statistics of variables included in equation (3.1). Variable definitions can be found in Table 1. The sample covers the period from 2000 to 2008.
Table 4 – Correlations of equation (3.1) variables
(1) (2) (3) (4) (5) (6) (7) (8) (9) (10) (11) (1) EP 0.947*** 0.796*** 0.176*** 0.106*** 0.191*** -0.453*** -0.333*** 0.086*** -0.064*** 0.039*** (2) ROA 0.930*** 0.843*** 0.126*** 0.114*** 0.202*** -0.435*** -0.302*** 0.077*** -0.106*** 0.054*** (3) ROE 0.876*** 0.907*** 0.130*** 0.119*** 0.199*** -0.384*** -0.259*** 0.069*** -0.083*** 0.051*** (4) Tobin’s Q 0.440*** 0.458*** 0.377*** -0.161*** -0.235*** 0.194*** 0.037*** 0.242*** -0.198*** -0.145*** (5) Ln(Audit Fees) 0.031*** 0.025*** 0.146*** -0.127*** 0.776*** -0.223*** -0.115*** -0.055*** 0.173*** 0.080*** (6) Ln(Assets) 0.090*** 0.068*** 0.215*** -0.217*** 0.754*** -0.233*** 0.008000 -0.053*** 0.266*** 0.072*** (7) R&D Intensity -0.299*** -0.225*** -0.299*** 0.285*** -0.083*** -0.270*** 0.741*** 0.109*** -0.007000 -0.103*** (8) Capital Intensity -0.293*** -0.261*** -0.244*** -0.045*** 0.034*** 0.144*** 0.545*** 0.149*** 0.110*** -0.070*** (9) Sales Growth 0.276*** 0.282*** 0.276*** 0.289*** -0.027*** -0.020**0 0.033*** 0.065*** -0.038*** -0.026*** (10) Leverage -0.113*** -0.217*** -0.013000 -0.319*** 0.251*** 0.388*** -0.288*** 0.138*** -0.072*** 0.089*** (11) E-Index 0.005000 -0.001000 0.037*** -0.144*** 0.101*** 0.092*** -0.120*** -0.049*** -0.022**0 0.124***
This table reports Pearson and Spearman correlations above and below the diagonal, respectively, among variables included in equation (3.1), using pairwise samples covering the period from 2000 to 2008. ** and *** denote, respectively, coefficients’ significance at the 5% and 1% levels. Consult Table 1 for variable definitions.
15
A particular relevant correlation value is that of Ln(Audit Fees) with Ln(Assets): a significant Pearson correlation of 0,776. The audit pricing literature supports this finding, as size is often a critical explanatory variable in audit fee models (Hay et al., 2006). It is possible, though, that including the test variable in the model thus represented (Ln(Audit Fees)) might yield biased results, since it is probable that it contains effects of size, already taken into account with Ln(Assets). Consequently, a first modification to equation (3.1) was made. The test variable was introduced as the ratio of audit fees on assets.
Additionally, panel unit root tests on all variables rejected the hypothesis of non-stationary processes, with the exception of the E-index variable: the Im, Pesaran and Shin and the Fisher ADF and PP tests do not reject the null hypothesis of a unit root for this variable. Transforming this variable (for example by computing the first difference for all observations) undermines the significance this index has. So, a different approach was used. Instead, two dummy variables were constructed, intended to represent good and bad governance: the former assumes the value of 1 for firms with an E-index score of 0, 1 or 2; the latter assumes the value of 1 for firms with an E-index score of 4, 5 or 6. Equation (3.1) is, hence, modified:
where i subscripts denote firms and t subscripts denote years, δ and θ stand for firm and year fixed effects, respectively, μ represents the error term, Audit_Fees/Assets, Good_Governance and Bad_Governance have the previously mentioned meaning and the remainder variables are defined in Table 1. It is important to point out that all coefficients’ signs maintain the predicted direction, except for the one associated with Good_Governance, that is expected to be positively related to the dependent variables.
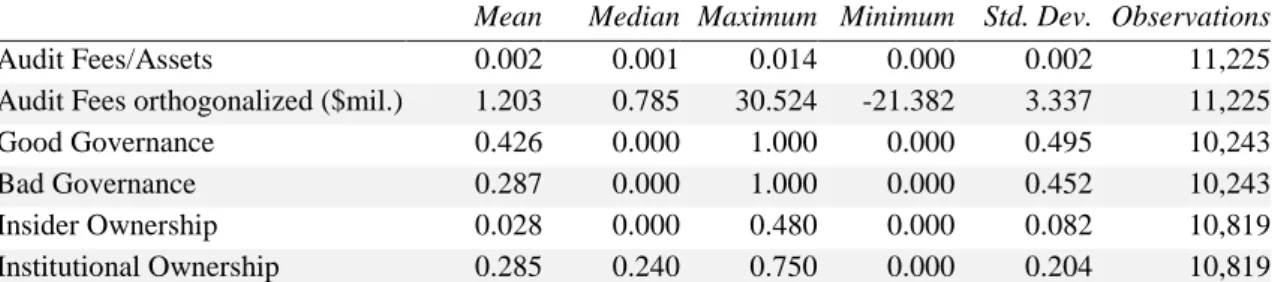
Descriptive statistics of the added variables can be found in Table 8, in the appendix section.
16 Multivariate Results
Equation (4.1) was regressed on each of the firm performance and value measures chosen for this research. LSDV estimation outputs are presented in Table 5, below.
Table 5 – Equation (4.1) estimation results
Eq. (4.1) on Eq. (4.1) on Eq. (4.1) on Eq. (4.1) on Independent variables Expected
sign EP ROA ROE Tobin’s Q
Audit Fees/Assets (-) -7.702*** -7.162*** -17.363*** -16.478*00 1.382000 1.371000 3.282000 9.936000 Ln(Assets) (+) -0.005000 -0.004000 -0.000000 -0.671*** 0.006000 0.006000 0.015000 0.047000 R&D Intensity -0.340*** -0.367*** -0.464*** 0.521*** 0.024000 0.024000 0.060000 0.176000 Capital Intensity (+) 0.013*** 0.022*** 0.015*00 -0.073*** 0.003000 0.003000 0.008000 0.024000 Sales Growth (+) 0.086*** 0.084*** 0.159*** 0.448*** 0.007000 0.007000 0.016000 0.049000 Leverage (+/-) -0.118*** -0.133*** -0.335*** -0.203**0 0.014000 0.014000 0.039000 0.101000 Good Governance (+) 0.002000 -0.002000 0.008000 0.009000 0.005000 0.005000 0.013000 0.039000 Bad Governance (-) -0.005000 0.002000 -0.004000 0.032000 0.005000 0.006000 0.013000 0.040000 Intercept 0.178**0 0.114000 0.169000 11.703*** 0.090000 0.092000 0.219000 0.663000 R-squared 0.721000 0.688000 0.658000 0.797000 Adjusted R-squared 0.638000 0.597000 0.557000 0.736000 F-statistic 8.702*** 7.559*** 6.533*** 12.941*** Total panel (unbalanced) observations 5263.000000 5437.000000 5334.000000 5199.000000 Firm effects - F test 4.828*** 3.929*** 4.193*** 10.811*** Firm effects - Chi-square test 4643.497*** 4115.235*** 4246.304*** 7515.062*** Year effects - F test 13.159*** 17.508*** 8.137*** 83.358*** Year effects - Chi-square test 134.853*** 178.023*** 83.601*** 804.258*** Firm and Year effects - F test 5.019*** 4.187*** 4.321*** 11.272*** Firm and Year effects - Chi-square test 4785.644*** 4321.159*** 4354.592*** 7708.534*** This table reports LSDV estimation results of equation (4.1), as well redundant fixed effects tests. *, ** and *** denote coefficients significance at 10%, 5% and 1% levels, respectively. Values below coefficients are corresponding standard-deviations. The panel sample covers the period from 2000 to 2008. Consult Table 1 for variable definitions.
17
Results are consistent with what was predicted, with some exceptions. Sales growth is statistically significant in all estimations and its coefficient has the expected sign. Leverage is also statistically significant and has a negative impact on firm operating performance, as well as on firm financial performance and firm value. Research and development intensity seems to negatively influence firm performance, but positively influence firm value; the opposite happens for capital intensity. Firm size is significant only when determining firm value and, even then, it has a negative influence. This result is contrary to what was expected. The corporate governance measures are not statistically significant in this model determining EP, ROA, ROE or Tobin’s Q. Even so, the most important result is that of audit fees on assets: this variable is significantly and negatively related with the performance and value variables. Adjusted R2 varies, for the performance estimations, between 56% and 64%, approximately.
Cross-section and period fixed effects were included in all estimations, to account for individual firm and year effects. Tests performed in all of them rejected the hypothesis of redundant firm and/or year fixed effects.
As an additional test, the dummy variables representative of good and bad governance were substituted by a single measure: insider ownership or institutional ownership. Connelly et al. (2010) provide a review of the role of owners in governance. When insiders own equity they tend to take actions more in line with the interests of shareholders. This evidence is more pronounced for non-executive employees. On the other hand, there is empirical evidence that institutional ownership is positively associated with governance quality (Chung and Zhang, 2011). These two variables are tested alternatively.
With the intent of eliminating completely the effect of firm dimension on the amount of fees paid to its auditor, another change was made. Following Bhattacharya et al. (2012), an orthogonalized audit fees variable was created by regressing audit fees on assets. The resulting residuals represent the part of audit fees unexplained by firm size.
18
The following equations are, then, used:
where i subscripts denote firms and t subscripts denote years, δ and θ stand for firm and year fixed effects, respectively, μ represents the error term, Audit_Fees_orth, Insider_Ownership and Institutional_Ownership have the above mentioned meaning and the remainder variables are defined in Table 14. The orthogonalized audit fees variable maintains the predicted coefficient negative sign, and insider or institutional ownership are expected to be positively related to firm performance and value (Connelly et al., 2010; Chung and Zhang, 2011).
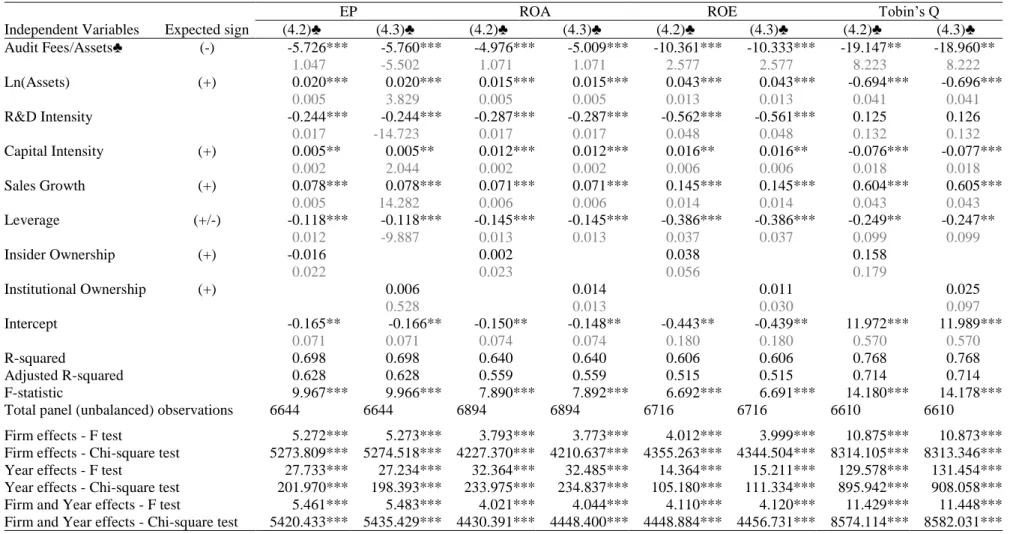
Descriptive statistics of variables included at this stage can be consulted in Table 8 in the appendix. Also in that section, Table 9 shows the results of estimating equations (4.2) and (4.3) but using the previous audit fees representative variable (audit fees on assets), so the effects of changing the corporate governance measure are singularized.
Table 6 presents the estimation results of equations (4.2) and (4.3). Since Thomson Datastream did not return data on insider ownership and institutional ownership for 2000 and 2001, these results are applicable for the sample period from 2002 to 2008.
The changes performed in the model’s equation brought somewhat different results. Although corporate governance remains statistically insignificant, size has now a significant and positive influence on firm performance. Table 9 in the appendix shows
4 Insider ownership and institutional ownership are, respectively, Thomson Datastream’s Free Float Employee Held Shares – datatype (NOSHEM) and Investment company held shares – datatype (NOSHIC).
(4.2)
19
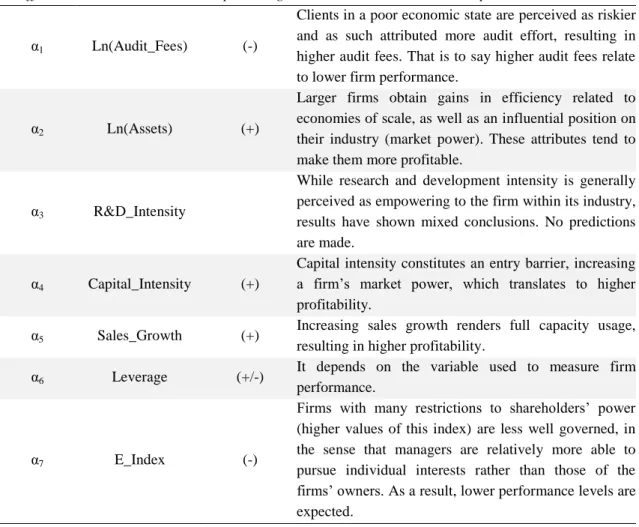
this change in the significant of Ln(Assets) may have happened with the first modification that was made to the model – the substitution of insider or institutional ownership for good and bad governance. Sales one-year growth maintains its positive and statistically significant impact on firm performance. Research and development intensity has a negative impact on performance, while capital intensity affects performance positively. These results do not allow to confirm the notion that the former firm characteristic constitutes an entry barrier and brings market power. Leverage maintains a significantly negative association with firm performance and value.
The test variable, (orthogonalized) audit fees, is statistically significant and bares negative coefficients’ signs. However, the absolute values of coefficients are relatively small, which may indicate that audit fees unexplained by firm size are less associated with firm performance. It is worth noting, nevertheless, the difference in variables’ units: while the test variable is introduced in thousands of dollars, each performance dependent variable is a ratio, varying from -1.842 to 1.012 (see Tables 3 and 8). So, caution is needed when interpreting these results.
In addition, an untabulated analysis of the connection of past audit fees with current firm performance did not return significant results. This contradicts the notion that audit fees may reflect not only the current year but also the next year economic condition of that client.
Overall, reported results indicate that there is no reason to discard this study’s hypothesis of operating performance (measured by EP or ROA) being associated with current year fees paid to audit firms. That same association happens, in addition, for financial performance (measured by ROE). Furthermore, the relationship is negative: increases (decreases) in firm performance are connected with decreases (increases) in audit fees.
20 Table 6 – Equations (4.2) and (4.3) estimation results
EP ROA ROE Tobin’s Q
Independent variables Expected sign (4.2) (4.3) (4.2) (4.3) (4.2) (4.3) (4.2) (4.3) Audit Fees orthogonalized (-) -1.62E-06**0 -1.63E-06**0 -2.30E-06*** -2.31E-06*** -3.85E-06*0 -3.84E-06*0 -1.04E-05*00 -1.04E-05000
7.76E-07000 7.76E-07000 8.22E-07000 8.21E-07000 2.00E-06000 2.00E-06000 6.30E-06000 6.30E-06000 Ln(Assets) (+) 0.029*** 0.029*** 0.023*** 0.023*** 0.060*** 0.059*** -0.664*** -0.665*** 0.005000 0.005000 0.005000 0.005000 0.012000 0.012000 0.039000 0.039000 R&D Intensity -0.242*** -0.242*** -0.285*** -0.285*** -0.560*** -0.560*** 0.130000 0.131000 0.017000 0.017000 0.017000 0.017000 0.048000 0.048000 0.132000 0.132000 Capital Intensity (+) 0.005**0 0.005**0 0.012*** 0.012*** 0.017*** 0.017*** -0.075*** -0.075*** 0.002000 0.002000 0.002000 0.002000 0.006000 0.006000 0.018000 0.018000 Sales Growth (+) 0.079*** 0.079*** 0.071*** 0.072*** 0.146*** 0.146*** 0.606*** 0.606*** 0.005000 0.005000 0.006000 0.006000 0.014000 0.014000 0.043000 0.043000 Leverage (+/-) -0.121*** -0.121*** -0.148*** -0.148*** -0.392*** -0.392*** -0.260*** -0.258*** 0.012000 0.012000 0.013000 0.013000 0.037000 0.037000 0.099000 0.099000 Insider Ownership (+) -0.019000 -0.000000 0.032000 0.147000 0.022000 0.023000 0.056000 0.179000 Institutional Ownership (+) 0.005000 0.012000 0.008000 0.019000 0.012000 0.013000 0.030000 0.097000 Intercept -0.305*** -0.308*** -0.271*** -0.271*** -0.695*** -0.691*** 11.515*** 11.535*** 0.066000 0.066000 0.069000 0.069000 0.167000 0.167000 0.530000 0.530000 R-squared 0.697000 0.697000 0.639000 0.639000 0.605000 0.605000 0.768000 0.768000 Adjusted R-squared 0.626000 0.626000 0.558000 0.558000 0.514000 0.514000 0.714000 0.714000 F-statistic 9.899*** 9.898*** 7.860*** 7.862*** 6.667*** 6.666*** 14.171*** 14.169*** Total panel (unbalanced) observations 6644. 000000 6644.000000 6894.000000 6894.000000 6716. 000000 6716.000000 6610.000000 6610.000000 Firm effects - F test 5.582*** 5.563*** 4.078*** 4.032*** 4.169*** 4.144*** 10.967*** 10.952*** Firm effects - Chi-square test 5483.961*** 5471.308*** 4460.862*** 4423.158*** 4479.065*** 4459.672*** 8353.899*** 8347.570*** Year effects - F test 25.319*** 25.036*** 30.330*** 30.530*** 13.404*** 14.155*** 129.061*** 130.976*** Year effects - Chi-square test 184.634*** 182.595*** 219.503*** 220.928*** 98.204*** 103.661*** 892.598*** 904.974*** Firm and Year effects - F test 5.703*** 5.731*** 4.231*** 4.253*** 4.231*** 4.239*** 11.516*** 11.533*** Firm and Year effects - Chi-square test 5582.888*** 5601.240*** 4598.407*** 4616.350*** 4543.600*** 4550.305*** 8610.695*** 8617.428*** This table reports LSDV estimation results of equations (4.2) and (4.3), as well redundant fixed effects tests. *, ** and *** denote coefficients significance at 10%, 5% and 1% levels, respectively. Values below coefficients are corresponding standard-deviations. The panel sample covers the period from 2002 to 2008.
21 5. CONCLUDING REMARKS
There are multiple studies investigating firm performance, in particular studies on which firm characteristics drive performance. On the other hand, research on the pricing of audit fees has empirically proved that the financial condition of a client is a critical factor, in the sense that riskier clients demand more thorough audit procedures. Auditors have a potentially privileged position in assessing client firms’ economic condition, and so, required audit fees may be a reasonable pointer of the direction a specific firm’s performance is taking. This study’s purpose is to see whether this statement holds, from the firm performance perspective.
Using a fixed effects model and a sample of U.S. publicly traded, non-financial firms covering the period from 2000 to 2008 (approximately 6000 firm-year observations) and the LSDV estimator, fixed effects regressions on firm operating performance were conducted. The model’s equations included standard control variables, such as size, leverage, sales growth and research and development intensity. In addition, different measures of corporate governance were (alternatively) introduced. The model allowed for individual firm and year effects. The variable subject to testing – audit fees – was firstly considered as a ratio (on assets), and later it was orthogonalized, in an attempt to mitigate the effects of firm dimension on the explanatory power of audit fees.
Estimations’ results provide empirical evidence on the relationship between firm performance and audit fees. Specifically, increases (decreases) in operating performance are connected with decreases (increases) in audit fees. This relationship also applies to financial performance. Therefore, the advanced hypothesis of this study is not rejected.
This research has some limitations. First of all, although the sampling process resulted in at least 9000 firm-year observations, it might have left out relevant firms, that either were not identified on Thomson Datastream or were not present on the E-Index file to begin with. Also, the data restrictions encountered when considering a corporate governance measure may explain the weak results on this variable. Particularly, the use of a different estimation method to account for the endogeneity of corporate governance and performance could have helped to understand these results.
22
On account of this limitation, it was also not possible to investigate whether corporate governance and audit fees constitute complementary or substitute controls. Another limitation lies with the possible misspecification of the study’s model. Individual firm and year fixed effects play an important role on the global significance of results.
To better understand the association of audit fees to firm performance, further research on this relationship is needed. For example, disaggregating audit fees on fees paid for audit services and fees paid for consultancy; analyzing the unexpected change in audit fees; and/or examining more thoroughly the relationship with past audit fees.
Nevertheless, this investigation provides initial grounds on the performance perspective of the stated association.
23 APPENDIX
Figure 1 – Boxplots of the variable Earning Power before and after winsorization at the
24 Figure 2 – Histograms of the variable Assets (winsorized) before and after
25 Table 7 – Industry profile of sample firms
2000 2001 2002 2003 2004 2005 2006 2007 2008
Number of firms (Total = 14,826) 1,798 1,769 1,769 1,742 1,702 1,638 1,563 1,458 1,387 Agriculture 0.3% 0.3% 0.3% 0.3% 0.3% 0.3% 0.3% 0.3% 0.2% Food Products 1.9% 1.9% 1.8% 1.8% 1.9% 2.0% 2.1% 2.3% 2.4% Candy & Soda 0.5% 0.5% 0.5% 0.5% 0.5% 0.5% 0.5% 0.5% 0.5% Beer & Liquor 0.2% 0.2% 0.2% 0.2% 0.2% 0.2% 0.3% 0.3% 0.2% Tobacco Products 0.3% 0.3% 0.3% 0.3% 0.3% 0.2% 0.3% 0.3% 0.2% Recreation 0.6% 0.6% 0.6% 0.6% 0.5% 0.5% 0.5% 0.5% 0.6% Entertainment 0.7% 0.7% 0.7% 0.7% 0.8% 0.6% 0.6% 0.5% 0.5% Printing and Publishing 0.9% 0.9% 0.9% 0.9% 0.8% 0.9% 0.8% 0.7% 0.6% Consumer Goods 2.3% 2.3% 2.2% 2.1% 2.1% 2.1% 2.0% 2.1% 2.1% Apparel 1.1% 1.1% 1.1% 1.3% 1.2% 1.2% 1.3% 1.2% 1.2% Healthcare 2.3% 2.3% 2.3% 2.3% 2.3% 2.2% 2.2% 2.1% 2.0% Medical Equipment 3.4% 3.4% 3.5% 3.6% 3.8% 3.8% 3.8% 3.5% 3.5% Pharmaceutical Products 5.3% 5.3% 5.2% 5.0% 5.1% 4.9% 4.8% 4.8% 4.5% Chemicals 2.4% 2.4% 2.4% 2.4% 2.5% 2.5% 2.6% 2.6% 2.7% Rubber and Plastic Products 0.5% 0.5% 0.5% 0.5% 0.5% 0.5% 0.5% 0.5% 0.6% Textiles 0.5% 0.5% 0.5% 0.4% 0.4% 0.3% 0.3% 0.3% 0.3% Construction Materials 2.3% 2.3% 2.3% 2.2% 2.1% 2.1% 2.1% 2.1% 2.2% Construction 1.4% 1.4% 1.5% 1.5% 1.6% 1.5% 1.7% 1.7% 1.8% Steel Works Etc 2.0% 2.0% 2.0% 2.0% 1.9% 1.9% 1.8% 1.6% 1.7% Fabricated Products 0.3% 0.3% 0.3% 0.3% 0.3% 0.3% 0.3% 0.3% 0.3% Machinery 3.8% 3.8% 3.8% 3.8% 3.9% 3.8% 4.0% 4.1% 4.2% Electrical Equipment 0.9% 0.9% 0.8% 0.9% 0.9% 0.9% 0.8% 0.8% 0.9% Automobiles and Trucks 2.0% 2.0% 1.9% 2.0% 2.0% 2.1% 2.1% 2.3% 2.3% Aircraft 0.6% 0.6% 0.6% 0.6% 0.6% 0.6% 0.6% 0.7% 0.7% Shipbuilding, Railroad Equipment 0.1% 0.1% 0.1% 0.1% 0.1% 0.1% 0.1% 0.1% 0.1% Defense 0.3% 0.3% 0.3% 0.3% 0.3% 0.2% 0.3% 0.3% 0.3% Precious Metals 0.1% 0.1% 0.1% 0.1% 0.1% 0.1% 0.1% 0.1% 0.1% Non-Metallic & Industrial Metal Mining 0.3% 0.3% 0.3% 0.3% 0.4% 0.4% 0.4% 0.4% 0.4% Coal 0.3% 0.3% 0.3% 0.3% 0.3% 0.3% 0.3% 0.4% 0.4% Petroleum and Natural Gas 4.8% 4.8% 4.9% 4.9% 4.6% 4.7% 4.7% 4.7% 4.8% Utilities 5.0% 5.0% 5.0% 5.1% 5.2% 5.3% 5.5% 5.3% 5.4% Communication 1.9% 1.9% 2.0% 2.1% 2.0% 1.9% 1.7% 1.7% 1.6% Personal Services 1.4% 1.4% 1.4% 1.3% 1.3% 1.3% 1.4% 1.3% 1.3% Business Services 8.0% 8.0% 8.0% 8.0% 7.8% 8.1% 8.0% 7.8% 7.9% Computers 2.1% 2.1% 2.1% 2.1% 2.1% 2.1% 1.9% 2.1% 2.0% Computer Software 9.4% 9.4% 9.3% 9.1% 8.9% 8.5% 7.9% 7.8% 7.6% Electronic Equipment 8.5% 8.5% 8.4% 8.4% 8.5% 8.5% 8.6% 8.7% 8.8% Measuring and Control Equipment 2.8% 2.8% 2.8% 2.9% 2.7% 2.7% 2.8% 2.8% 2.7% Business Supplies 1.4% 1.4% 1.4% 1.3% 1.5% 1.5% 1.5% 1.6% 1.6% Shipping Containers 0.4% 0.4% 0.4% 0.4% 0.4% 0.4% 0.4% 0.5% 0.5% Transportation 2.6% 2.6% 2.7% 2.8% 2.9% 2.9% 3.0% 2.9% 3.0% Wholesale 3.8% 3.8% 3.7% 3.7% 3.8% 3.8% 3.7% 3.8% 3.7% Retail 7.5% 7.5% 7.6% 7.9% 7.9% 7.9% 8.1% 8.4% 8.4% Restaurants, Hotels, Motels 2.7% 2.7% 2.7% 2.7% 2.8% 2.8% 2.9% 2.7% 2.7% Almost Nothing 0.3% 0.3% 0.3% 0.3% 0.3% 0.3% 0.3% 0.3% 0.3% 100% 100% 100% 100% 100% 100% 100% 100% 100%
26 Table 8 – Descriptive Statistics of variables subsequently included in the model
Mean Median Maximum Minimum Std. Dev. Observations
Audit Fees/Assets 0.002 0.001 0.014 0.000 0.002 11,225 Audit Fees orthogonalized ($mil.) 1.203 0.785 30.524 -21.382 3.337 11,225 Good Governance 0.426 0.000 1.000 0.000 0.495 10,243 Bad Governance 0.287 0.000 1.000 0.000 0.452 10,243 Insider Ownership 0.028 0.000 0.480 0.000 0.082 10,819 Institutional Ownership 0.285 0.240 0.750 0.000 0.204 10,819 This table reports descriptive statistics of variables subsequently used (not present in Table 3). The sample covers the period from 2000 to 2008, but data on insider ownership and institutional ownership is not available for the first two years.
27 Table 9 – Equations (4.2) and (4.3) with previous audit fees variable estimation results
EP ROA ROE Tobin’s Q
Independent Variables Expected sign (4.2)♣ (4.3)♣ (4.2)♣ (4.3)♣ (4.2)♣ (4.3)♣ (4.2)♣ (4.3)♣ Audit Fees/Assets♣ (-) -5.726*** -5.760*** -4.976*** -5.009*** -10.361*** -10.333*** -19.147**0 -18.960**0 1.047000 -5.502000 1.071000 1.071000 2.577000 2.577000 8.223000 8.222000 Ln(Assets) (+) 0.020*** 0.020*** 0.015*** 0.015*** 0.043*** 0.043*** -0.694*** -0.696*** 0.005000 3.829000 0.005000 0.005000 0.013000 0.013000 0.041000 0.041000 R&D Intensity -0.244*** -0.244*** -0.287*** -0.287*** -0.562*** -0.561*** 0.125000 0.126000 0.017000 -14.723000 0.017000 0.017000 0.048000 0.048000 0.132000 0.132000 Capital Intensity (+) 0.005**0 0.005**0 0.012*** 0.012*** 0.016**0 0.016**0 -0.076*** -0.077*** 0.002000 2.044000 0.002000 0.002000 0.006000 0.006000 0.018000 0.018000 Sales Growth (+) 0.078*** 0.078*** 0.071*** 0.071*** 0.145*** 0.145*** 0.604*** 0.605*** 0.005000 14.282000 0.006000 0.006000 0.014000 0.014000 0.043000 0.043000 Leverage (+/-) -0.118*** -0.118*** -0.145*** -0.145*** -0.386*** -0.386*** -0.249**0 -0.247**0 0.012000 -9.887000 0.013000 0.013000 0.037000 0.037000 0.099000 0.099000 Insider Ownership (+) -0.016000 0.002000 0.038000 0.158000 0.022000 0.023000 0.056000 0.179000 Institutional Ownership (+) 0.006000 0.014000 0.011000 0.025000 0.528000 0.013000 0.030000 0.097000 Intercept -0.165**0 -0.166** -0.150**0 -0.148**0 -0.443**0 -0.439**0 11.972*** 11.989*** 0.071000 0.071000 0.074000 0.074000 0.180000 0.180000 0.570000 0.570000 R-squared 0.698000 0.698000 0.640000 0.640000 0.606000 0.606000 0.768000 0.768000 Adjusted R-squared 0.628000 0.628000 0.559000 0.559000 0.515000 0.515000 0.714000 0.714000 F-statistic 9.967*** 9.966*** 7.890*** 7.892*** 6.692*** 6.691*** 14.180*** 14.178*** Total panel (unbalanced) observations 6644.000000 6644.000000 6894.000000 6894.000000 6716.000000 6716.000000 6610.000000 6610.000000 Firm effects - F test 5.272*** 5.273*** 3.793*** 3.773*** 4.012*** 3.999*** 10.875*** 10.873*** Firm effects - Chi-square test 5273.809*** 5274.518*** 4227.370*** 4210.637*** 4355.263*** 4344.504*** 8314.105*** 8313.346*** Year effects - F test 27.733*** 27.234*** 32.364*** 32.485*** 14.364*** 15.211*** 129.578*** 131.454*** Year effects - Chi-square test 201.970*** 198.393*** 233.975*** 234.837*** 105.180*** 111.334*** 895.942*** 908.058*** Firm and Year effects - F test 5.461*** 5.483*** 4.021*** 4.044*** 4.110*** 4.120*** 11.429*** 11.448*** Firm and Year effects - Chi-square test 5420.433*** 5435.429*** 4430.391*** 4448.400*** 4448.884*** 4456.731*** 8574.114*** 8582.031*** This table reports LSDV estimation results of equations (4.2) and (4.3) with the former audit fees variable (♣), as well redundant fixed effects tests. *, ** and *** denote coefficients significance at 10%, 5% and 1% levels, respectively. Values below coefficients are corresponding standard-deviations. The panel sample covers the period from 2002 to 2008.
28 REFERENCES
Artz, K. W., P. M. Norman, D. E. Hartfield and L. B. Cardinal (2010), "A Longitudinal Study of the Impact of R&D, Patents, and Product Innovation on Firm Performance", Journal of Product Innovation Management, Vol. 27, No. 5, pp. 725-740.
Bebchuk, L., A. Cohen and A. Ferrell (2009a), "Data on the Entrenchment Index
1990-2008" [computer file], Harvard Law School,
http://www.law.harvard.edu/programs/corp_gov/m-a_data.shtml, accessed on
march 2011.
Bebchuk, L., A. Cohen and A. Ferrell (2009b), "What Matters in Corporate Governance?", The Review of Financial Studies, Vol. 22, No. 2, pp. 783-827. Bell, T. B., R. Doogar and I. Solomon (2008), "Audit Labor Usage and Fees under
Business Risk Auditing", Journal of Accounting Research, Vol. 46, No. 4, pp. 729-760.
Bhagat, S. and B. Bolton (2008), "Corporate governance and firm performance", Journal of Corporate Finance, Vol. 14, No. 3, pp. 257-273.
Bhattacharya, N., H. Desai and K. Venkataraman (2012), "Does Earnings Quality Affect Information Asymmetry? Evidence from Trading Costs", Contemporary Accounting Review, (forthcoming).
Brush, T. H., P. Bromiley and M. Hendrickx (2000), "The free cash flow hypothesis for sales growth and firm performance", Strategic Management Journal, Vol. 21, No. 4, pp. 455-472.
Choi, J.-H., C. F. Kim, J.-B. Kim and Y. Zang (2010), "Audit Office Size, Audit Quality, and Audit Pricing", Auditing: A Journal of Practice & Theory, Vol. 29, No. 1, pp. 73-97.
Choi, J.-H., J.-B. Kim, X. Liu and D. A. Simunic (2008), "Audit Pricing, Legal Liability Regimes, and Big 4 Premiums: Theory and Cross-country Evidence", Contemporary Accounting Research, Vol. 25, No. 1, pp. 55-99.
Chung, K. H. and H. Zhang (2011), "Corporate Governance and Institutional Ownership", Journal of Financial and Quantitative Analysis, Vol. 46, No. 1, pp. 247-273.
Connelly, B. L., R. E. Hoskisson, L. Tihanyi and S. T. Certo (2010), "Ownership as a Form of Corporate Governance", Journal of Management Studies, Vol. 47, No. 8, pp. 1561-1589.
29
Gompers, P., J. Ishii and A. Metrick (2003), "Corporate Governance and Equity Prices", The Quarterly Journal of Economics, Vol. 118, No. 1, pp. 107-155.
Hay, D. (2012), "Further Evidence from meta-analysis of audit fee research", The University of Auckland Business School.
Hay, D., W. R. Knechel and H. Ling (2008), "Evidence on the Impact of Internal Control and Corporate Governance on Audit Fees", International Journal of Auditing, Vol. 12, No. 1, pp. 9-24.
Hay, D. C., W. R. Knechel and N. Wong (2006), "Audit Fees: A Meta-analysis of the Effect of Supply and Demand Attributes", Contemporary Accounting Research, Vol. 23, No. 1, pp. 141-191.
Jones, F. L. and K. Raghunandan (1998), "Client risk and recent changes in the market for audit services", Journal of Accounting and Public Policy, Vol. 17, No. 2, pp. 169-181.
Lee, J. (2009), "Does Size Matter in Firm Performance? Evidence from US Public Firms", International Journal of the Economics of Business, Vol. 16, No. 2, pp. 189-203.
Pratt, J. and J. D. Stice (1994), "The Effects of Client Characteristics on Auditor Litigation Risk Judgements, Required Audit Evidence, and Recommended Audit Fees", The Accounting Review, Vol. 69, No. 4, pp. 639-656.
Sami, H., J. Wang and H. Zhou (2011), "Corporate governance and operating performance of Chinese listed firms", Journal of International Accounting, Auditing and Taxation, Vol. 20, No. pp. 106-114.
Securities and Exchange Comission (SEC) (2000), "Final Rule: Review of the
Commission's Auditor Independence Requirements",
http://www.sec.gov/rules/final/33-7919.htm, accessed on september 2012. Simunic, D. A. (1980), "The Pricing of Audit Services: Theory and Evidence", Journal
of Accounting Research, Vol. 18, No. 1, pp. 161-190.
Simunic, D. A. and M. T. Stein (1996), "The Impact of Litigation Risk on Audit Pricing: A Review of the Economics and the Evidence", Auditing: A Journal of Practice & Theory, Vol. 15, No. 2, pp. 119-134.
Stanley, J. D. (2011), "Is the Audit Fee Disclosure a Leading Indicator of Clients' Business Risk?", Auditing: A Journal of Practice & Theory, Vol. 30, No. 3, pp. 157-179.