Tiago Emanuel do Espírito Santo Bernardo
Bachelor of Science in Chemical and Biochemical Engineering
Anaerobic Nitrogen Removal: The
start-up of an Anammox Reactor with
pre-treated Real wastewater from the
Anaerobic Digestion of municipal solid
waste.
Dissertation to obtain the degree of Masters in Chemical and Biochemical Engineering
Supervisor: Alessandra Carucci, Full professor,
Università di Cagliari
Co-supervisor: Stefano Milia, Researcher, Institute of
Environmental Geology and Geoengineering, National
Research Council (IGAG-CNR)
Acknowlegments
This research work was developed at the Department of Civil-Environment Engineering and Architecture (DICAAR) at University of Cagliari from March 2017 until July 2017.
First I would like to thank the Department and specially Professor Alessandra Carucci and Stefano Milia for the help and support during my stay in Cagliari.
To Giaime Tocco, my supervisor, who was the most important person during my thesis work, a special thanks for all the help, patience and comprehension. For all the knowledge shared, I truly learned a lot.
To the wonderful people I met during my stay, specially Abdel, Nasrat, Mohammed, Adrian, Anna and Gabi, thank you for the friendship, the wise words and the amazing moments that we shared during this 5 months, you will be forever in my heart.
A special thanks for Alessandro Secci, my flatmate, thank so much for everything, you are one of those you made this possible.
I also appreciate the opportunity given by professor Maria Ascensão Reis to develop my thesis in such interesting university and group.
I big thank you to my family, specially my mother, who allow me to go on this amazing experience. Thanks for the support and care.
To my friends in Portugal, a special thanks for João Mendes, João Carmo, Guilherme, Margarida, Francisco, Jessica, Diogo, Rafael and Gonçalo for this amazing 5 years, I have to share this success with you, because without you I probably wouldn’t do it. A friendship for life.
My oldest friends, Miguel, Ricardo Gomes, Ricardo Carvalho and Tiago Domingos, thank you for staying with me even when we took different paths.
Abstract
In this study, wastewater produced by the Anaerobic Digestion of municipal solid waste
and pre-treated by partial-nitrification was fed to a granular Anammox reactor. A
conservative exponential Law was used to slowly replace the synthetic wastewater for
the pre-treated wastewater, starting at 10%.
This strategy was adopted in order to avoid stressful conditions to bacteria, which
could thus acclimate to the reactor conditions.
The experiment was divided in two phases, the first one with increasing real
wastewater ratio and a second phase totally fed with real wastewater.
The influent is characterized by a nitrogen loading rate of 1.5gNL-1d-1, with a
NO2-N/NH4-N ratio of 1.20.
Removal efficiencies were stable during all experiment, around 90%.
The Anammox activity also increased during the experimentation. The Volatile
suspended solids grown during phase 1 of experiment, with an initial value of 4,2
gVSSL-1.
The kinetics assay results also helped checking out the removal rates for ammonium
and nitrite, and production rates for nitrate. On the average the specific nitrate and
ammonium removal rate, with continues NLR was 0,370,07 g NO2-N gVSS-1d-1 and 0,270,07 gNH4-N/gVSS-1d-1, respectively. For nitrate production was 0,0550,030 gNO3-NgVSS-1d-1,
The organic carbon removal was also tested. The effluent values were variable, and
real wastewater had no direct effect on the capability of the Anammox process to
remove organic carbon. This is due to a perfect partial-nitrification, who allowed the
real effluent to have low organic carbon, which not developed inhibition effect to the
Anammox bacteria.
During phase 2, the reactor was fed with real wastewater without any pre-treatment. This experiment wasn’t very successful, and Anammox system failed.
September 2017
Results showed that the process can work with this type of wastewater, if a
conservative start-up strategy is adopted and a partial-nitrification step is used to
remove organic carbon.
Keywords: Anaerobic digestion, Anammox, partial-nitrification, ammonium, nitrite, real
Resumo
Durante este estudo, água residual proveniente da Digestão Anaeróbica de resíduo
solido municipal foi pré-tratada e posteriormente alimentada a um reator Anammox
granular. O reator foi iniciado com um rácio sintético:real de 90%:10%
Uma estratégia de alimentação foi adotada de maneira a substituir gradualmente o
influente sintético pelo real, de maneira a não colocar a bactéria sobre condições de
stress químico.
A experiencia foi dividida em duas fases, uma primeira com um crescimento gradual do
rácio de influente real e uma segunda fase com 100% influente real.
O influente é caracterizado por um Nitrogen Loading Rate de 1. 5gN L-1 d-1, com um
rácio NO2-N/NH4-N de 1.20 (818 mg/L e 682 mg/L, respetivamente.
.
As eficiências de remoção foram estáveis durante toda a experiencia, por volta dos 90%
A atividade da bactéria aumentou durante o período experimental. Foi observado um
crescimento de sólidos suspensos voláteis durante a primeira fase. O valor inicial foi de
4,2 g VSS L-1.
De maneira a avaliar a atividade do processo, ensaios cinéticos foram realizados. Foi
então possível observar e calcular as velocidades de remoção de amónia e nitrito e
produção de nitrato. Em media, taxa de remoção especifica de amónia e nitrito foram
0,370,07 g NO2-N gVSS-1d-1 e 0,270,07 g NH4-N /gVSS-1d-1, respetivamente, com NRL continuo.
Já a taxa de produção de nitrato foi 0,0550,030 g NO3-N gVSS-1d-1.
A capacidade de remoção do processo foi também testada. A concentração de TOC no
efluente foi variável durante todo o processo, as dentro de valores que não causaram
inibição do processo.
Por trás disto, estará a elevada eficácia do processo de pré-tratamento em remover,
permitindo o influente do processo Anammox ter uma concentração baixa de TOC.
Durante a segunda fase, o reator foi alimentado com agua residual não tratada. A
experiencia não foi bem-sucedida, e o Sistema falhou durante uns dias.
De maneira a resolver este problema, foi novamente alimentado a 100% com influente
September 2017
Os resultados obtidos mostram que o sistema e capaz de trabalhar com este tipo de
agua residual, se uma estratégia de alimentação conservativa for adotada e um
pré-tratamento for usado para remover carbono orgânico.
Keywords: Anaerobic digestion, Anammox, partial-nitrification, ammonium, nitrite, real
Abbreviations
HyMeCA – Hydrogen-Methane-Compost-Ammonia Anammox – Anaerobic ammonium oxidation SHARON – Single reactor
COD – Chemical oxygen demand NOB – Nitrite oxidizing bacteria AOB – Anammox oxidizing bacteria HRT – Hydraulic Retention Time SRT – Sludge Retention Time
FISH – Fluorescence in situ Hybridization
SNAD - Simultaneous partial-nitrification, ANAMMOX and denitrification NLR – Nitrogen Loading Rate
NLRmáx – Nitrogen Loading Rate maximum Ntot- Total Nitrogen
TOC – Total Organic Carbon NRR – Nitrogen Removal Rate NitDR – Nitrite Discharge Rate NRE – Nitrogen Removal Efficiency TC – Total Carbon
IC – Inorganic Carbon
Contents
ACKNOWLEGMENTS ...3
ABSTRACT ...5
RESUMO ...7
ABBREVIATIONS ...9
CONTENTS ... 11
1. INTRODUCTION ...1
1.1OVERVIEW ... 1
1.2MAIN GOALS OF THIS THESIS ... 1
1.3STRUCTURE OF THE THESIS ... 2
1.3HYMECA PROJECT ... 2
2. ARTICLE REVIEW ...5
2.1BIOLOGICAL NUTRIENT REMOVAL ... 6
2.2AUTOTROPHIC NITROGEN REMOVAL ... 8
2.2.1THE PARTIAL NITRIFICATION PROCESS ... 8
2.2.1.2FREE AMMONIA (NH3) AND FREE NITROUS ACID (HNO2) CONCENTRATION ... 9
2.2.1.2 PH ... 10
2.2.1.3OTHER SUBSTRATES ... 11
2.2.1.4TEMPERATURE ... 11
2.2.1.5DISSOLVED OXYGEN CONCENTRATION... 12
2.2.1.6 Sludge age, SRT and HRT ... 12
2.2.1.7 Organic carbon and salts ... 13
2.2.1.8 Other influencing parameters ... 13
2.2.2 The ANAMMOX process ... 14
2.2.2.1BACTERIA BACKGROUND ... 14
2.2.2.2ANAMMOX IN NATURAL ENVIRONMENTS ... 16
2.2.2.3METABOLISM INHIBITION AND PROCESS PERFORMANCE ... 16
2.2.2.3.1TEMPERATURE AND PH ... 16
2.2.2.3.2OXYGEN ... 17
2.2.2.3.3ORGANIC CARBON... 17
2.2.2.3.4BIOMASS CONCENTRATION ... 18
2.2.2.3.5SUSPENDED SOLIDS ... 18
2.2.2.3.6SALTS ... 18
2.2.2.3.7INHIBITION OF SUBSTRATES AND PRODUCTS ... 19
2.2.2.3.8OTHER INFLUENCE FACTORS ... 19
2.2.2.4PROCESS CONFIGURATIONS ... 19
2.2.2.5ANAMMOX APPLICATIONS ... 20
3. MATERIALS AND METHODS ... 21
3.1REACTOR SYSTEM AND EQUIPMENT CONTROL ... 21
3.2BIOMASS ORIGIN ... 22
COMPOUND ... 22
CONCENTRATION ... 22
3.3FEEDING STRATEGY (EXPONENTIAL LAW) ... 23
3.4ANALYTIC METHODS ... 24
3.4.1CHEMICAL MEASUREMENTS ... 25
3.4.2MASS BALANCES ... 26
3.4.3TOC–TOTAL ORGANIC CARBON ... 28
September 2017
3.5.1SOLIDS ANALYSIS... 30
3.5.2SPECIFIC ANAMMOX ACTIVITY ... 31
4. RESULTS AND DISCUSSION ... 33
4.1GENERAL ASPECTS ... 33
4.2PROCESS PERFORMANCE ... 34
4.2.1NITROGEN LOADING RATE,NITROGEN REMOVAL RATE AND NITRITE DISCHARGE RATE... 34
4.2.2REMOVAL EFFICIENCIES ... 35
4.3STOICHIOMETRY AND KINETICS ... 36
4.4TSS AND VSS CONCENTRATION; DENSITY AND GRANULAR SLUDGE ... 38
4.5SPECIFIC ANAMMOX ACTIVITY:NH4-N AND NO2-N REMOVAL RATES AND NO3-N PRODUCTION RATE ... 41
4.5.1NH4-N AND NO2-N REMOVAL RATES ... 42
4.5.1.1VOLUMETRIC NO2-N REMOVAL RATE ... 43
4.5.1.2SPECIFIC NO2-N REMOVAL ... 43
4.5.1.3VOLUMETRIC NH4-N REMOVAL RATE... 44
4.5.1.4SPECIFIC NH4-N REMOVAL... 45
4.5.2SPECIFIC ANAMMOX ACTIVITY:NO3-N PRODUCTION RATES ... 46
4.5.2.1VOLUMETRIC AND SPECIFIC NO3-N PRODUCTION RATE ... 47
4.5.3THE SPECIFIC ANAMMOX ACTIVITY... 48
4.6REMOVAL OF ORGANIC MATTER ... 48
5. CONCLUSIONS ... 51
6. REFERENCES ... 53
7.APPENDICES ... 58
7.1APPENDIX I–INFLUENT CHARACTERISTICS ... 58
7.2APPENDIX II–TSS AND VSS CONCENTRATION; DENSITY AND GRANULAR SLUDGE ... 1
Lists of figures
Figure 1 - HyMeCa Project block diagram ... 3
Figure 2 - Conventional nitrification/denitrification process ... 7
Figure 3 - Autotrophic nitrogen removal : nitrification/denitrification over nitrite ... 8
Figure 4 - Relation between residence time and temperature. ... 12
Figure 5 - Anammox bacteria phylogeny. ... 15
Figure 6 - Anammox bacteria protection from nitrifiers, Biofilm configuration
(Szatkowska, 2014) ... 17
Figure 7 - Schematic representation of the Anammox SBR system (Lucidchart software)
... 21
Figure 8 - The Anammox reactor
–
Experimental set-up ... 22
Figure 9 - Exponencial Low plotted - Feeding strategy ... 24
Figure 10 - Laboratory Spectophotometer (HITACHI, mod U-2000) ... 25
Figure 11 - Laboratory ion chromatographer DIONEX ion-chromatograph (mod IC-90)
... 26
Figure 12 - Laboratory Total organic carbon instrument ... 29
Figure 13 - Typical N-profiles in a kinetics assay ... 32
Figure 14 - Time course of NLR, NRR and NitDR during the experimental activity ... 34
Figure 15 - Removal efficiencies ... 35
Figure 16 - NO2-N/NH4 removal ratio compared to literature... 37
Figure 17 - NO3-N produced/NH4 removal ratio compared to literature ... 37
Figure 18 - Reactor's VSS, TSS and Ratio ... 39
Figure 19 - Reactor's granules density ... 40
Figure 20 - Effluent's TSS, VSS and VSS/TSS ration ... 41
Figure 21 - NO2-N and NH4-N removal velocity ... 42
Figure 22 - Volumetric NO2-N removal ... 43
Figure 23 - Specific NO2-N removal... 44
Figure 24 - Volumetric NH4-N removal ... 44
Figure 25 - Specific NH4-N removal ... 45
Figure 26 - NO3-N production velocity ... 46
Figure 27 - Volumetric NO3-N production rate ... 47
Figure 28 - Specific NO3-N production rate ... 47
Figure 29 - Effluent total organic carbon concentrations during experience. ... 49
List of tables
Table 1 - Anammox reactor configurations
[29] ... 20
Table 2 - Synthetic Bag composition ... 22
Table 3 - Synthetic and real wastewater characteristics. ... 23
Table 4 - Kinetics assay solution concentration ... 31
Table 5 - Other literature values... 38
Table 6 - Experimental values for VSS, TSS, VSS/TSS and Granules density... 40
Table 7 - Experimental VSS, TSS and VSS/TSS ration ... 41
Table 8 - Experimental Values for Volumetric and specific removal rates ... 46
Table 9 - Specific removal literature values ... 46
Table 10 - Experimental Values for Volumetric and Specific production rate ... 48
Table 11 - Total organic values for Synthetic and real influent ... 49
Table 12 - Real Wastewater influent Loads ... 58
Table 13 - Real influent characteristics... 62
Table 14 - Reactor Solids analysis ... 1
1. Introduction
1.1 Overview
Ammonia is one of the most important components in wastewater which must be
removed before effluents can be discharged, otherwise it can cause eutrophication and
consequent oxygen depletion, originating profound changes in the ecosystem. This
N-removal is most of the times achieved by complete ammonia oxidation to nitrite and
subsequent reduction of the nitrate to dinitrogen gas under anoxic conditions.
This type of removal has been done for many years, but the need for new and
sustainable systems for nitrogen removal has increased in last decades since the
conventional systems cannot longer deal with the increasing nitrogen loads in a
cost-effectiveness way. An alternative way was with the implementation of a
partial-nitrification/Annamox processes for biological N-removal.
1.2 Main goals of this thesis
First of all, assess the main problem: after the anaerobic digestion of municipal solid
waste and the many benefits we can take from that (the energy recovery as H2 and CH4)
we need to make sure that the liquid residues, ammonium-rich liquid streams, are treated
before being discharged in the environment.
To do such, is necessary to evaluate the applicability of the partial-nitrification/Anammox
process in the treatment of real wastewater.
Inside the HyMeCA project, this thesis was developed during the operation objective 3.4,
the evaluation of the SHARON-Anammox process behaviour when fed with increasing
amounts of real wastewater produced by anaerobic digestion in a semi-continuous mode,
up to the complete substitution of the synthetic influent. The performance was evaluated
in terms of N-removal.
In short, starting with low ratio between real and synthetic ammonium rich influents,
increasing this ratio up to the influent is totally real wastewater and then optimize.
The results of this thesis were achieved by controlling the Anammox reactor within
September 2017
2
1.3 Structure of the thesis
In chapter 2 an overview about the nitrification/denitrification process is provided, with a
special interest in the Anaerobic nitrogen removal: partial-nitrification/Anammox, with
close-up on the process parameters and applications.
Materials and methods used to carry out the experiment are presented in chapter 3.
Chapter 4, the results and respective discussion.
The main conclusions of the experimental activity are given in chapter 5.
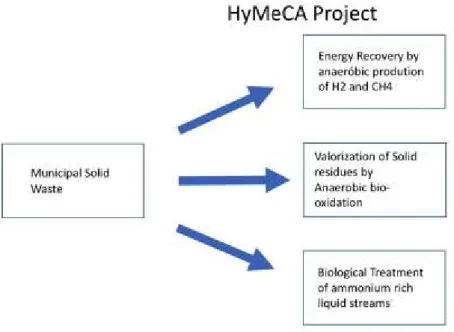
1.3 HyMeCA project
One of the main problems concerning the environment are associated with the municipal
solid waste and its correct management. Despite the significant reduction in production,
proper management of organic waste is mandatory by legislation. The most applied
treatment technologies are composting and anaerobic digestion, which are characterized
by important weak points as stand-alone processes (i.e operative costs are not
counter-balanced by product income and instability due to intrinsic heterogeneity of organic
residues are the main problems).
Aiming the correct management of organic residues and looking forward to the objectives
expressed in HORIZON 2020, which considers the maximum energy recovery as an
important valorisation of process residues and minimum environmental impact as the
true eco-sustainable approach, the HyMeCA project appears as a novel research
proposal, which intends the development of an integrated system for the biological
treatment, combining the production of H2 and CH4 from the organic fraction of MSW,
the valorisation of solid residues by anaerobic bio-oxidation ( also known as composting )
and the biological treatment of ammonium rich liquid streams, based on a double-stage
2. Article review
In the past four decades, much focus has been placed on solving the harmful
environmental effects of discharging high concentration nitrogen (in form of ammonia or
organic nitrogen) effluents into lakes and rivers. These effluents have been shown to be
toxic for most of the fish and other aquatic life, causing depleting dissolved oxygen levels
and eutrophication [1].
The most recognizable manifestation of eutrophication are algal blooms that occur during
summer. This growth can increase chlorine in the drinking water, which leads to higher
levels of disinfection by-products that can increase the risk of cancer [2].
The World Health Organization (WHO) has developed WHO Guidelines for
Drinking-waterQuality due to ill effects of nitrogen compounds in water, especially those waters
with which the human being has more contact with, such as drinking water.
Is known that the toxicity of nitrate to humans is mainly attributable to it’s reduction to nitrite. The major biological effect of nitrite in humans is it involvement in the oxidation of
normal haemoglobin (Hb) to methaemoglobin (metHb) which is unable to transport
oxygen. This condition, called methaemoglobinaemia, causes cyanosis, and at higher
concentrations, asphyxia. This problem is even more critical when found in infants under
3 months of age.
Nitrite has also shown to be reactive in the presence of N-nitroso compounds, which is
carcinogenic.
Some guideline values for nitrate concentration stated a maximum of 50mg/L, based in
epidemiological evidence for methaemoglobinaemia. For nitrite, the guideline value is
3mg/L based [3].
Also, ammonia concentration can be an issue, even though there is no maximum
contaminant level for it. It is known that ammonia is toxic to fish and that toxicity increases
with increasing pH and temperature (due to NH4+/NH3 equilibrium favors the un-ionized
form). US EPA, an environmental agency, has recommended a water quality or aquatic
life expressed as total ammonia nitrogen of 17mg/L for acute exposure (1h) and 1,9mg/L
for chronic exposure (30 days) ( pH=7 and temperature= 20ºC ) [4]
Is legislated by the European Union, the nitrates directive (1991). This directive aims to
protect water quality across Europe by preventing nitrates from agriculture or industry
sources polluting ground or surface waters. Was stated that nitrate levels in groundwater
September 2017
6
In order to treat effluents with an excess of total nitrogen, various treatments can be
applied, from chemical-physical procedures such as ammonia stripping to biological
nitrogen removal processes, like conventional nitrification/denitrification.
Typical wastewaters with high ammonia concentrations are reject waters, piggery
manure, landfill leachate and some industrial wastewaters (e.g from pharmaceutical and
petrochemical industries).
2.1 Biological nutrient removal
It’s an established technology, being a typically used process for nitrogen and phosphorus removal from wastewater before being discharged into surface or ground
waters.
A high concentration of such nutrients can cause harmful and irreversible changes in the
ecosystems, causing cultural eutrophication.
Althought, conventional biological processes are not suited to remove total nitrogen (TN)
or total phosphorus (TP) due to is high concentration effluents.
A Biological nutrient removal plant can be built to suit perfectly the type of effluent to be treated, including oxidation ditches membrane bioreactors (MBR’s) and sequencing batch reactors (SBR’s). This different BNR designs are widely use in wastewater treatment plants, and very successfully. The secret is to combine excellent modeling and
design, high quality instruments and controlling with highly trained operators monitoring and testing every aspect of the operation. Although, it’s a biological process, and we should not treat the bacteria as a chemical catalyst, some unpredictability is expected
[6].
Biological nutrient removal is can outcompete physicochemical processes since its
capable of removing nitrogen from such effluents transforming it into harmless dinitrogen
gas (N2). This has shown to be a more economical and effective way to reduce nitrogen
loads in wastewater.
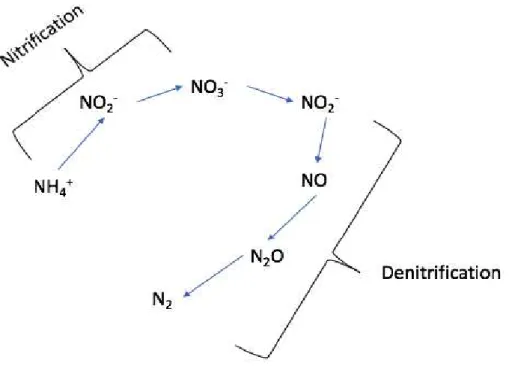
The most commonly used approach for nitrogen removal is a combination of aerobic
autotrophic nitrification of NH4+ to nitrite NO2- and nitrate NO3-, followed by an anoxic
heterotrophic denitrification producing N2 [7].The first step, called nitrification, is done by
different bacterial genera which use ammonia or nitrite as energy source and oxygen as
electron acceptor and inorganic carbon as carbon source. As the second step,
nitrogen compounds are reduced to dinitrogen gas by heterotrophic bacteria (denitrifiers)
that uses nitrite/nitrate instead of oxygen as electron acceptors and organic matter as
carbon and energy source [8]. This conventional wastewater nitrogen removal system
requires a lot of energy for nitrification and an external carbon source for denitrification.
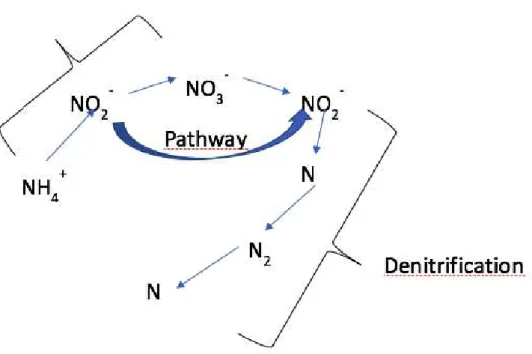
A sustainable alternative is the nitrification/denitrification over nitrite. These processes
require only 25-60% less oxygen consumed and 40% of the added COD[9].
Another alternative includes a partial nitrification followed by an anaerobic (in reality anoxic) ammonia oxidation(Anammox). As main advantage, the doesn’t need any external carbon source to convert nitrogen to gas.
September 2017
8
Figure 3 - Autotrophic nitrogen removal : nitrification/denitrification over nitrite
In the ANaerobic AMMonia OXidation (ANAMMOX) process, the ammonia is oxidized
(in anoxic conditions) with nitrite as an electron acceptor. Both ammonia and nitrite are
consumed on an almost equimolar basis. This process must be always combined with a
partial nitrification process, such as the SHARON, where half of the ammonia is oxidized
to nitrite. The combined process was named autotrophic nitrogen removal.
Such a sustainable approach is now intensely studied around the world, and would be a
matter of time until the pollutants are no longer seen as a problem, but a source or
renewable energy.
2.2 Autotrophic Nitrogen removal
2.2.1 The partial nitrification process
Nitrification, as stated before, is the ammonium oxidation to nitrate. It is a double-step
reaction operated by two completely different genera of bacteria. First, ammonium is
oxidized to nitrite by ammonia-oxidizing bacteria (AOB). For every mol of ammonium
oxidized, 2 mol of protons are produced. We can then conclude that ammonia oxidation
is an acidifying process. In the second step, the nitrite-oxidizing bacteria oxidizes nitrite
to nitrate. There are no single bacteria which can perform this all process in one step, so
The reactions are given by the following:
𝑁𝐻4++32 𝑂2→ 𝑁𝑂2−+ 𝐻2𝑂 + 2𝐻+ 𝐸𝑞. 1
𝑁𝑂2−+12 𝑂2 → 𝑁𝑂3− 𝐸𝑞. 2
Since the partial-nitrification effluent should be suitable to the ANAMMOX process, nitrite
oxidizing activity should be suppressed and therefore ammonium should only be
oxidized by 50%-55% to nitrite. Basically, we should allow AOB to grow and suppress
NOB activity washing out and preventing nitrate production.
To achieve this, some parameters should be considered and monitored, such as the free
ammonia (NH3) and the free nitrous acid (HNO2) concentrations, temperature, pH and
dissolved oxygen concentration. Managing this considering the difference in sensitivity
of ammonium and nitrite oxidizers determines the accumulation of each bacteria in the
reactor.
2.2.1.2 Free ammonia (NH3) and Free nitrous acid (HNO2)
concentration
Free ammonia and free nitrous acid concentration have a large influence since they are
the actual substrate/inhibitor for ammonium and nitrate oxidation [10] .The concentration
of these unionized forms can be calculated, using the Monod curve and taking in to
account the total ammonia (TAN) and total nitrous (TNO2) concentration. From,
𝑇𝐴𝑁 = 𝑁𝐻4++ 𝑁𝐻3 𝐸𝑞. 3
and
𝐾𝑒,𝑁𝐻4+=𝑁𝐻3. 𝐻
+
𝑁𝐻4+ = 𝑒 6344
𝑇+273 𝐸𝑞. 4
the concentration of uncharged ammonia (NH3) is given by:
𝑁𝐻3 = 𝑇𝐴𝑁
1 + 10𝐾𝑒,−𝑝𝐻
𝑁𝐻4+
September 2017
10
For nitrous acid concentration,
𝑇𝑁𝑂2 = 𝑁𝑂2−+ 𝐻𝑁𝑂2 𝐸𝑞. 6
and
𝐾𝑒,𝐻𝑁𝑂2= 𝑒
−2300
𝑇+273 𝐸𝑞. 7
the Monod curve for the HNO2 concentration is given by
𝐻𝑁𝑂2 = 𝑇𝑁𝑂2
1 +𝐾𝑒,𝐻𝑁𝑂2 10−𝑝𝐻
𝐸𝑞. 8
the ratio between both unionized and ionized forms is determined by the pH and
temperature values inside the reactor.
So, in way to make Anammox-suited effluent we should suppress nitrite oxidizers by
increasing the pH. Was stated that in a pH environment between 7,5-8 nitrite oxidizers
are outcompeted. Even though this is a good approach to somehow wash-out the nitrite
oxidizers, NOB adaptation has been reported [9]. Therefore, to achieve a good
Anammox influent, we should also regulate other factors.
2.2.1.2 pH
pH has a great influence in the good performance of partial nitrification. The main reason
is the influence on the NH3/NH4+ and HNO2/NO2- equilibrium. Due to this equilibrium, the
preference of ammonium oxidizers for slightly alkaline environments is the fact that these
organisms use NH3 as substrate [10] while at certain pH values both NH3 and HNO2 can
inhibit the oxidizers. Also, other inhibitions can show, as Heillinga, et al. [11] observed,
a decrease in growth rate of nitrite oxidizers at pH 7 compared with pH 8. The growth
rate difference for ammonium oxidizers were negligible for these values. For pH values
below 7, nitrification performance decrease due to carbon limitation, owing to CO2
2.2.1.3 Other substrates
Nitrification, as stated above, is an acidifying process. To neutralize, bicarbonate is
added in equimolar basis. Although, since we only want 50% of ammonia oxidized
(partial-nitrification), only half is required. Some reduction on ammonia oxidizing activity
was reported due to bicarbonate limitation [12].
Moreover, Ganigue, et al. [13] showed that bicarbonate is a key parameter for controlling
the molar ratio of ammonia and nitrate in the effluent. Sludge reject water is a good
influent for partial nitrification since a proper ammonium:alkalinity ration of 1 is found in
these streams. Also, the presence of phosphate has an impact in oxidizing performance,
specially the nitrite oxidizing bacteria is unable to oxidize nitrite to nitrate in its absence,
the so-called phosphate block [9].
2.2.1.4 Temperature
Temperature is also a very important parameter in partial-nitrification process
performance. Although, the real influence is hard to determine because of its interaction
with mass transfer, chemical equilibria and growth rate [9].
The temperature rise increases the NH3 inhibition and also increases the organisms
activity due to the Arrhenius principle (until a certain level, and then obvious decrease),
which can be seen has two opposite effects. Experiments showed an optimal
temperature of 35ºC for the ammonia oxidizers and 38ºC for nitrite oxidizers. And so, a
temperature between 35-45ºC is optimal for partial nitrification [10] .It’s also expected
that long-term exposure to temperatures above 40ºC can cause deactivation Hellinga,
et al. [11]concluded that at temperatures above 25ºC the specific growth of AOB was
highter that NOB.
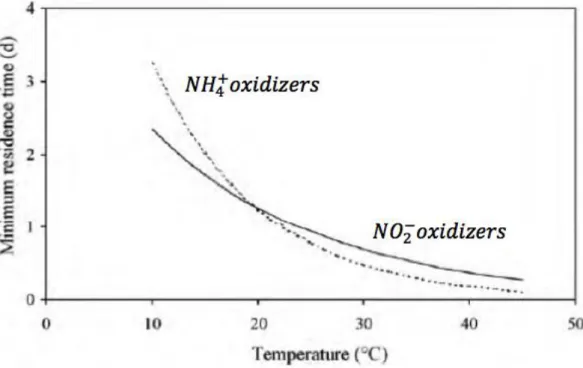
This principal is based in a relation between Sludge retention time and temperature. The
process is established in a chemostat by working at high temperature (above 25ºC) and
maintaining an appropriate SRT of 1-1.5 days, so the AOB are maintained in the reactor
September 2017
12
Figure 4 - Relation between residence time and temperature.The partial-nitrification process was also successfully started up at lower temperature
(between 15-30ºC) [14] . This means that partial nitrification is not restricted to streams
with high temperatures, but can be applied to multiple industrial wastewaters. Is
important to refer that below 15ºC, the process performance decreases dramatically.
2.2.1.5 Dissolved oxygen concentration
Since the process is aerobic, the dissolved oxygen concentration Is of most importance
when we talk about nitrification, for both AOB and NOB. The ammonium oxidizers though
seem to be stronger against low dissolved O2 than nitrite oxydizers, which means that
low dissolved O2 concentrations influence more the NOB activity. This can be explained
by the difference in oxygen half saturation constant (ko) for both bacteria. According to
Hunik, et al. [15]the half saturation constant for dissolved oxygen is 0,16mgO2.L-1 and
0,54 mgO2.L-1 for AOB and NOB respectively. The constant is also influenced by mass
transfer inside the reactor, biomass density, floc size, the mixing intensity and the oxygen
diffusion in the floc [9].
2.2.1.6 Sludge age, SRT and HRT
As explained before, ammonium oxidizers retention and nitrite oxidizers wash-out can
sludge ages, depending on temperature. The minimum doubling time for AOB is 7-8h
and for NOB is 10-13h. Was found that a SRT between 1-2,5 days result in a good
performance [16]. So, for the SHARON process, HRT (which is equal to SRT) is 1 day
under high temperature and high oxygen concentration to favor AOB growth above NOB.
Other reports showed that partial nitrification can be accomplished in different conditions,
such as low temperature (<13ºC), with higher SRT [17].
2.2.1.7 Organic carbon and salts
Is known that the partial-nitrification process is suitable to treat wastewater streams with
low organic to carbon (C/N) ratio. Mosquera-Corral, et al [18]observed a stimulation in
ammonium oxidation in the Sharon process when acetate was fed as carbon source
(0,2gCgN-1), leading to a higher nitrate to ammonia molar ratios in the effluent
(stoichiometricly speaking). It also reported inhibitory effect when 0,3gCgN-1 was fed to
the reactor. This was explained by Hanaki, et al [19] as decreasing affinity of ammonia
oxidizers for ammonia. It was also found that for the same SRT, the ammonia oxidation
efficiency decreased at higher COD concentrations, but at constant COD concentration
efficiency was restored by increasing the SRT.
In some industrial wastewaters, the presence of high concentration of salts can inhibit
ammonia concentration. However, the biomass can adapt to saline environments [9].
2.2.1.8 Other influencing parameters
Other influencing factors to the partial nitrification performance were reported. Zepeda,
et al. [20] showed that BTX (benzene, toluene and xylene) decrease the nitrification
specific rates, mainly the ammonia oxidation pathway. Also, many metals such as
chromium, nickel, copper, zinc, lead and cadmium might inhibit both steps of nitrification.
Some organic acids, such as formic, acetic, propionic and n-butyric acid all exhibit
inhibition to nitrite oxidation, with no effect in ammonia oxidation.
Also, chloride, cyanide and azide showed inhibitory effects, affecting more the nitrite
oxidation than ammonia.
Light is also an inhibiting factor for both bacteria since cytochrome C is present and is
September 2017
14
2.2.2 The ANAMMOX process
The ANAMMOX process has a lot of history. It was first discovered almost 3 decades
ago, but was already predicted 10 years before, based on thermodynamic calculations
[21]. Broda pointed out anaerobic ammonium oxidizers as “missing in nature” based on
his considerations.
Also, Van de Graaf, et al. [22] showed by inhibition experiments that anammox is a
microbially mediated process and not a chemical reaction [9].
The first evidence of anaerobic ammonium oxidation to dinitrogen gas was obtained
from denitrifying fluidized-bed reactor system [23].
The Anammox reaction takes place in an anoxic environment, where the ammonia is
oxidized to dinitrogen gas, using nitrite as an electron acceptor. The nitrite is also oxidized to nitrate, but in a much fewer quantity. This oxidation doesn’t need the addition of a carbon source (organic matter) since process is autotrophic.
The overall reaction 9, half reactions 10 and 11 [24] and cell synthesis reaction proposed
by Strous, et al. [25] are presented below:
𝑁𝐻4++ 𝑁𝑂2−→ 𝑁2+ 2𝐻2𝑂 𝐸𝑞. 9
𝑁𝑂2−+ 2𝐻+→ 𝑁𝑂 + 𝐻2𝑂 𝐸𝑞. 10
𝑁𝑂 + 𝑁𝐻4++ 2𝐻++ 3𝑒−→ 𝑁2𝐻4+ 𝐻2𝑂 𝐸𝑞. 11
𝑁𝐻4++ 1.32𝑁𝑂2−+ 0.066𝐻𝐶𝑂3−+ 0.13𝐻+
→ 1.02𝑁2+ 0.26𝑁𝑂3−+ 0.066𝐶𝐻2𝑂0.5𝑁0.15+ 2.03𝐻2𝑂 𝐸𝑞. 12
Since it was discovered, the ANAMMOX process is reported in different wastewater
treatment plants with different stream compositions. It is also present in nature and
largely contributes to world nitrogen cycle.
2.2.2.1 Bacteria Background
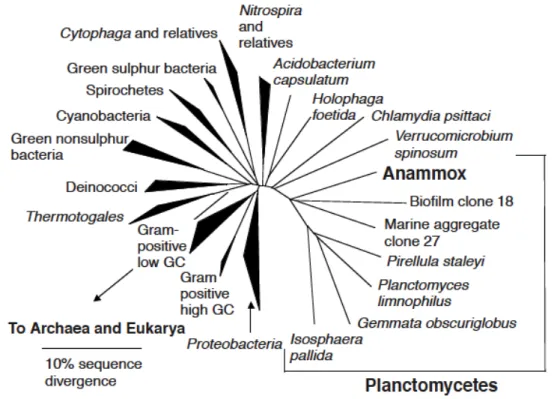
Strous, et al. [26] showed that the Anammox bacteria belongs to the Planctomycetes
Figure 5 - Anammox bacteria phylogeny.
Fluorescent in situ hybridization (FISH) probes were developed for the different
Anammox bacteria, and was found by Schmid, et al. [27]that rarely two or more types
of Anammox bacteria could grow in the same environment. This proves that each one
genera of bacteria occupy their own typical environment.
The Anammox bacteria has a brown-reddish color and doubling time of 5.5-7.5 days in
a membrane bioreactor [28] .The doubling time depends the method used to proceed
the counting [9] .
Moreover, these microrganisms have several unique features, including the use of
hydrazine (N2H4) as free catabolic intermediate.
The discovery of Anammox bacteria changed completely the scientific view of the
nitrogen cycle, and turn out to be a fundamental step on the evolution of wastewater
September 2017
16
So far 10 Anammox bacteria species have been identified. The known species are
divided in 5 genera:
(1) Kuenenia – Kuenenia stuttgartiensis;
(2) Brocadia – B. Anammoxidans, B. fulgida and B. sinica
(3) Anammoxoglobus – A. propionicus
(4) Jettenia – J. asiatica
(5) Scalindua – S.brodae, S.sorokinii, S.wagneri and S. profunda
All 5 genera of Anammox bacteria share unique physiological and morphological traits,
with the key being the presence of anammoxsome [29].
2.2.2.2 Anammox in natural environments
The Anammox was firstly found in lab-scale, in different reactor configurations, followed
by its detection in the natural environments such as marine sediments.
There the Anammox bacteria are found in low oxygen zones, the major source of
nitrogen release into the atmosphere from the oceans [30] . It was also detected in
deeper marine hypersaline systems [31] . Moreover, it was found in terrestrial
ecosystems, such as lakeshores, agricultural soil, permafrost soil and in samples
associated with nitrophilic or nitrogen-fixing plants [32][29].
Anammox was also reported to occur in low temperatures (-2,5ºC) in sea ice and high
temperatures (70ºC) in hot springs and hydrothermal vent areas. [29].
2.2.2.3 Metabolism inhibition and process performance
Like the partial-nitrification process, the Anammox is also inhibited but much more
sensitive to the environment changes.
Some parameters must be controlled and managed so we can establish high
performance to the process.
2.2.2.3.1 Temperature and pH
Is known that the optimum temperature for the Anammox process is around 30-40ºC [9].
Dosta, et al [33] found a maximum activity for Anammox biomass in a temperature
bacteria activity inhibition. It was also proved by Cema, et al. [34] and Isaka, et al.
[35]that the Anammox process can be achieved successfully at 20ºC, being the biomass
slow adaptation the key factor in order to operate at low temperature.
The optimal pH value is between 6.7-8.3
2.2.2.3.2 Oxygen
As Anammox bacteria favors anaerobic conditions, the presence of dissolved oxygen
inhibits the process, reversibly. Particularly, oxygen is very significant in single stage
reactors where both partial-nitrification and Anammox occur simultaneously. Normally,
the reactor configuration of such systems (Biofilm) allows the process by protecting the
Anammox bacteria in inner layer from nitrifiers in the outer layer.
Figure 6 - Anammox bacteria protection from nitrifiers, Biofilm configuration (Szatkowska, 2014)
2.2.2.3.3 Organic Carbon
High organic carbon to nitrogen concentrated streams are usually used as Anammox
influent. In such streams is can found landfill leachate and wastewater from digested
animal waste. During Anaerobic digestion, fast biodegradable organic content is
converted to biogas. And so, only biodegradable organic matter will be present in these
wastewaters [9].In the partial-nitrification, this organic matter is oxidized and the
denitrifiers present cannot outcompete the Anammox bacteria inside the reactor. This is
true until a certain level, since the growth rate of denitrifiers is significantly higher than
the Anammox. Also, the denitrification reaction is thermodynamically favorable than
September 2017
18
The Anammox only removes 90% of incoming nitrogen (in form of nitrite/ammonia) and
leaves the remaining 10% inside the reactor. The presence of both denitrification and
Anammox reaction in the same reactor could help to reduce the nitrate concentration,
since it can be reduced by denitrifiers to nitrite and used by ammonium for oxidation[9].
Some organic carbon such as methanol an ethanol showed total and irreversible
inhibition at low concentrations [27].
2.2.2.3.4 Biomass concentration
Biomass concentration is key parameter, that plays an important role in the Anammox
activity. [26] reported that Anammox is only active when the cell concentration is above
1010-1011 cells/ml. This could be explained by the need of intercellular communication for
activity. Can also be explained by the fact that hydrazine diffuses easily to the outside of
the cell and minimum internal concentration is needed for activity [9].
The presence of contaminating cells is also requested, since these can supply vitamins
and remove toxic components. If the activity suffers inhibition, the addition of
intermediates such as hydroxylamine and hydrazine is necessary to restart Anammox
activity.
2.2.2.3.5 Suspended solids
Flocculants are usually used to remove colloidal organic and inorganic substances from
wastewater before the Anammox reaction. By using flocculants settling ability of the
influent suspended solids can be improved and prevent their accumulation inside the
reactor. In other hand, it can also be attached to the Anammox bacteria hence reducing
their activity [9].
2.2.2.3.6 Salts
In natural saline environments only one type of Anammox bacteria was found, the
Scalindua genus.
[36]found that NaCl concentrations below 150mM did not affect Anammox activity while
KCl and Na2SO4 affected it at concentrations higher than 100mM and 50mM respectively.
The nitrogen removal efficiency and maximum Anammox activity of salt adapted sludge
were similar to the reference freshwater sludge [9].
2.2.2.3.7 Inhibition of substrates and products
Nitrite presence inside the Anammox reactor cause inhibition. Hence, its concentration
should be an important parameter to control. The decreasing activity due to its presence
can be restored by adding trace amounts of Anammox intermediates hydroxylamine and
hydrazine, even after long term exposure.
It was also reported different tolerance for nitrite inhibition between different Anamm ox
bacteria genera.
Also, high concentration of nitrite can change the stoichiometry of ammonium to nitrite,
which means that the bacteria did not use ammonium as electron donor, but actually,
have generated an internal electron donor to reduce nitrite. This change in stoichiometry
was also found at higher temperatures.
The process is not inhibited by ammonium concentration up to 1g N/L [25].
Is known that chemolithoautothrophs use inorganic carbon as carbon source, therefore
bicarbonate concentration is an important factor which can affect the Anammox activity.
Low concentration of bicarbonate means low activity of Anammox and high
concentration of bicarbonate can lead to inhibition, this is due to the increase of pH inside
the reactor which means the production of high amount free ammonia.
2.2.2.3.8 Other influence factors
Like partial-nitrification, Anammox is also very sensible to light. It was observed a
decrease in activity between 30-50% [22].To prevent this to happen, the reactor is
usually covered by black plastic or aluminum paper to eliminate light effects in the reactor.
The stirring can also have a negative effect over the Anammox. Was stated by Arrojo,
et al. [37] that at stirring speeds up to 180 rpm no negative effect was showed but at 250
rpm some nitrite accumulation and 40% activity reduction was found.
2.2.2.4 Process configurations
Lots of systems can be successfully applied with Anammox bacteria. The major
September 2017
20
(Partial-nitrification in one reactor and Anammox in another), or in the same step (one
single reactor). Other difference is the bacteria growth type (granular sludge, activated
sludge or biofilm).
In table 1 are showed the different reactor configurations.
Table 1 - Anammox reactor configurations[29]
2.2.2.5 Anammox applications
The first full-scale reactor (for reject water treatment at Dokhaven, Rotterdam,
Netherlands) was established in 2002. Since then, a total of 114 full-scale Anammox
installations were reported around the world (data from 2015) being 88 of these plants
constructed in Europe.
The first reactor had a total capacity of 72m3, which is considerably low considereding
that, nowadays, there are full-scale plants with more than 142.000 m3 and treat 134 tons
per day of nitrogen load.
The main target are industrial wastewaters and up to now full-scale Anammox has not
been applied to mainstream waters treatment for domestic sewage.
High C/N ratio, low temperature and poor effluent quality are still the main reasons why
Anammox treatment is still not applied everywhere.
Even though the presence of organic matter at low concentrations does not affect
Anammox bacteria activity, it improves the total nitrogen removal via heterotrophic
denitrification, the so called SNAD process [38]
It is reported that in 23 full-scale Anammox installations that NH4+ and NO3
-concentrations are 100 and 50 mg N L-1, respectively, which indicates the need of further
treatment. This post-treatment results in an increase in cost and energy consumption,
and therefore, further development of integrated systems, like the SNAD, is necessary.
3. Materials and Methods
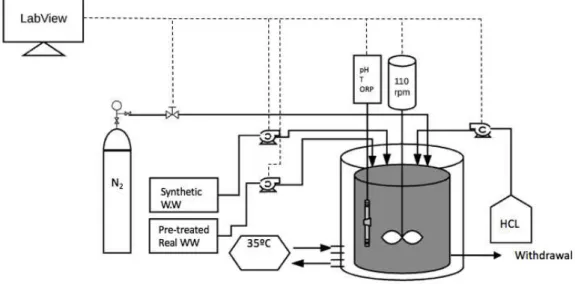
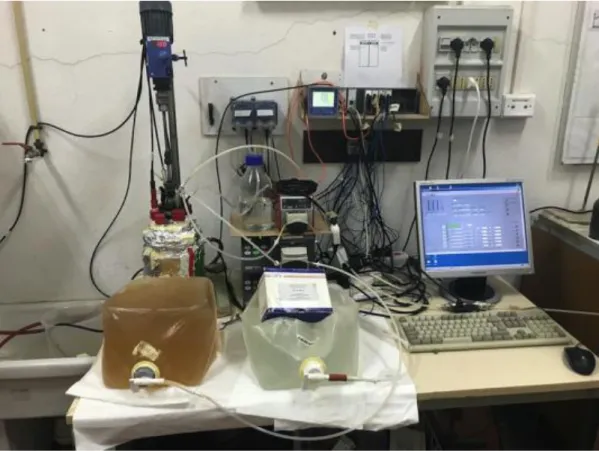
3.1 Reactor system and equipment control
During the experiment a glass sequencing batch reactor (SBR) with a working volume
of 2,13 L was used.
It was operated in a fed-batch mode with a 6 h cycle (267 minutes continues feeding, 83
minutes reaction, 5 minutes settling, 5 minutes withdrawal).
In every cycle, 533 ml of influent were pumped inside the reactor with a flowrate of 2
ml/min. 4 cycles a day, making the HRT = 1 day.
Mechanical mixing was provided by a stirrer (100±5rpm).
To assure anaerobic conditions inside the reactor, N2 gas was flushed into the reactor
in the beginning of every cycle for 5 minutes.
The reactor worked at temperature of 35ºC and pH between 7-7,10 and was covered by
aluminum paper to assure no light presence inside.
The temperature was maintained by using a water jacked and the pH by using 1M HCl.
Process timing and control and monitoring were performed using LabVIEW (v10.0).
September 2017
22
Figure 8 - The Anammox reactor – Experimental set-up
3.2 Biomass origin
The reactor was originally inoculated with Anammox granular biomass from the
Dokhaven-Sluisjesdijkwastewater treatment plant in Rotterdam (The Netherlands), and
gently provided by Paques, B.V.
At the start of this experiment, the biomass in the reactor came from a previous
experiment and was running under stable conditions, fed with a synthetic medium.
The synthetic influents were prepared in lab with the following compositions:
Table 2 - Synthetic Bag composition
Compound
Concentration
NO2-N (NaNO2) 818 mgN/L
NH4-N (NH4HCO3) 682 mgN/L
MgSO4.7H2O 200 mg/L
KH2PO4 6,25 mg/L
CaCL2.H2O 226 mg/L
Trace Elements 1,25 mL/L
The molar ratio NO2/NH4 used was 1.20 (the stoichiometric value for Anammox is 1.30)
to avoid nitrite accumulation inside the reactor. The total nitrogen fed was about
1500mgN/L per cycle.
The real wastewater coming from the anaerobic digestion of the municipal solid waste,
integrated in the HyMEca project. was pre-treated in partial-nitrification process (in this
case, the SHARON)
The reactor was started-up with 90% synthetic wastewater (Ntot=1500mgN/L and
NRLmáx=1.5KgN/m3d and 10 %real wastewater (same conditions)
It was progressively changed to the pre-treated real wastewater, until 100% of influent
was real pre-treated wastewater.
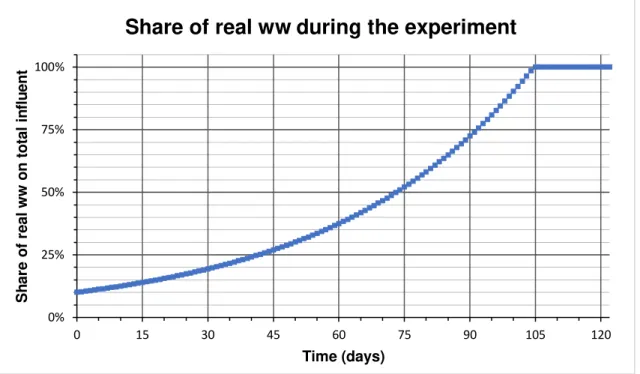
For better acclimation of Anammox biomass, a feeding strategy was implemented using
an exponential law, increasing the real wastewater share in the Anammox influent.
In table 3 are shown the average characteristics for the Real and Synthetic Influents.
Table 3 - Synthetic and real wastewater characteristics.
TYPE NH4-N mg/L N02-N mg/L N02/NH4 TN mgN/L
Synthetic WW 682 818 1.20 1500
Real WW* 67672 82862 1.240,16 1505100
*average characteristics
3.3 Feeding strategy (exponential law)
As stated before, the feeding strategy used in this experiment was based on an
exponential law [39] given by:
𝑁𝐿𝑅(𝑡) = 𝐴 ∗ 𝑒𝜇𝑃𝐴∗𝑡 𝑒𝑞. 13
The A constant corresponds to the NLR value in the beginning of the experiment, which
September 2017
24
Figure 9 - Exponencial Low plotted - Feeding strategyWas predicted the achieve of 100% on the day 105 of the experiment. The accumulated
real wastewater volume was 89,2 L
3.4 Analytic methods
In order to study the reactor some parameters needed to be calculated. And for so, some
measurements were made.
There were two kinds of measurements performed, Chemical measurements, which
included the NH4-N, NO2-N and N03-N concentration values in the influent and effluent
and Total organic carbon (TOC).
Also, biomass concentration and granules density inside the reactor were periodically
assessed, as well as solids concentration in the effluent. Specific Anammox activity was
also determined once a week
Before analysis, samples were centrifuged (10.000 rpm for 20 minutes) and filtered (pore
size 0,45 m).
0% 25% 50% 75% 100%
0 15 30 45 60 75 90 105 120
S h a re o f re a l w w o n t o ta l in flu e n t Time (days)
3.4.1 Chemical Measurements
Ammonium
For the NH4-N measurement the Nessler’s method was performed using the
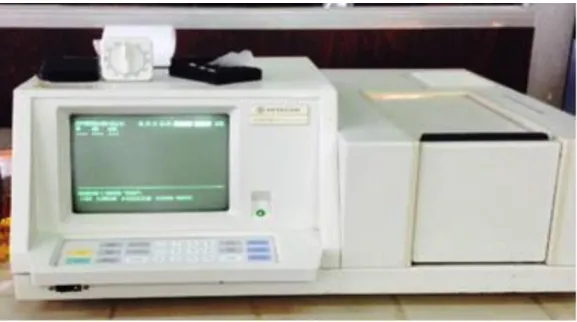
spectrophotometer (HITACHI, mod U-2000) (Fig.11)in a 420nm wavelength
The samples were prepared using 50 ml volumetric flasks, with proper dilution (with
NH4-N concentration between 1-5mgNH4-NH4-NH4-N/L) using distillated water. To these flasks were added 3-4 drops of potassium sodium tartrate and 1 ml of Nessler’s reagent. The reaction between the Nessler’s and the ammonia makes the color transition from transparent to yellow-brownish depending on the concentration of ammonia in the sample.
15-30 minutes after the addition of the Nessler’s reagent, the samples were analyzed in
the spectrophotometer
Each sample were made in triplicates, to assure a more precise measurement.
Figure 10 - Laboratory Spectophotometer (HITACHI, mod U-2000)
Nitrite and Nitrate
The NO2-N and N03-N concentrations, together with other anions of interest, were
measure in an ion chromatographer, using a DIONEX ion-chromatograph (mod IC-90)
(Fig.12) equipped with a DIONEX ION PAC AS14A 4x250 mm column and a DIONEX
September 2017
26
The samples were prepared in volumetric flasks (with 10 and 20 ml) properly diluted
using de-ionized water.
1 ml of sample was manually pumped to the ion-chromatograph with a syringe, and the
analysis took approximately 15minutes.
Figure 11 - Laboratory ion chromatographer DIONEX ion-chromatograph (mod IC-90)
3.4.2 Mass balances
After measurements, it is possible to do mass balances to the Anammox reactor, using
the follow equations:
For Nitrogen removal:
𝑇𝑜𝑡𝑎𝑙 𝐴𝑚𝑚𝑜𝑛𝑖𝑢𝑚 𝑟𝑒𝑚𝑜𝑣𝑎𝑙 = 𝑁𝐻4 − 𝑁 inf − 𝑁𝐻4 − 𝑁 𝑒𝑓𝑓 𝑒𝑞. 14
𝑇𝑜𝑡𝑎𝑙 𝑁𝑖𝑡𝑟𝑖𝑡𝑒 𝑟𝑒𝑚𝑜𝑣𝑎𝑙 = 𝑁02 − 𝑁 inf − 𝑁02 − 𝑁 𝑒𝑓𝑓 𝑒𝑞. 15
𝑇𝑜𝑡𝑎𝑙 𝑁𝑖𝑡𝑟𝑎𝑡𝑒 𝑟𝑒𝑚𝑜𝑣𝑎𝑙 = 𝑁03 − 𝑁 inf − 𝑁03 − 𝑁 𝑒𝑓𝑓 𝑒𝑞. 16
𝑁𝑂2 − 𝑁 𝑟𝑒𝑚𝑜𝑣𝑎𝑙 𝑒𝑓𝑓𝑖𝑐𝑖𝑒𝑛𝑐𝑦(%) =𝑇𝑜𝑡𝑎𝑙 𝑟𝑒𝑚𝑜𝑣𝑒𝑑 𝑁𝑂2 − 𝑁𝑁𝑂2 − 𝑁 𝑖𝑓𝑓 ∗ 100 𝑒𝑞. 18
And Nitrate production (using theoretical equation 13)
𝑇ℎ𝑒𝑜𝑟𝑒𝑡𝑖𝑐𝑎𝑙 𝑝𝑟𝑜𝑑𝑢𝑡𝑖𝑜𝑛 𝑁𝐻4 − 𝑁 𝑐𝑜𝑛𝑠𝑢𝑚𝑝𝑡𝑖𝑜𝑛(𝑚𝑔𝑁𝑂3 − 𝑁)
=𝑁𝐻4 − 𝑁 𝑟𝑒𝑚𝑜𝑣𝑎𝑙 ∗ 𝑉𝑓𝑒𝑑𝑅𝑒𝑎𝑐𝑡𝑜𝑟 𝑉𝑜𝑙𝑢𝑚𝑒 ∗ 0,26 𝑒𝑞. 19
𝑇ℎ𝑒𝑜𝑟𝑒𝑡𝑖𝑐𝑎𝑙 𝑝𝑟𝑜𝑑𝑢𝑡𝑖𝑜𝑛 𝑁𝑂2 − 𝑁 𝑐𝑜𝑛𝑠𝑢𝑚𝑝𝑡𝑖𝑜𝑛(𝑚𝑔𝑁𝑂3 − 𝑁)
=𝑁𝑂2 − 𝑁 𝑟𝑒𝑚𝑜𝑣𝑎𝑙 ∗ 𝑉𝑓𝑒𝑑𝑅𝑒𝑎𝑐𝑡𝑜𝑟 𝑉𝑜𝑙𝑢𝑚𝑒 ∗0,261.32 𝑒𝑞. 20
𝑀𝑒𝑎𝑠𝑢𝑟𝑒𝑑 𝑝𝑟𝑜𝑑𝑢𝑡𝑖𝑜𝑛(𝑚𝑔𝑁𝑂3 − 𝑁) =𝑇𝑜𝑡𝑎𝑙 𝑝𝑟𝑜𝑑𝑢𝑡𝑖𝑜𝑛 𝑁𝑂3 − 𝑁 ∗ 𝑉𝑓𝑒𝑑𝑅𝑒𝑎𝑐𝑡𝑜𝑟 𝑉𝑜𝑙𝑢𝑚𝑒 𝑒𝑞. 21
𝑁𝑅𝐸 =(𝑁𝑂2−𝑁+𝑁𝐻4−𝑁+𝑁𝑂3−𝑁) 𝑖𝑛𝑓−(𝑁𝑂2−𝑁∗𝑁𝐻4−𝑁∗𝑁𝑂3−𝑁)𝑒𝑓𝑓
(𝑁𝑂2−𝑁+𝑁𝐻4−𝑁+𝑁𝑂3−𝑁) 𝑖𝑛𝑓 *100 𝑒𝑞. 22
Nitrogen loading rate (NLR), Nitrogen removal rate (NRR) and Nitrite discharge rate
(NitDR), i.e. the mass of nitrogen loaded, removed and withdrawn as nitrite from reactor
(respectively) per day and per unit of volume, and expressed as mgN L-1d-1, were also
calculated as follows:
𝑁𝐿𝑅 =(𝑁𝑂2− N)𝑖𝑛𝑓1000+ (𝑁𝐻4− N)𝑖𝑛𝑓 ∗ 𝑉𝑚𝑖𝑛 + 𝑉𝑓𝑒𝑑 𝑒𝑞. 23𝑉𝑓𝑒𝑑 ∗ 𝑁𝐶
𝑁𝑖𝑡𝐷𝑅 =(𝑁𝑂2− N)eff
1000 *
𝑉𝑓𝑒𝑑∗𝑁𝐶
𝑉𝑚𝑖𝑛+𝑉𝑓𝑒𝑑 𝑒𝑞. 24
𝑁𝑅𝑅 =(𝑁𝑂2− 𝑁 + 𝑁𝐻4− 𝑁)𝑖𝑛𝑓 + (𝑁𝑂1000 2− 𝑁 + 𝑁𝐻4− 𝑁)𝑒𝑓𝑓∗𝑉𝑚𝑖𝑛 + 𝑉𝑓𝑒𝑑 𝑒𝑞. 25𝑉𝑓𝑒𝑑 ∗ 𝑁𝐶
• N02-Ninf, NH4-Ninf and NO3-Ninf = influent concentrations of NO2-N and NH4-N in
September 2017
28
• N02-Neff, NH4-Neff and NO3-Neff= effluent concentrations of NO2-N, NH4-N andNH3-N in mg/L.
• Vfed = volume fed in each cycle, in ml.
• Vmin = the minimum remaining volume immediately after withdrawing.
• NC= number of cycles per day.
3.4.3 TOC
–
Total organic carbon
Total organic carbon was analyzed using TOC-V CSN (Shimadzu corp.) liquid module
analyzer (Fig.13)
Samples from influent and effluent were prepared using 20 ml and 50 ml volumetric
flasks, with proper dilution (calibration curve ranged between 10 and 200 mgC L-1). The
instrument and separately determined total carbon (TC, i.e. the sum of inorganic and
organic carbon) and inorganic carbon (IC) in each sample;. total organic carbon was
then calculated by the difference between TC and IC:
𝑇𝑂𝐶 = 𝑇𝐶 − 𝐼𝐶 𝑒𝑞. 26
• TOC= Total organic carbon, mg/L
• TC= Total Carbon, mg/l
September 2017
30
3.5 Activity measurements
3.5.1 Solids Analysis
For the solids analysis, samples were taken from the reactor and from the effluent. VSS
analysis was performed every 2-3 weeks, in order not to remove too much biomass from
the reactor, given the low growth rate of Anammox bacteria.
The samples were filtered using a glass filter at vacuum pressure and then placed in a
cup. The cup (previously weighed + empty filter) was after placed in the 105ºC oven, for
at least 1 night.
It was again weighed (dry weight) and placed in the 570ºC oven for 3-4 Hours.
The remaining ashes were then weighed (ashes weight).
The VSS and TSS were determined based on the following relations:
𝑇𝑆𝑆 =𝐷𝑊 − 𝐸𝑊𝑉𝑠𝑎𝑚𝑝𝑙𝑒 ∗ 1000, 𝑖𝑛 𝑔/𝐿 𝑒𝑞. 27
𝑉𝑆𝑆 =𝐷𝑊 − 𝐴𝑊𝑉𝑠𝑎𝑚𝑝𝑙𝑒 ∗ 1000, 𝑖𝑛 𝑔/𝐿 𝑒𝑞. 28
• DW = dry weight, g
• EW = empty weight, g
• AW= ashes weight, g
• Vsample = sample volume, ml
The relation VSS/TSS was also calculated.
For the analysis of the reactor, granules volume measurement was also performed,
using a small volumetric cylinder.
Specific Volume and granules density were determinate by:
𝑆𝑝𝑒𝑐𝑖𝑓𝑖𝑐 𝑣𝑜𝑙𝑢𝑚𝑒 =𝐺𝑟𝑎𝑛𝑢𝑙𝑒𝑠 𝑉𝑜𝑙𝑢𝑚𝑒𝑆𝑎𝑚𝑝𝑙𝑒 𝑣𝑜𝑙𝑢𝑚𝑒 , Lgranules/L 𝑒𝑞. 29
3.5.2 Specific Anammox Activity
SAA was assessed according to the chemical tracking method described by Test were
performed every week directly inside the operating reactor, during the reaction phase of
the working cycle (after the end of the feeding phase).
For the dosage of the anammox substrates, a stock solution containing nitrite and
ammonium at a molar ratio of 1:1 was used. Composition is given in table 3 addition of supplementary inorganic carbon and micronutrients wasn’t needed since they were provided in excess by both synthetic and real wastewater used during the experiment.
The ammonium+nitrite stock solution was spiked into the reactor to achieve a neither
limiting nor inhibiting nitrite concentration in the reactor of 40-60 mgN/L. Then the
stopwatch was started just after the addition, in order to track the sampling times. Mixed
liquor samples were collected at regular time intervals (usually, 5 or 10 minutes)
throughout the duration of the test (30-60 minutes).
The samples were immediately centrifuged, filtered and stored at 4°C for analysis of
nitrite, nitrate and ammonium. The values are shown in table 4.
Table 4 - Kinetics assay solution concentration
Kinetic Assay solution Concentration (mgN/L)
NO2-N (as NaNO2) 2000
NH4-N (as NH4CL) 2000
The linear regression over these data can be used to determine the ammonium and
September 2017
32
The typical N output of this test is shown in figure 13
Figure 13 - Typical N-profiles in a kinetics assay
The Anammox rate is usually expressed as the dinitrogen gas produced, which is
equivalent to the nitrogen removed from the wastewater.
The maximum specific Anammox rate can be calculated by:
𝑞
𝐴𝑛𝑚𝑥,𝑁2=𝑟𝐴𝑛𝑚𝑥,𝑁𝐻4+𝑟𝐴𝑛𝑚𝑥,𝑁02−𝑟𝐴𝑛𝑚𝑥,𝑁𝐻4_𝑁𝐻3𝑋𝑉𝑆𝑆
𝑒𝑞. 31
the Xvss value was determined in the solids analysis.
Other stoichiometric coefficient ratios of interest, such as YNH4_NO2,ANMX and YNH4_NO3,ANMX
can be easily calculated from the removal/production rates using the following
expressions:
𝑌NH4_NO2,ANMX =𝑟𝐴𝑛𝑚𝑥, 𝑁𝐻4 𝑒𝑞. 32𝑟𝐴𝑛𝑚𝑥, 𝑁𝑂2
𝑌NH4_NO3,ANMX = 𝑟𝐴𝑛𝑚𝑥, 𝑁𝐻4_𝑁𝐻3𝑟𝐴𝑛𝑚𝑥, 𝑁𝐻4 𝑒𝑞. 33
0.00 10.00 20.00 30.00 40.00 50.00 60.00 70.00
0 5 10 15 20 25
N
H4
,N
0
2
,N
O
3
mg
N
L
-1
Time (minues)
Typical N-profiles in a Kintetics Assay
4. Results and discussion
4.1 General Aspects
The experimental activity lasted for 132 days, divided in two phases. During the first
phase share of real wastewater fed to the reactor was continuously increased, according
to NRL exponential law described by equation 14, and a second phase with continues
feeding of 100 % real wastewater. The progressive replacement of synthetic influent
started with 10% real:90% synthetic feeding, 100% of real wastewater feeding was
reached on the day 105.
Then a second phase with continuous feeding of 100% real wastewater followed (days
105-132):
• Nitrogen Loading Rate (NLR), Nitrite Discharge Rate (NitDR) and
Nitrogen Removal Rate (NRR);
• NH4-N removal efficiency, NO2-N removal efficiency and Nitrogen
Removal Efficiency (NRE)
• Stoichiometry and Kinetics
• Suspended Solids
• NH4-N and NO2-N removal rates and NO3-N production rates
September 2017
34
4.2 Process Performance
4.2.1 Nitrogen loading rate, Nitrogen removal rate and Nitrite
discharge rate
During the experiment, when necessary, real wastewater influent was integrated with
nitrite or ammonium salts in order to maintain a nitrogen loading rate of 1.5 kgN/m3 with
a NO2-N/NH4-N ratio between 1.20-1.30. We can see in figure 14 that, in both phases,
NRR and NLR curves are generally coincidental, with an average NRR/NLR ratio of
97,02,6%. This difference is explained by ammonium or nitrite accumulation in the reactor. The NitDR was negligible and mostly zero throughout the whole experiment,
indicating a good process performance. On the day 99, 113, 114 and 131 a nitrite
accumulation was observed: this was due to a too high nitrite/ammonium molar ratio in the influent. It is noticeable that this accumulation didn’t affect the process, and nitrite was immediately removed after, when a lower nitrite/ammonium ratio was fed into the
reactor. During phase 2, in fact, chemical correction of influent was not applied, in order
to assess the process response to fluctuating nitrogen load and NO2-N/NH4-N ratio.
Figure 14 - Time course of NLR, NRR and NitDR during the experimental activity
0.000 0.200 0.400 0.600 0.800 1.000 1.200 1.400 1.600 1.800 2.000
0 20 40 60 80 100 120 140
K
g
N
m
-3d
-1
Time
NLR,NRR and NitDR
NLR NRR NitDR
4.2.2 Removal efficiencies
In the figure 15 both nitrite and ammonium removal efficiency throughout the experiment
are depicted, together with overall nitrogen removal efficiency.
Figure 15 - Removal efficiencies
The observed NO2-N removal efficiency was always almost 100% during phase 1, except
in the day 99. During phase 2, the average value was 98,8±0,3%. The observed
ammonium removal efficiency was also calculated, with values of 96,21,7% and 92,210,1%, for phase 1 and phase 2, respectively.
The observed ammonium removal is higher than expected
The overall nitrogen removal efficiency value was 90,23,7%.
In other studies, using SBR’s, Millia, et al. [40]treated a mix of synthetic and pre-treated PN refinery wastewater with a NLR=0,350,01 gN L-1d-1 achieved a NRE of 844 %. Also, Tang, et al. [41] with synthetic influent obtained a nitrogen removal efficiency of 86%
with a NLR= 0,71 gN.L-1d-1. Dosta, et al. [33], also using a SBR ,achieved NRE = 88 %
(with observed NH4-N removal rate of 92 %) when treating pre-treated wastewater from
anaerobic digestion of municipal sewage sludge.
This experiment shows a better performance, this was achieved with a bigger NRL,soft
and progressive share of real wastewater.
0% 10% 20% 30% 40% 50% 60% 70% 80% 90% 100%
0 20 40 60 80 100 120 140
R
emova
l ef
fi
ci
enc
ies
Time ( days)
Removal efficiencies
NH4-N removal efficiency N02-N removal efficiency NRE