Sensorial and physicochemical quality
responses of pears (cv Rocha) to long-term
storage under controlled atmospheres
Andrea C Galvis-S ´anchez, Susana C Fonseca, Alcina MMB Morais
and F Xavier Malcata
∗Escola Superior de Biotecnologia, Universidade Cat ´olica Portuguesa, P-4200-072 Porto, Portugal
Abstract: Pears (cv Rocha) kept under controlled atmospheres (CA) and air were evaluated after long-term storage in long-terms of sensory attributes and physicochemical parameters, namely colour, firmness, polyphenoloxidase (PPO) activity and concentration of hydroxycinnamic compounds. The CA conditions were all combinations of 2 and 4% (v/v) O2with 0.5 and 1.5% (v/v) CO2. Storage under CA conditions
produced a beneficial effect on ‘Rocha’ pears in maintaining their quality and, consequently, in extending their shelf life and acceptability. Clear differences in sensorial attributes, colour parameters and PPO activity were found between CA- and air-stored pears. The effect provided by the CA conditions persisted throughout the time of exposure to the open air. The 2% O2concentration produced a more beneficial effect
than its 4% counterpart on the sensorial and physical characteristics of the pears. The former concentration of O2prevented yellowing and allowed regular softening, hence keeping a high flavour quality. No clear
effects could be associated with CO2 levels. Empirical models were developed that describe the effects
of O2 and CO2 concentrations, as well as time at room temperature on physicochemical parameters
pertaining to ‘Rocha’ pears.
Keywords: Pyrus communis L; sensory quality; colour; firmness; PPO activity; phenolic compounds; regression
analysis
INTRODUCTION
Physical and biochemical responses of harvested fruits and vegetables under stress conditions may induce loss of quality and hence reduce their acceptability to consumers.1 Controlled atmosphere (CA) storage has been successfully employed to extend the shelf-life of pears while retaining their quality (ie firmness and colour).2 However, very little attention has been paid to the fact that the recommended CA conditions should also provide beneficial effects on flavour and taste. During storage, many factors may act as stress agents, thus making fruits vulnerable to quality reduction throughout their shelf-life. In general, the recommended CA conditions for pears are levels of carbon dioxide between 0.5 and 1.5% (v/v), levels of oxygen between 2.0 and 2.5% (v/v) and temperatures between −0.5 and 0◦C.3 Pear response to CA gas composition depends, among
several factors, on cultural practices, storage factors and pear variety.4 – 6
In pears, the incidence of browning has been associ-ated with the concentration of phenolic compounds7,8 and with the activity of the enzyme polyphenoloxidase (PPO).9However, it seems likely that other processes are also involved.10 During senescence, mechanical injury or exposure to stress conditions, membrane weakening may occur, resulting in decompartmen-talisation that in turn leads to the release of PPO molecules, thus promoting the occurrence of enzy-matic reactions.11,12
In recent years, interest has arisen in new pear varieties that can offer wider possibilities of trade, and, concomitantly, respond to consumer demand for fresh products.13‘Rocha’ pear is one such unexplored variety which seems to present good storage potential and unique sensory characteristics.14The optimisation
∗Correspondence to: F Xavier Malcata, Escola Superior de Biotecnologia, Universidade Cat ´olica Portuguesa, Rua Dr. Ant ´onio Bernardino
de Almeida, P-4200-072 Porto, Portugal E-mail: [email protected]
Contract/grant sponsor: INIA, Portugal; contract/grant number: PAMAF 6034
Contract/grant sponsor: ALFA (European Union/Universidad de La Sabana, Bogot ´a, Colombia); contract/grant number: ALR/B7-3011/94.04-5.0130.9
Contract/grant sponsor: Funda ¸c ˜ao para a Ci ˆencia e a Tecnologia (European Union/Portuguese Government); contract/grant number: BD/18392/98
of CA conditions for its conservation, and the study of its quality characteristics have consequently been selected as a research objective.15
The goals of this work were thus (1) to compare the effects of CA and air on the quality attributes of pears (cv Rocha), in an attempt to meet consumer expectations, and (2) to search for an empirical model, that consubstantiates relationships between quality parameters and storage conditions involved in pear quality loss after long-term storage.
EXPERIMENTAL Plant material
Studies were conducted with pears cv Rocha grown in Alcoba¸ca (western Portugal). After harvest, fruits were stored under CA and air conditions according to the experimental design detailed below.
Experimental design
Pears were stored using four distinct CA compositions (ie all possible combinations of 2 and 4% (v/v) O2, with 0.5 and 1.5% (v/v) CO2); storage in air was used as control. The CA compositions were generated via a gas-mixing panel using pure gases (O2, CO2 and N2). The gas mixtures were initially set and maintained continuously, and periodically monitored by gas chromatographic analyses. The storage was performed in Esta¸c˜ao Nacional de Fruticultura Vieira Natividade (Alcoba¸ca, Portugal). Two experimental chambers, each with a capacity of 225 kg, were used for each storage atmosphere. The temperature and relative humidity were initially set and maintained via the refrigeration control system of the chambers; the temperature therein was kept at 0 – 0.5◦C and the relative humidity at 90 – 95%; the error in the target concentration was±0.1%(v/v). After 9 months of storage, a first set of pears was removed and immediately transported to Escola Superior de Biotecnologia (Porto, Portugal); 1 week later, a second set was removed and transported likewise. The first set included the pears stored under 2% O2+ 0.5% CO2 and 2% O2+ 1.5% CO2 (two replicates for each condition), as well as the pears stored in air (control); the second set included the pears stored under 4% O2+ 0.5% CO2 and 4% O2+ 1.5% CO2 (again two replicates for each condition), as well as a second control. Pears were then allowed to ripen in the open air at room temperature (18 – 20◦C), hence simulating the marketing period. The sensory attributes were assessed after 7 days of exposure to the open air. After 1, 6 and 9 days, pears were instrumentally evaluated for colour and firmness. Fruits were then peeled, cut into small pieces and frozen at−20◦C before PPO activity and phenolic compound assays were performed.
Sensory evaluation
Ten panellists were selected based on taste acuity and discriminatory ability, as described by Stevens and Albright.16Tasting was performed in a sensory testing
room with individual booths and controlled lighting (white). Pears from the different storage conditions (devoid of skin) were presented simultaneously on individual coded plates; the samples had been cut into quarters and peeled just before evaluation, so as to avoid unwanted oxidation. Two types of sensorial test took place: a hedonic test and a ranking test.
For the hedonic evaluation, panellists were asked to indicate their scores by marking a 1 – 9 scale (1= dislike extremely, 3 = dislike moderately, 5= limit of acceptability, 7 = like moderately, 9 = like extremely) regarding yellow colour, firmness, sweetness, juiciness and overall quality. The first four are important attributes perceived in pears,17whereas the last one was included because the whole rather than the individual attributes are important for the perception of quality in those fruits. For the ranking test, panellists ranked the samples from the lowest (labelled ‘5’) to the highest (labelled ‘1’) attribute intensity perceived; yellow colour, firmness, sweetness and juiciness were again the attributes evaluated using this test.
Colour assessment
Pear flesh colour was measured with a hand-held tristimulus reflectance colorimeter (model CR-300, Minolta, Mahway, NJ, USA). The skin was removed just prior to assaying, so as to avoid oxidation. Ten pears taken at random were used as replicates for each storage condition and time of ripening. Colour was recorded using a Hunter L∗a∗b∗uniform colour space: L∗ indicates lightness, a∗ indicates chromaticity on a green (−) to red (+) axis and b∗indicates chromaticity on a blue (−) to yellow (+) axis.
Firmness assessment
Pear firmness was measured via a puncture test with a universal testing machine (model 4501, Instron, Canton, MA, USA). The 8 mm-diameter puncture probe was programmed to penetrate 5 mm in a normal direction, at a crosshead speed of 10 mm min−1, using a 100 N load cell. The skin was removed from the test section prior to assaying, and puncturing took place at opposite sides in the equatorial area. Ten pears taken at random were used as replicates for each storage condition and time of ripening. Firmness was expressed as the maximum force to puncture the equatorial surface of a whole skinless pear.
PPO activity assay
A pear crude extract was prepared by homogenising 20 g of frozen pear pulp with 20 ml of 0.2Msodium phosphate buffer (pH 6.5) containing 2% (w/v) polyvinylpolypyrrolidone (PVPP) and 0.25% (v/v) Triton X-100, using an Ultra-Turrax (model T25, IKA Labortechnik, Staufen, Germany) in an external ice bath, for 3 min at 1 min intervals. The homogenate was centrifuged at 4◦C and 16 000× g for 30 min (Sorvall RC-5C centrifuge, Newtown, CT, USA). The
supernatant was then filtered through cheesecloth and its volume was recorded.
For the assay reaction, 300 ml of supernatant was mixed with 2.7 ml of 0.2M catechol solution (used as substrate). The reference cuvette contained only the substrate solution. The rate of increase in absorbance at 420 nm during 1 min (25◦C) was recorded using a UV/VIS spectrophotometer (model UV-260, Shimadzu, Tokyo, Japan). Only the linear part of the absorbance vs time curve was used to estimate the activity of the enzyme (U g−1min−1). One unit of enzymatic activity (U) was defined as a change of 0.001 units of absorbance under the aforementioned assay conditions. Triplicate analytical assays were performed on each of three pear extract replicates, obtained for every storage condition and time at room temperature.
Phenolic compound assay
Phenolic compounds were quantified according to the method of Oszmianski et al.18 Pear extracts were prepared by homogenising frozen pear pulp samples with 1% (w/w) ascorbic acid and methanol for 3 min, using an Ultra-Turrax in an external ice bath. The homogenate was filtered through cheesecloth, collected and adjusted to pH 7.0 using 5M NaOH.
The acidic and neutral fractions were resolved in the filtrate using a preconditioned C-18 Sep-Pack cartridge (Millipore Waters, Billerica, MA, USA). Chlorogenic acid was identified in the acidic fraction; after extraction with a solution of acetonitrile (16% v/v), (+)-catechin was identified in the neutral fraction. Flavonols and anthocyanin polymers were eluted using ethyl acetate and methanol, respectively.
Each fraction was then measured using the Folin – Ciocalteau reagent.19 Aliquots (1 ml) of each pear fraction sample were mixed with 5 ml of diluted Folin – Ciocalteau reagent (1 ml plus 9 ml of deionised water). After addition of the reagent, 4 ml of 0.075 g ml−1 sodium carbonate solution was added. After 1 h at 30◦C and 1 h at 0◦C, the absorbance of the solution was measured at 760 nm. Chlorogenic acid was used to obtain a standard curve (in the range 7.0 – 50.0 mg l−1), from which the phenolic concentration was calculated directly. Phenolic compounds were expressed as mg chlorogenic acid per 100 g fresh weight (FW).
Statistical analysis
There was a 1 week interval between sampling (which was unavoidable as it was impossible to analyse all samples simultaneously), so the results from the first week (set 1) and from the second week (set 2), both involving the controls, were previously compared using a paired t-test (assuming equal variances). No statistically significant differences at the 5% significance level were detected between the two controls for either the instrumental measurements or the hedonic test. Hence it was concluded that no blocking was required, so all storage conditions could
be directly compared with one another despite the 1 week interval.
The data from the hedonic test were subjected to analysis of variance (ANOVA) at a significance level of 5% to evaluate the influence of the storage conditions on the sensorial attributes colour, firmness, sweetness, juiciness and overall quality. Duncan’s multiple range test was employed to detect significant differences.
A non-parametric test (Friedman’s test) was used to analyse the data produced in the ranking test. The LSD rank was calculated to determine which samples were significantly different.20
The physicochemical determinations were also subjected to ANOVA to evaluate the influence of the same storage conditions.
The influences of time in the open air at room temperature (X1) and concentrations of oxygen (X2) and carbon dioxide (X3) of the various storage conditions were empirically modelled according to a second-order polynomial, using X1, X2 and X3 as regressors and Hunter’s L∗ (Y1), a∗ (Y2) and b∗ (Y3) values, firmness (Y4) and PPO activity (Y5) as dependent variables:
Y= b0+ b1X1+ b2X2+ b3X3+ b11X12+ b12X1X2 + b13X1X3+ b22X22+ b23X2X3+ b33X32 (1) where b0 is the intercept, b1, b2 and b3 are linear parameters, b11, b22and b33are quadratic parameters, and b12, b13 and b23 are interaction parameters. The experimental data were fitted to by eqn (1) via multiple linear regression, using the software SPSS (v 9.0, SPSS, Chicago, IL, USA), with F≥ 0.005 as criterion of significance for the adjustable parameters. Experimental data with replicates more than two standard deviations apart from their average were rejected as outliers.
RESULTS AND DISCUSSION
Influence of storage conditions on sensory quality parameters
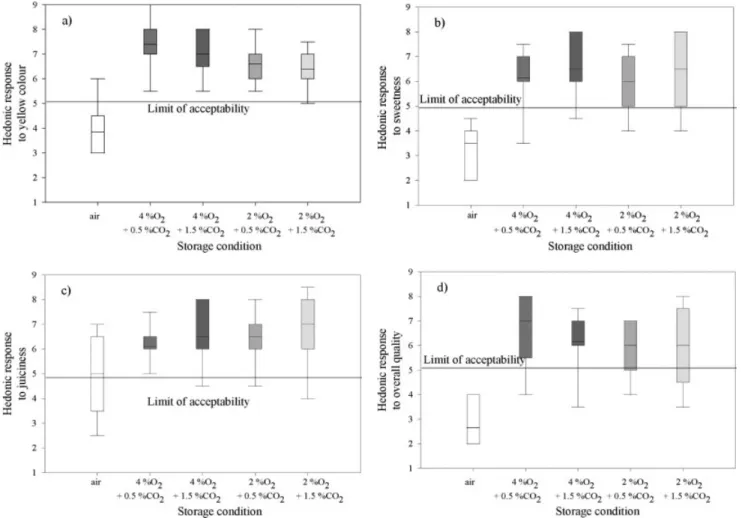
The hedonic evaluation indicated that pears stored in air were less preferred than pears stored under CA conditions in terms of colour, sweetness, juiciness and overall quality (see Figs 1(a) – 1(d), respectively). However, firmness was not significantly different between the various storage conditions. Panellists rated differently with regard to colour and firmness, as often found owing to personal preferences.21 By 7 days, pears stored in air were already below the threshold of acceptability in terms of colour, sweetness and overall quality (Figs 1(a), 1(b) and 1(d)), whereas those stored under CA conditions were considerably above that threshold. The hedonic test did not reveal clear differences between CA conditions. The yellow colour, sweetness and juiciness contributed actively to the overall quality of pears: colour, sweetness and juiciness were highly correlated with overall appreciation (R2= 0.95, 0.97 and 0.81, respectively).
Figure 1. Hedonic evaluation of ‘Rocha’ pears, stored under various conditions for 9 months, after exposure for 7 days to the open air at room
temperature, in terms of (a) yellow colour, (b) sweetness, (c) juiciness and (d) overall quality (the box represents the interquartile range, which contains 50% of the values, the whiskers represent the highest and lowest values, and the full line represents the median).
The ranking test revealed that the sensory panel perceived pears stored under 2% O2differently relative to pears stored in air in terms of colour, firmness and sweetness. Fruits stored under 2% O2 were scored as less yellow, more sweet and less firm than pears stored in air. No differences were detected between fruits stored at both CO2levels under 2% O2. Finally, no differences in terms of juiciness were found among all storage conditions tested. The panellists did not perceive differences in the intensity of any of the attributes evaluated between pears stored under 4% O2 versus the control. Li and Hansen22reported that ‘Anjou’ pears tended to be mealy and lacked flavour when they were left to ripen after long-term storage in air, in comparison with those stored under CA conditions.
Influence of storage conditions on physical quality parameters
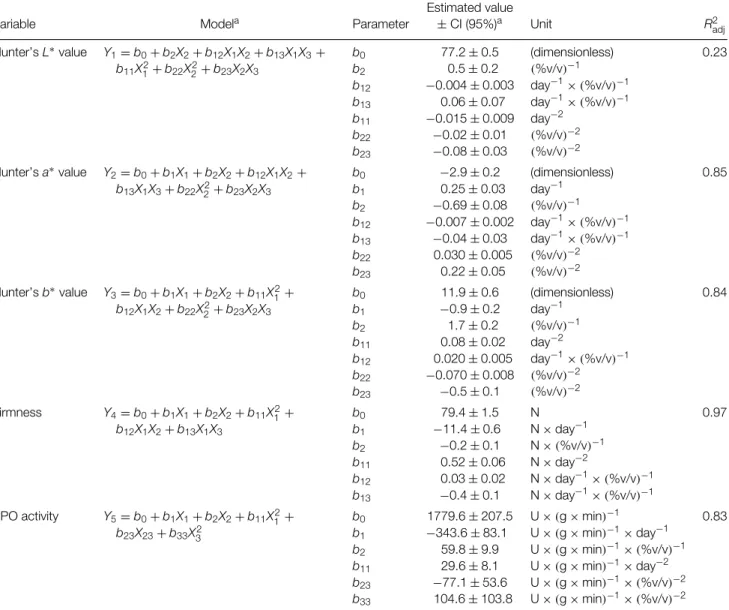
Both the nature of the storage conditions and the time of exposure to the open air affected the colour and firmness of ‘Rocha’ pears. Our regression analysis indicated that Hunter’s L∗ value was positively influenced by the concentration of oxygen (b2) and by the interaction between the time of exposure to the open air at room temperature and the concentration of CO2 (b13) and was negatively influenced by the
square of the time of exposure to the open air at room temperature (b11), by the square of the concentration of O2 (b22), by the interaction between the time at room temperature and the concentration of O2 (b12) and by the interaction between the concentrations of O2 and CO2 (b23) (Table 1, Fig 2). After 9 months of storage, the L∗ value in ‘Rocha’ pears ranged from 76.3± 1.2 to 78.6 ± 0.9 (average ± standard deviation). Pears stored under all CA conditions yielded similar levels of lightness (L∗) by 1 day of exposure to the open air at room temperature (Fig 2). From the 1st to the 6th day at room temperature, the lightness decreased for pears stored in air: a lower L∗ value was found than that recorded for fruits stored under 2% O2. By 6 days, pears stored under 4% O2+ 0.5% CO2 yielded essentially the same lightness as fruits stored under 2% O2; however, pears stored under 4% O2+ 1.5% CO2 exhibited a lower L∗ value than those stored under 2% O2. By 9 days, pears stored under air and 2% O2 presented reductions in lightness.
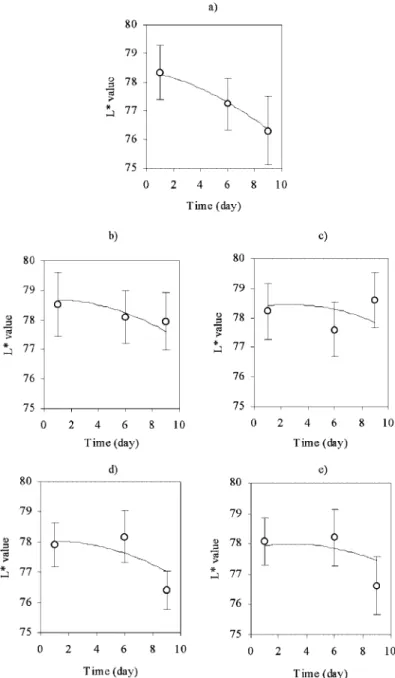
The experimental values of Hunter’s a∗ ranged between −4.3 ± 0.4 and −1.8 ± 0.4 (average ± standard deviation). During the time of exposure to the open air, the a∗ value increased in all pears, regard-less of storage condition (Fig 3); such an increase
Table 1. Second-order polynomial model (with estimated values of significant parameters± confidence intervals, CI, and adjusted coefficient of
determination, R2
adj) for colour parameters L∗, a∗and b∗, firmness and PPO activity of ‘Rocha’ pears, as a function of the relevant independent
variables
Variable Modela Parameter
Estimated value
± CI (95%)a Unit R2
adj
Hunter’s L∗value Y1= b0+ b2X2+ b12X1X2+ b13X1X3+ b0 77.2± 0.5 (dimensionless) 0.23
b11X12+ b22X22+ b23X2X3 b2 0.5± 0.2 (%v/v)−1 b12 −0.004 ± 0.003 day−1× (%v/v)−1 b13 0.06± 0.07 day−1× (%v/v)−1 b11 −0.015 ± 0.009 day−2 b22 −0.02 ± 0.01 (%v/v)−2 b23 −0.08 ± 0.03 (%v/v)−2
Hunter’s a∗value Y2= b0+ b1X1+ b2X2+ b12X1X2+ b0 −2.9 ± 0.2 (dimensionless) 0.85
b13X1X3+ b22X22+ b23X2X3 b1 0.25± 0.03 day−1 b2 −0.69 ± 0.08 (%v/v)−1 b12 −0.007 ± 0.002 day−1× (%v/v)−1 b13 −0.04 ± 0.03 day−1× (%v/v)−1 b22 0.030± 0.005 (%v/v)−2 b23 0.22± 0.05 (%v/v)−2 Hunter’s b∗value Y3= b0+ b1X1+ b2X2+ b11X2 1+ b0 11.9± 0.6 (dimensionless) 0.84 b12X1X2+ b22X22+ b23X2X3 b1 −0.9 ± 0.2 day−1 b2 1.7± 0.2 (%v/v)−1 b11 0.08± 0.02 day−2 b12 0.020± 0.005 day−1× (%v/v)−1 b22 −0.070 ± 0.008 (%v/v)−2 b23 −0.5 ± 0.1 (%v/v)−2 Firmness Y4= b0+ b1X1+ b2X2+ b11X2 1+ b0 79.4± 1.5 N 0.97 b12X1X2+ b13X1X3 b1 −11.4 ± 0.6 N× day−1 b2 −0.2 ± 0.1 N× (%v/v)−1 b11 0.52± 0.06 N× day−2 b12 0.03± 0.02 N× day−1× (%v/v)−1 b13 −0.4 ± 0.1 N× day−1× (%v/v)−1
PPO activity Y5= b0+ b1X1+ b2X2+ b11X21+ b0 1779.6± 207.5 U× (g × min)−1 0.83
b23X23+ b33X32 b1 −343.6 ± 83.1 U× (g × min)−1× day−1
b2 59.8± 9.9 U× (g × min)−1× (%v/v)−1
b11 29.6± 8.1 U× (g × min)−1× day−2
b23 −77.1 ± 53.6 U× (g × min)−1× (%v/v)−2
b33 104.6± 103.8 U× (g × min)−1× (%v/v)−2
aIncluding only the parameters that are statistically significant at the 5% significance level.
was confirmed by the positive value of b1 in eqn 1 (Table 1). In addition, the a∗ value was negatively influenced by the concentration of O2 (b2), by its interaction with the time in the open air at room temperature (b12) and by the interaction between the time of exposure to the open air and the concentration of CO2(b13). Conversely, the a∗ value was positively influenced by the square of the O2concentration and by the interaction between the concentrations of O2 and CO2. By 1 day of exposure to the open air at room temperature, pears stored in air and under the two CA conditions with 0.5% CO2 presented lower a∗ values than those stored under 1.5% CO2(Fig 3). By 6 days of exposure to the open air, pears stored in air had the lowest a∗ value and those stored under 2% O2+ 1.5% CO2 had the highest one. By 9 days, pears stored in air again showed the lowest a∗ value and those stored under 2% O2the highest one.
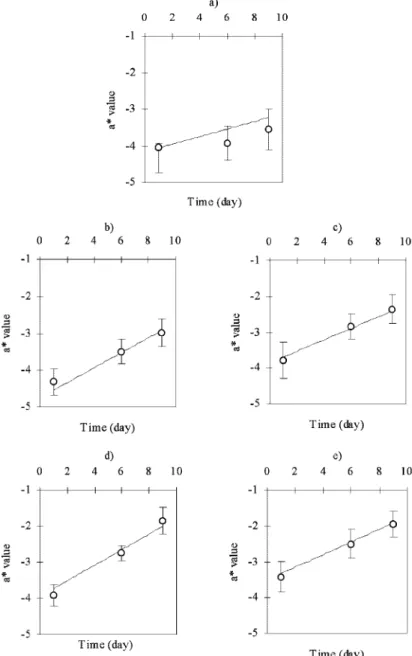
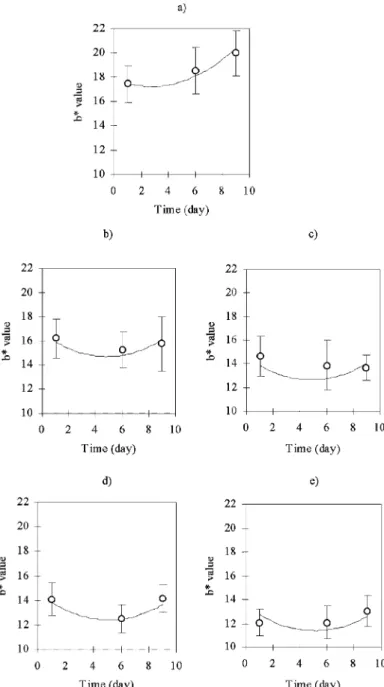
The experimental values of Hunter’s b∗ ranged from 12.1± 1.1 to 20.0 ± 1.9 (average ± standard
deviation). When exposed to air at room temperature, the value of b∗ tended to decrease for pears stored under almost all conditions; however, a slight increase was observed by 9 days of exposure to the open air at room temperature (Fig 4). The decrease in the b∗value as time at room temperature elapsed and the increase observed afterwards are apparent in the negative value of b1and the positive value of b11(Table 1). Hunter’s b∗ value underwent an increase with concentration of O2during storage, as confirmed by the positive value of coefficient b2, as well as by the interaction between the time of exposure to the open air at room temperature and the concentration of O2. A negative effect was ascribed to the square of the O2 concentration and to the interaction between the concentrations of O2 and CO2. After 9 months of storage and by 1 day of exposure to the open air at room temperature, pears stored in air presented the highest b∗ value, and those stored under 2% O2+ 1.5% CO2 the lowest one (Fig 4). By 6 days at room temperature, pears
Figure 2. Hunter’s L∗value of ‘Rocha’ pears, throughout time of exposure to the open air at room temperature, following 9 months of storage under (a) air, (b) 4% O2+ 0.5% CO2, (c) 4% O2+ 1.5% CO2, (d) 2% O2+ 0.5% CO2and (e) 2% O2+ 1.5% CO2(points represent average
experimental values, bars represent standard deviation and lines represent fitted model — eqn (1), Table 1).
stored in air still exhibited the highest b∗ value and those stored under both CA conditions at 2% O2 the lowest one. Storage in air produced the highest b∗ value in fruits by 9 days and the lowest in fruits stored under both CA conditions at 2% O2 and 4% O2+ 1.5% CO2.
Colour differences detected by the sensory panel could be related to changes in Hunter’s a∗ and b∗ values. The instrumental colour parameters, ie Hunter’s a∗ and b∗, were positively correlated with the sensory assessment of colour (R2= 0.99 and 0.96, respectively). Drake2reported significant colour differences in the flesh of ‘Bosc’ pears after 6 months of storage, under CA conditions with low (1% (v/v)) and high (3% (v/v)) CO2concentrations and the same level (1.5% (v/v)) of O2. Pears stored under 3% CO2were less yellow and presented a lower b∗ value than those stored under 1% CO2; however, as time in the open
air elapsed, the differences became negligible. Colour degradation in pears was reduced during storage under low O2 and CO2 levels, and the changes observed afterwards were due mainly to cultivar factors.23
Information available in the literature pertaining to the effects of CA application on the colour (in overall terms, as well as separately via its L∗, a∗ and b∗ components) of the pulp of pears is scarce. Our sensorial results indicated that pears stored in air were less preferred and simultaneously more yellow than those stored under CA conditions. The instrumental evaluation of air-stored samples indicated lower L∗ values, lower a∗ values and higher b∗ values than for samples stored under CA conditions, which corresponded to more preferred and less yellow samples in sensory terms. These observations, coupled with information presented below that air-stored samples possessed higher PPO activity, allow one to
Figure 3. Hunter’s a∗value of ‘Rocha’ pears, throughout time of exposure to the open air at room temperature, following 9 months of storage under (a) air, (b) 4% O2+ 0.5% CO2, (c) 4% O2+ 1.5% CO2, (d) 2% O2+ 0.5% CO2and (e) 2% O2+ 1.5% CO2(points represent average experimental
values, bars represent standard deviation and lines represent fitted model — eqn (1), Table 1).
hypothesise that air-stored samples were in a more advanced stage of ripening, hence leading to a shorter storage life.
The experimental values of firmness of ‘Rocha’ pears after 9 months of storage ranged from 13.6± 3.9 to 70.7± 5.6 N (average ± standard deviation). Firmness decreased throughout time of exposure to the open air at room temperature (Fig 5); such a decrease was confirmed by the negative value of parameter b1 (Table 1). The regression analysis indicated that firmness changes were positively affected by the square of the time of exposure to the open air at room temperature (b11), as well as by the interaction between the time of exposure to the open air and the concentration of O2 (b12). Conversely, firmness was negatively influenced by the concentration of O2 (b2) and by the interaction between the time of exposure to the open air at room temperature and the
concentration of CO2 (b13). Firmness of pears was much more influenced by the time of exposure to the open air than by the storage conditions (Fig 5).
The lack of extensive CA effects on the firmness of this pear cultivar is somewhat unique. Recall that, despite the metabolic processes of fruits being slowed down under refrigerated and CA conditions, the fruits use their reserves to maintain cellular functions. One piece of evidence for the continuation of cellular metabolism is the increase in water – soluble pectic material and galacturonic acid,24 which are products of the dissolution of the cell wall; a consequence of the dissolution of the cell wall components and of the increase in water – soluble pectin components is the softening of the fruit. The small effect actually observed on the firmness of ‘Rocha’ pears by the various storage conditions tested may be disguised by the major effect of time in the open air — in fact, when
Figure 4. Hunter’s b∗value of ‘Rocha’ pears, throughout time of exposure to the open air at room temperature, following 9 months of storage under (a) air, (b) 4% O2+ 0.5% CO2, (c) 4% O2+ 1.5% CO2, (d) 2% O2+ 0.5% CO2and (e) 2% O2+ 1.5% CO2(points represent average
experimental values, bars represent standard deviation and lines represent fitted model — eqn (1), Table 1).
removed after a long-term storage, they will rapidly soften.
After 1 day of exposure to the open air, firmness was lower for pears stored in air and under 2% O2+ 0.5% CO2; however, after 6 days, no differences were detected between pears stored in air and under any CA condition (Fig 5). By 9 days of exposure to the open air, pears stored in air were firmer than those stored under 2% O2+ 1.5% CO2. Similar results were obtained by Li and Hansen,22who reported that pears stored in air were firmer than those stored under CA conditions.
Influence of storage conditions on chemical quality parameters
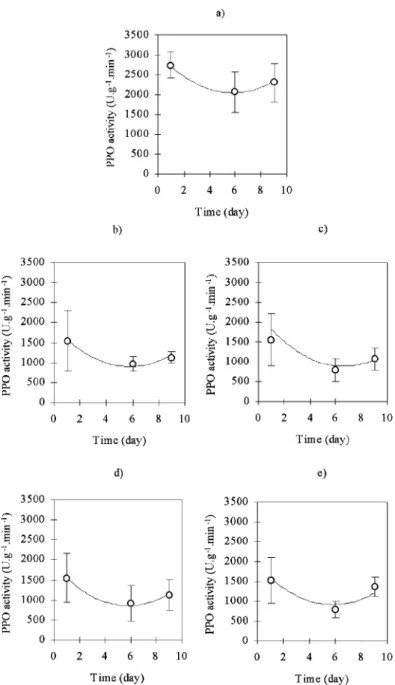
After 9 months of storage, the PPO activity ranged between 789± 214 and 2880 ± 331 U g−1min−1
(average± standard deviation). Pears stored in air pre-sented higher PPO activity than those stored under CA conditions (Fig 6). During the time of exposure to the open air at room temperature, a decrease in the PPO activity was observed for pears from all storage condi-tions, followed by an eventual levelling-off; this pattern was confirmed by the negative value of b1and the pos-itive value of b11 (Table 1). The enzymatic activity was positively influenced by the concentration of O2 (b2) and by the square of the concentration of CO2 (b33). The regression analysis indicated that the PPO activity was negatively influenced by the interaction between the concentrations of O2and CO2(b23). The lower PPO activity found in pears stored under CA conditions compared well with that of pears stored in air; this could be the result of the inhibition caused by the low O2 and high CO2 concentrations, yet a clear
Figure 5. Firmness of ‘Rocha’ pears, throughout time of exposure to the open air at room temperature, following 9 months of storage under (a) air,
(b) 4% O2+ 0.5% CO2, (c) 4% O2+ 1.5% CO2, (d) 2% O2+ 0.5% CO2and (e) 2% O2+ 1.5% CO2(points represent average experimental values,
bars represent standard deviation and lines represent fitted model— eqn (1), Table 1).
relationship could not be unfolded between PPO activ-ity in pears and its dependence on CA conditions.9,12 PPO activity in apples also decreased after storage under CA conditions; such a reduction could be the result of a decline in the concentration of such acti-vators as fatty or organic acids, or of the reduction of phenolic substrate synthesis.25
With respect to the composition of phenols in the pulp of ‘Rocha’ pears, the acidic fraction accounted for ca 90% of the total phenolic content (Table 2; data on the neutral fraction are not reported because of lack of sensitivity of the assay employed). This fraction comprised all the hydroxycinnamic acid derivatives (mainly chlorogenic acid), which are the most prominent phenolic compounds present in the pulp of pears;8,13,26 in this case the range was 13.9 – 21.0 mg chlorogenic acid per 100 g FW.
The contents of catechins and flavonols are not reported since their low concentration did not allow an accurate determination by this method. The hydroxycinnamic acids, together with flavan-3-ols, have been claimed to be good substrates for PPO.27 After 9 months of storage and 1 day of exposure to the open air at room temperature, a higher level of the acidic fraction was observed in pears stored under the two conditions with 2% O2than in those stored under 4% O2+ 0.5% CO2 (Table 2). After 6 days of exposure to the open air at room temperature, a higher concentration of this fraction was recorded in pears stored under 2% O2+ 0.5% CO2 than in those stored in air and under 4% O2+ 0.5% CO2.
A poor correlation was found between the concentration of hydroxycinnamic compounds and
Figure 6. Polyphenol oxidase (PPO) activity of ‘Rocha’ pears, throughout time of exposure to the open air at room temperature, following 9 months
of storage under (a) air, (b) 4% O2+ 0.5% CO2, (c) 4% O2+ 1.5% CO2, (d) 2% O2+ 0.5% CO2and (e) 2% O2+ 1.5% CO2(points represent
average experimental values, bars represent standard deviation and lines represent fitted model — eqn (1), Table 1).
Table 2. Acidic fraction content (mg per 100 g FW)aof ‘Rocha’ pear
after exposure to the open air at room temperature following 9 months of storage
Time in open air (days)
Storage condition 1 6 Air 18.9 ab 15.4 b 4% O2+ 0.5% CO2 14.0 b 15.8 b 4% O2+ 1.5% CO2 17.7 ab 17.0 ab 2% O2+ 0.5% CO2 19.3 a 19.4 a 2% O2+ 1.5% CO2 21.0 a 16.2 b
aMeans separation within columns by Duncan’s multiple range test
(P= 0.05); significantly different means are followed, by different letters.
the PPO activity in pears stored in air and under CA conditions. On the other hand, a moderate correlation
could be established between Hunter’s a∗and b∗values and PPO activity (R2= 0.4 and 0.5 respectively).
CONCLUSIONS
CA-stored pears were preferred over air-stored pears in terms of their sensory parameters, ie colour, sweetness, juiciness and overall quality. Even after 9 months, CA-stored pears were above the limit of acceptability, unlike those stored in air. The preference of the panel was in the direction of less yellow, sweeter and less firm pears.
Clear differences in colour parameters were detected between pears stored in air and under CA conditions by 9 months of storage. The effect provided by the CA conditions persisted throughout the time of exposure to the open air at room temperature. Pears stored
under CA conditions presented higher a∗ values and lower b∗values than those stored in air.
A small effect of the CA conditions on firmness, when compared with the influence of time of exposure to the open air at room temperature, was detected after 9 months of storage. Our results showed that both sensory firmness and instrumental firmness were lower for pears stored under CA conditions than for those stored in air. Furthermore, this attribute was not perceived equally in terms of preference by the sensory panel. Therefore, future research should attempt to clarify the influence of CA storage on pear firmness.
PPO activity was higher for air-stored pears than for CA-stored ones. An acceptable relationship was found between PPO activity and colour parameters a∗ and b∗, but no relationship was ascertained regarding phenolic content.
ACKNOWLEDGEMENTS
This research was partially funded by project PAMAF 6034 (INIA, Portugal). AC Galvis-S´anchez acknowl-edges personal financial support from the ALFA pro-gramme, via fellowship ALR/B7-3011/94.04-5.0130.9 (European Union/Universidad de La Sabana, Bogot´a, Colombia), and from Funda¸c˜ao para a Ciˆencia e a Tecnologia, via fellowship BD/18392/98 (European Union/Portuguese Government).
REFERENCES
1 Shewfelt RL and del Rosario BA, The role of lipid peroxidation in storage disorders of fresh fruits and vegetables. HortSci
35:575–579 (2000).
2 Drake SR, Quality of ‘Bosc’ pears as influenced by elevated carbon dioxide storage. J Food Qual 22:417–425 (1999). 3 Richardson DG and Kupferman E, Controlled atmosphere of
pears. Proc CA’97: Apples and Pears, pp. 31–35 (1997). 4 Luton MT and Holland DA, The effect of preharvest factors on
the quality of stored Conference pears. I. Effects of orchard factors. J Hort Sci 61:23–32 (1986).
5 Recasens I, Ganau D, Graell J, Larrigaudiere C and Lopez L, Physiological and quality responses of ‘Conference’ pears to reduced levels of O2under controlled atmosphere storage
conditions. Proc CA’97: Apples and Pears, pp 258–263 (1997). 6 Lammertyn J, Aerts M, Verlinden BE, Schotsmans W and Nicola¨ı BM, Logistic regression analysis of factors influencing core breakdown in ‘Conference’ pears. Postharv Biol Technol
20:25–37 (2000).
7 Saquet AA, Streif J and Bangerth F, Changes in ATP, ADP and pyridine nucleotide levels related to the incidence of physiological disorders in ‘Conference’ pears and ‘Jonagold’ apples during controlled atmosphere storage. J Hort Sci
Biotechnol 75:243–249 (2000).
8 Blankenship SM and Richardson DG, Changes in phenolic acids and internal ethylene during long-term cold storage of pear. J Am Soc Hort Sci 110:336–339 (1985).
9 Veltman RH, Larrigaudiere C, Wichers HJ, van Schaik ACR, van der Plas LHW and Oosterhaven J, PPO activity and polyphenol content are not limiting factors during brown core development in pears (Pyrus communis L. cv. Conference). J
Plant Physiol 154:697–702 (1999).
10 Pinto E, Lentheric I, Vendrell M and Larrigaudiere C, Role of fermentative and antioxidant metabolism in the induction of core browning in controlled-atmosphere stored pears. J Sci
Food Agric 81:364–370 (2001).
11 Spanos GA and Wrolstad RE, Phenolics of apple, pear and white grape juices, and their changes with processing and storage— a review. J Agric Food Chem 40:1478–1487 (1992). 12 Larrigaudiere C, Lentheric I and Vendrell M, Relationship between enzymatic browning and internal disorders in controlled-atmosphere stored pears. J Sci Food Agric
78:232–236 (1998).
13 Galvis-S´anchez AC, Gil-Izquierdo A and Gil MI, Comparative study of six pear cultivars in terms of their phenolic content, vitamin C and antioxidant capacity. J Sci Food Agric
83:995–1003 (2003).
14 Alexandre J, Soares J and Silva A, A pera Rocha, in O Livro da
Pera Rocha, Ed by Associa¸c˜ao Nacional de Produtores de Pera
Rocha Cadaval, pp 35–36 (2001).
15 Galvis-S´anchez AC and Morais AMMB, Effects of controlled atmosphere (CA) storage on pectinmethylesterase (PME) activity and texture of ‘Rocha’ pears. J Sci Food Agric
82:143–145 (2002).
16 Stevens MA and Albright M, An approach to sensory evaluation of horticultural commodities. HortSci 15:48–50 (1980). 17 Kappel F, Fisher-Fleming R and Hogue EJ, Ideal pear sensory
attributes and fruit characteristics. HortSci 30:988–993 (1995).
18 Oszmianski J, Ramos T and Bourzeix M, Fractionation of phenolic compounds in red wine. Am J Enol Vitic 39:259–262 (1988).
19 Folin D and Ciocalteau V, On tyrosine and tryptophane determinations in proteins. J Biol Chem 73:627–650 (1927). 20 Meilgaard M, Civille GV and Carr BT, Sensory Evaluation
Techniques. CRC Press, Boca Raton, FL (1987).
21 Prescott J and Bell G, Cross-cultural determinants of food acceptability: recent research on sensory perceptions and preferences. Trends Food Sci Technol 6:201–205 (1995). 22 Li PH and Hansen E, Effects of modified atmosphere storage
on organic acid and protein metabolism of pears. Proc Am Soc
Hort Sci 85:100–111 (1964).
23 Amiot MJ, Tacchini M, Aubert SY and Oleszek W, Influence of cultivar, maturity stage, and storage conditions on phenolic composition and enzymatic browning of pear fruits. J Agric
Food Chem 43:1132–1137 (1995).
24 Ben-Arie R, Sonego L and Frenkel C, Changes in pectic substances in ripening pears. J Am Soc Hort Sci 104:500–505 (1979).
25 Barret DM, Lee CY and Liu FW, Changes in the activity and subcellular distribution of PPO in ‘Delicious’ apples during controlled atmosphere storage. J Food Biochem 15:185–199 (1991).
26 Escarpa A and Gonz´alez MC, Total extractable phenolic chromatographic index: an overview of the phenolic class contents from different sources of foods. Eur Food Res Technol
212:439–444 (2001).
27 Amiot MJ, Tacchini M, Aubert S and Nicolas J, Phenolic composition and browning susceptibility of various apple cultivars at maturity. J Food Sci 57:958–962 (1992).