Universidade de Lisboa
FACULDADE DE CIÊNCIAS
DEPARTAMENTO DE BIOLOGIA VEGETALProteomics study of the effect of heavy metals - induced stress in
transgenic tobacco plants, with different expression levels of
trehalose-6-phosphate synthase
.Luis Filipe Pinheiro Domingues
Master in Biologia Celular e Biotecnologia
2
Universidade de Lisboa
FACULDADE DE CIÊNCIAS
EPARTAMENTO DE BIOLOGIA VEGETAL
Proteomics study of the effect of heavy metals - induced
stress in transgenic tobacco plants, with different
expression levels of trehalose-6-phosphate synthase
Luis Filipe Pinheiro Domingues
Master in Biologia Celular e Biotecnologia
Thesis oriented by Professor Jorge Silva and André Almeida PhD
3 Do not hesitate to leap in the abyss because is only when you fall that you learn
4
Acknowledgements
First of all, I would like to thank Professor Ana Varela Coelho for giving me the
opportunity to work in the Mass Spectrometry lab and in this particular subject of
research. I also thank André Almeida for the support and guidance during the time I
was working in this project.
To the project PTDC/AGR-AAM/102821/2008 - Plant responses to trace element
toxicity: cellular mechanisms for detoxification and tolerance, in the person of Miguel
Mourato and Luisa Louro, for the opportunity of participate in it.
And to the team who transformed the Tobacco plants used in this work, namely André
Almeida, Susana Araujo, Dulce Santos e Pedro Fevereiro among others.
I want also to thank my parents and my brother for all the unconditional support
through all my life
To Sofia Trindade who always supported me and talked my ear off anytime I needed. A
sincerely thank you.
To Beta, Renata and Cat, for all the support and quick tips in the lab. Above all know
that you became friends rather than co-workers.
To Rita Laires and Joana Martins, my fellow MSc student for hear my whining when the
something went wrong
5
Abstract
Presently, heavy metal contamination is an important pollution problem in world
agriculture. The specific issues concerning heavy metal, in farming issues, are mainly
due to their accumulation in the food chain with direct consequences to the consumer
health. Cadmium (Cd), particularly, is one of the most challenging pollutants, due to its
high water solubility, mobility, persistence and toxicity, even in low concentrations.
Trehalose is a sugar that acts as an osmoprotector, and has the capacity to stabilize
membranes and proteins during desiccation, heat and osmotic stress.
Trehalose-6-phosphate synthase, one of the enzymes of the biosynthetic pathway has been the
major target for genetic engineering, as it is considered to be the decisive factor in the
trehalose biosynthesis.
The aim of the present work is to study the effects of a Cd exposure of two transgenic
Nicotiana tbacum lines (B5H and B1F), which had already shown enhanced tolerance to abiotic stress, in comparison to wild type. We used a proteomics approach, namely
2-DE-DIGE.and identification of differentially expressed proteins by mass
spectrometry.
In this work we could identify fifteen different proteins, such as carbonic anhydrase,
RuBisCO and phosphoglycerate kinase, with differential expression. Results
demonstrate that both B1F and B5H present an enhanced tolerance to cadmium
induced stress, showing signals which denote that they may not be as affected as Wt
plants by the concentration of cadmium to which they were subjected. The
physiological significance of the expression profiles obtained is discussed. Genetic
engineering with the trehalose-6-phosphate synthase gene seems therefore to be of use in obtaining transgenic plants of commercial use for possible growth in
contaminated soils or used in phytoremediation.
Keywords: Nicotiana tbacum; Trehalose-6-phosphate synthase; AtTPS1; 2-DE; DIGE;
6
Resumo alargado
A contaminação dos solos por metais pesados é um importante problema ambiental.
Um dos principais problemas da contaminação de solos agrícolas prende-se com a
acumulação destes metais na cadeia alimentar com consequências directas, graves, na
saúde do consumidor. O Cádmio (Cd), em particular, é um dos poluentes mais
problemáticos, devido à sua elevada solubilidade em água, mobilidade, persistência e
toxicidade, mesmo em baixas concentrações.
A trealose é um açúcar que actua como osmoprotector e tem a capacidade de
estabilizar membranas e proteínas durante stresses provocados por dissecação,
temperatura, e stress osmótico. A Trealose-6-fosfato-sintase, uma das enzimas da via
biossintética da trehalose tem sido o alvo principal para a engenharia genética, uma
vez que é considerado o factor determinante na biossíntese de trealose..
Com o presente trabalho pretende-se, utilizando uma abordagem proteómica,
baseada em 2-DE-DIGE seguida de identificação de proteínas por espectrometria de
massa, estudar os efeitos da uma exposição a Cd em duas linhas de Nicotiana tbacum
(B5H e B1F), que já tinham demonstrado tolerância aumentada a stress abiótico
induzido por metais pesados, em comparação com plantas Wild type.
Neste trabalho foi possível identificar 15 proteínas diferentes, tais como a anhidrase
carbónica, a RuBisCO e a fosfoglicerato kinase, com expressão diferencial. Os
resultados demonstram que tanto as plantas B1F como as B5H apresentam uma
tolerância aumentada ao stresse induzido por cádmio., mostrando sinais que denotam
que eles podem não ser tão afetado quanto plantas Wt pela concentração de cádmio a
que foram submetidas. O significado fisiológico dos perfis de expressão obtidos é discutido. A engenharia genética com o gene da sintetase de trealose-6-fosfato parece,
portanto, ser util na obtenção de plantas transgénicas de uso comercial para uma
possível plantação em solos contaminados ou utilizados em fitorremediação.
Palavras-chave: Nicotiana tbacum; Trehalose-6-fosfate synthase; AtTPS1; 2-DE; DIGE;
7
Index
1 Introduction 9
1.1 Heavy metals 9
1.1.1 Contamination and contamination sources 9
1.2 Trehalose 10 1.3 Role in plants 10 1.3.1 Biosynthesis pathway 11 1.4 Nicotiana tabacum 12 1.5 Proteomic approaches 12 1.5.1 Gel based 13 1.5.2 Mass Spectrometry 14 1.6 Previous work 16
1.6.1 Previous works with TPS 16
1.6.2 Previous Proteomic work in heavy metal stress en plants 16 1.6.3 Tobacco strains origin and preliminary works with heavy metal stress 17
1.7 Objectives of the current work 18
2 Material and methods 19
2.1 2-DE Optimization 21
3 Results 29
3.1 Optimization of 2-DE electrophoresis 29
3.2 2-DE-DIGE 31
3.3 Gel image analysis 32
3.3.1 B5H/Wt assay 32
3.3.2 B1F/Wt assay 35
3.4 Identification of differentially expressed proteins 39
4 Discussion 43
5 General Conclusions and Future Prospects 51
6 Bibliography 52
8
Index of figures
FIGURE 1: TREHALOSE MOLECULE (ADAPTED FROM PAUL, ET AL, 2008) 11 FIGURE 2: TREHALOSE’S BIOSYNTHETIC PATHWAY (ADAPTED FROM ALMEIDA, ET AL, 2007) 12 FIGURE 3: WORK FLOW OF A DIGE EXPERIMENT ADAPTED FROM TIMMS AND CRAMER
2008[28] 14
FIGURE 4 MALDI-TOF AND TOF/TOF ANALYZER SQUEAM, ADAPTED FROM J. KATHLEEN LEWIS,
JING WEI, AND GARY SIUZDAK 2000 15
FIGURE 5: PICTURE OF TOBACCO PLANTS GROWN UNDER HYDROPONIC CONDITIONS.
ADAPTED FROM BATISTA[51] 20
FIGURE 6: 2-DE GEL OBTAINED FROM 600 µG OF PROTEIN AND CCB STAINED 29 FIGURE 7: 2-DE GEL OBTAINED FROM 300 µG OF PROTEIN CCB STAINED; A: NON-DEPLETED
SAMPLE; B: DEPLETED SAMPLE 30
FIGURE 8: 1D GEL, CCB STAINED CONTAINING 30µG OF PROTEIN IN EACH SAMPLE 10: ONE LEAF (500 µL) 10* ADDITIONAL CENTRIFUGE STEP; 11: TWO LEAVES; A: 500 µL; B: 750 µL; C: 1 ML; 12: 1.5 LEAVES; A: 500 µL; B: 750 µL; C: 1 ML 30 FIGURE 9: IMAGES RESULTING FROM ONE DIGE GEL FROM THE B5H/WT ASSAY; A: WT
TREATED WITH 50 µM OF CADMIUM MARKED WITH CY 3 DYE; B: B5H CONTROL SAMPLE MARKED WITH CY 5 DYE; C: INTERNAL STANDARD MARKED WITH CY2 DYE. 31 FIGURE 10: IMAGES RESULTING FROM ONE DIGE GEL FROM THE B5H/WT ASSAY; A: B1F
CONTROL SAMPLE MARKED WITH CY 3 DYE; B: WT TREATED WITH 50 µM OF CADMIUM MARKED WITH CY 5 DYE; C: INTERNAL STANDARD MARKED WITH CY2 DYE. 32 FIGURE 11: SPOT PICKING IMAGE RESULTING FROM THE GEL IMAGE ANALYSIS OF THE B5H/WT
ASSAY 33
FIGURE 12: PRINCIPAL COMPONENTS ANALYSIS FROM THE ASSAY B5H/WT REPRESENTING THE FOUR GROUPS IN THIS ASSAY WTC; WTCD50; B5H C AND B5H CD50 33 FIGURE 13: EXAMPLES OF TWO SPOTS SHOWING DIFFERENTIAL EXPRESSION AS A
CONSEQUENCE OF CD EXPOSURE IN THE B5H/WT EXPERIMENT 35 FIGURE 14: SPOT PICKING IMAGE RESULTING FROM THE GEL IMAGE ANALYSIS OF THE B1F/WT
ASSAY 36
FIGURE 15: PRINCIPAL COMPONENTS ANALYSIS FROM THE ASSAY B1F/WT REPRESENTING THE FOUR EXPERIMENTAL GROUPS FOR THESE ASSAY WTC; WTCD50; B1F C AND B1F CD50 36 FIGURE 16: SOME OF THE SPOTS IDENTIFIED AS DIFFERENTIALLY EXPRESSED IN THE ASSAY
9
1
Introduction
1.1
Heavy metals
1.1.1 Contamination and contamination sources
Soil heavy metal contamination has been one of the major concerns due to their
toxicity, persistence and non-degradability in the environment. Presently, heavy metal
contamination is a major world agricultural problem. The specific issues regarding
heavy metal, in agricultural environment, are mainly due to their accumulation in the
food chain with direct consequences to the consumer health1,2. For this reason the development of economically feasible remediation techniques represents a pressing
technological and scientific issue. Several crops plant present the advantage of
accumulating metals, if grown on metal polluted soil or irrigated with polluted water,
being therefore a good tool for phytoremediation3,4.
Trace elements like heavy metals are important contaminants that occur in
consequence of human activities5,6. The contamination of fields with these elements
increased radically since the Industrial Revolution. The main sources of contamination
are activities like mining and smelting, municipal wastes, industry, but also agriculture
due to the use of fertilizers and pesticides6. Despite the fact that several heavy metals
like Iron, Zinc and Copper are essential for plant physiology as micronutrients and only
in high levels became toxic, there are others, like Arsenic, Lead, Cadmium and
Mercury, that are non essential and highly toxic even in low concentrations7.
The presence of these contaminants can affect plant growth and development. Once
heavy metal concentration increased in the plant cytosol, it becomes harmful,
inhibiting transpiration and photosynthesis, disturbing carbohydrate metabolism, and
driving to secondary stresses like nutrition and oxidative stresses, which collectively
affect plant development and growth and consequently in agricultural crops, their
yields and their safe consumption. The toxic dose depends on several factors, in
particular the type and concentration of the ion, plant species, and the stage of plant
growth, among others 6–8
Cadmium (Cd), in particular, is one of the most problematic pollutants, due to its high
10
Cadmium is released into the environment in large amounts, usually through
man-made factors and animals and humans are exposed to it via the ingestion of contaminated food, leading to health problems namely renal tubular dysfunction and
cancer9–11.
Albeit the high phytotoxicity, Cd is easily taken up by plant roots and transported to
aerial tissues. Being highly mobile in the phloem, Cd can be accumulated in all plant
parts which cause disruption of physiological processes, inhibits photosynthesis,
inactivates enzymes in CO2 fixation, induces lipid peroxidation, inhibits pollen
germination and tube growth, and also disturbs the nitrogen (N) and sulfur (S)
metabolism and antioxidant machinery; leading to leaf chlorosis, root necrosis and
stunted growth 10–13.
Cd can be taken up by roots via Fe or Zn transporters while interfering with the uptake,
transport, and use of others elements such Ca, Mg, P, and K. As soon as it is
translocated to the shoots, it alters chlorophyll content, photochemical quantum yield
of photosynthesis light harvesting complex I and II and other photosynthetic
processes14.
Plants respond to avoid harmful effects in a variety of different ways. This tolerance to
metals is based on multiple mechanisms such as cell wall binding, compartimentation
in the vacuoles by active transport of ions mediated by transporter proteins, and the
chelation of ions by forming of complexes with organic acids or peptides
phytochelatins. Components of this network have been identified continuously, mainly
through proteomic analysis of the protein expression pattern variations6–8,15.
1.2
Trehalose
1.3
Role in plants
Trehalose is a sugar discovered, in 1832 by Wiggers, in the sequence of the research
over rye’s ergot16. The name trehalose was introduced in 1858, because it was found in
coccons of desert beatles named “trehala” by Berthelot16,17. Since then, its effects in
organisms have been widely studied18. In plants, trehalose presence was discovered
very recently, particularly in plants tolerant to desiccation and generally termed
11
disaccharide, containing two units of D-glucose, linked in a α,α-1,1 configuration, as
shown in Figure 1; is a nonreducing sugar, not easily hydrolyzed by acid and resistant to cleavage by α-glucosidase16–18,20.
Figure 1: Trehalose molecule (adapted from Paul, et al, 2008)
The molecule occurs in a large range of organisms besides plants: fungi, bacteria, yeasts, algae, insects and other invertebrates and its role in the metabolism of these
organisms can be diverse18, but the most important known activity of trehalose is the
capacity to enhance the tolerance of plants to abiotic stress, namely water deficit stress. Acting as an osmoprotector, trehalose has the capacity to stabilize membranes
and proteins during desiccation, heat and osmotic stress 16,21,22. Due to its
characteristics, trehalose is a potential target for genetic engineering in plants,
towards the enhancement of abiotic stress tolerance.
1.3.1 Biosynthesis pathway
There are five trehalose biosynthetic pathways known in living organisms and there
are organisms with various pathways and others with just one15, but in eukaryotic
organisms only one pathway in known23. Such pathway consists in two steps, in the
first one UDP-Glucose and Glucose-6-phosphate are linked, in a reaction catalyzed by
the enzyme trehalose-6-phosphate synthase (TPS), and then in the second step,
trehalose-6-phosohate phosphatase (TPP) removes the phosphate group, resulting in
free trehalose. Trehalose can be cleaved by the enzyme trehalase, into two molecules
of glucose (Erro! A origem da referência não foi encontrada.)16,22,23. TPS is the major target for genetic engineering, because it is considered to be the critical factor in the
12 Figure 2: Trehalose’s Biosynthetic pathway (adapted from Almeida, et al, 2007)
1.4
Nicotiana tabacum
Nicotiana tabacum (tobacco) has been used as a model plant for decades and is one of the most studied higher plant species.I It belongs to the Solanaceae family and the
genus Nicotiana, that includes over 60 species. Tobacco plants occur naturally in
tropical and temperate regions of every continent however is in Central and South America that reaches the higher expression and diversity.
This species (Nicotiana tabacum L.) results of a natural hybridization of two native species, Nicotiana sylvestris & Nicotiana tomentosiformis approximately 6 million years
ago24.
The original species originates from the borders of mid or lower altitude forests of the
Central and Southern America, presented small seeds, sensitive to the light. Tobacco is
grown in full sun, in well drained but moisture retentive soils, rich in organic
material24,25.
Tobacco is a large and robust annual plant, with some varieties growing to 3 m in
height, and developing a semi-woody stem, in a single growing season. The leaves can
get up to 40 cm or more in length. Tobacco flowers are typically tubular and around 5
cm long with a rose-pink color, which are mildly fragrant and borne in hanging clusters
in late summer25.
.
1.5
Proteomic approaches
Proteomics is a relatively new field of research that emerged in the past few decades,
and has the objective of characterizing the proteome of an organ or organism, being
the science of large-scale analysis of proteins. To do so, proteomics bases itself in two
main aspects, protein separation (mainly by gel basis approaches) and identification
and characterization of proteins and peptides (mainly Mass Spectrometry (MS)
13
1.5.1 Gel based
Quantitative protein expression analysis is one of the most challenging aspects in
proteomics28.
Two-dimensional polyacrylamide gel electrophoresis (2-DE-PAGE or 2-DE) has been the
separation technique, by default, in proteomic studies and it remains one of the key
methodologies. In this technique, proteins undergo the first dimension, an isoelectric
focusing (IEF), in which, the proteins, are separated by isoelectric point. The second
dimension separates the proteins by molecular mass in the presence of denaturating
agents. Two-dimensional electrophoresis was first introduced by O’Farrell in 1975. In
the original technique, the first dimension separation was performed in
carrier-ampholyte-containing polyacrylamide gels cast in narrow tubes 29,30. In-gel detection of
proteins is historically made, preferentially by two methods, Silver or Colloidal
Coomassie Blue (CCB) stainings26. However these methods have some limitations in
terms of sensitivity, dynamic range and reproducibility. Therefore, the detection, may
be improved using the differential gel electrophoresis (DIGE) that exploits the higher detection of proteins labeled with fluorescent dyes that can be spectrally resolved and
then identifying the proteins by Mass Spectrometry assays 28,31,32.
The key benefit of DIGE is that it allows the incorporation of the same internal
standard on every gel in the assay, enabling to produce qualitative and quantitative
data. By tagging the samples with different cyanine dyes that provide different
fluorescence wavelengths for detection, two differentially labeled samples can be
combined and co-separated on the same gel, reducing the amount of gels needed and
avoiding the gel to gel variation raises the confidence of the detected differences28,33
as demonstrated in Figure 3. Fluorescent dye provide a large sensitivity, detecting
about 125 pg of protein and providing a linear response to protein concentration of up
to four orders of magnitude27.
After software analysis, gels are ready to be cut, choosing to excise the spots of
greatest interest to the subject under study. These will be submitted to an in gel
digestion, typically with trypsin, so that the peptides generated can then be analyzed
14 Figure 3: work flow of a DIGE experiment adapted from Timms and Cramer 200828
1.5.2 Mass Spectrometry
MS based proteomics has emerged as a new and potent, technology in the last decade
15
proteins present in complex mixtures, often without previous knowledge of its
composition27. To identify protein it is needed to have good data in the peptide masses in terms of sensitivity and resolution34. Mass spectrometry methods measure m/z of
ions of compounds with high accuracy and precision. Tandem mass spectrometry
(MS/MS) identifies the origins of the fragment ions35,36.
Figure 4 MALDI-TOF and TOF/TOF analyzer squeam, adapted from J. Kathleen Lewis, Jing Wei, and Gary Siuzdak
2000
Protein rapid identification is a task frequently addressed by matrix-assisted laser
desorption/ionization time-of-flight mass spectrometry (MALDI/TOF-MS), MALDI results in a nondestructive vaporization and ionization of both large and small
biomolecules. It introduces an organic matrix (such as α-cyano-4-hydroxycinnamic
acid) in a large molar excess, that co-crystallize with the analyte 36–38. The matrix
absorbs the laser and vaporizes carrying the analyte with it; the matrix also serves as a
proton receptor and donor, contributing to ionize the analyte in both negative and
positive modes37. MALDI ionization source can be used in two types of mass analysers,
the Time-of-Flight (TOF) and a TOF reflectron. TOF analysis is the simplest and is based
in the time that a set of ions takes to reach the detector after being accelerated, if the
ions were submitted to the same amount of energy. As the ions have the same energy
but not the same mass, the ions reach the detector at different times37.
TOF reflectron (TOF/TOF) combines the TOF technology with the reflectron, an
electrostatic analyzer, which increases the ions time of flight while reducing their
16
1.6
Previous work
1.6.1 Previous works with TPS
In 1997 Goddijn et al. used the OtsA gene from E. coli, successfully transformed both
tobacco and potato plants and obtained trehalose accumulation in transgenic tobacco
that displayed abnormal phenotypes such as stunted growth and lancet-shaped
leaves39. Using a construct with the TPS1 gene from S. cerevisae, Romero et al.
genetically engineered tobacco whilst Yeo et al. in 2000 made the same with potato
plants. Again, abnormal phenotypes such as those described earlier were detected and
trehalose accumulation was shown in both cases. Drought tolerance was increased in
transgenic plants by comparison with wild type plants.
A fusion gene (TPSP) of both E. coli genes involved in trehalose biosynthesis has been
used for the genetic engineering of rice40,41. According to Garg et al. 2002, several
transgenic lines were established and exhibited sustained plant growth, less
photo-oxidative damage under salt, drought and low temperature stress conditions and
accumulated trehalose42. The same gene construction was also introduced into rice
plants under the control of a different promoter by Jang et al., 2003. The trehalose
levels increased significantly in leaf and seed extracts of transgenic plants to levels of up to 1.076 mg/g fresh weight, while carbohydrate profiles were similar to wild-type
control plants43. In 2004, Avonce and coworkers reported that over-expression of
Arabidopsis AtTPS1 gene in Arabidopsis that conferred drought tolerance without causing morphological changes44, and in 2005 Almeida and colleges also using the
Arabidopsis AtTPS1 transformed Nicotiana tabacum22 Almeida’s work will be further
addressed in point 1.6.3.
More recently in 2011 Li et al found that transgenic lines overexpressing OsTPS1 have
enhanced tolerance of rice seedling to cold, high salinity and drought treatments
without other significant phenotypic changes by increasing the amount of trehalose
and proline, and regulating the expression of stress-related genes45.
1.6.2 Previous Proteomic work in heavy metal stress en plants
In 2001,employing high-resolution two-dimensional electrophoresis (2-DE), Hajduch et
17
alkaline metals detecting, severe changes in 2-DE protein patterns after exposure to
copper, cadmium, and mercury, over control, including differences in the major leaf photosynthetic protein, ribulose-1,5-bisphosphate carboxylase/oxygenase (RuBisCO,
both suppression and fragmentation) suggesting a highly specific action of some of
these metals in disturbing the photosynthetic machinery46. In 2006, Sarry et al, using
2-DE and LC-ESI-MS, revealed that the main variation at the protein level came from the
presence of six different families of phytochelatins, in A. thaliana cells treated with
Cd14. In 2007 Bona and coworkers, investigated copper effects on the root proteome of
Cannabis sativa, finding that Copper stress induced the suppression of two proteins, the down-regulation of seven proteins, while five proteins were up-regulated. The
resulting differences in protein expression pattern were indicative of a plant
adaptation to chronic stress47. Kieffer et al (2008) used young poplar plants (Populus
sp.) leaves exposed to Cd, they analysed the protein extracts by 2-DE-DIGE, followed by MALDI-TOF-TOF identification, found that the negative effect of Cd could be
explained by a deleterious effect on protein expression from the primary carbon
metabolism and from the oxidative stress response mechanism48. In 2009 Farinati and
colleagues, using Arabidopsis halleri grown in heavy metal-contaminated soil and
analyzing the proteome by 2-DE followed by MS, found a general up-regulation of
photosynthesis-related proteins in plants exposed to metals, and also that proteins
involved in plant defense mechanisms were down-regulated indicating that heavy
metals accumulation in leaves supplies a protection system and highlights a cross-talk
between heavy metal signaling and defense signaling49. In 2008 Zhao et al studied the
effects of Cd exposure on protein expression patterns of Phytolacca americana. They
verified several key proteins alterations, involved in distinct metabolic pathways by immuno-blot analysis. Major changes were found for the proteins involved in
photosynthetic pathways. One-third of the up-regulated proteins were attributed to
transcription, translation and molecular chaperones50. These previous works help to
understand potential effects heavy metal induced stress in plants, which is important
in the present work.
1.6.3 Tobacco strains origin and preliminary works with heavy metal stress
The Nicotiana tabacum strains used in the present work had their origin in the work
18
gene under the control of the CaMV35S promoter and the Bialaphos resistance gene
was inserted in the binary plasmid vector pGreen0229 and used for Agrobacterium-mediated transformation of tobacco, originating three strains, B5A, B5H (both
presenting high expression of TPS) and B1F (presenting lower but yet relevant
expression of TPS) as confirmed by northern and western blot. Plants presented higher
tolerance to drought, osmotic and temperature stresses22. In 2007, Almeida and
colleagues further analyzed the B5H and B1F strains in terms of the photosynthetic
response of these two strains, comparing to a wild type, in response to water
withdrawal stress. Their results indicate that the B5H strain possible have a higher
ability to withstand severe drought stress and to resist to prolonged periods without
water than the B1F and WT lines21.
In 2009 Batista presented an MSc thesis about the evaluation of the response to
oxidative stress induced by cadmium and copper in tobacco plants transformed and
Wild type, using the strains B5H and B1F. The plants were grown in hydroponic
solution with different concentrations of these metals. Baptista measured the protein
content in leaves, in terms of antioxidative enzymes (CAT, POD, SOD, APX), lipid
peroxidation and hydrogen peroxide were determined in leaves. The results lead to
the conclusion that B1F plants seem to be less affected by oxidative stress induced by
Cd and Cu than B5H or WT51.
1.7
Objectives of the current work
As referred earlier heavy metal contamination is an increasing problem in the modern
world. It is essential to start using heavy metal tolerant plants in phytoremediation of
contaminated area and grow economically interesting. It is also important to use
non-crop plants with enhanced heavy metal tolerance, which may have interest in other
non-food applications such as forestry or industrial fiber production for instance.
The previously-mentioned results led to the hypothesis that plant genetic engineering
with the trehalose bio-synthesis gene leads to the increase in abiotic stress tolerance,
both at the level of water deficit and heavy metal (cadmium) stresses. Such higher
tolerance will necessarily have impact at the level of protein expression. The aim of the
present work is therefore to study the effects of a Cd exposure of two transgenic
19
towards heavy metal-induced stress, in comparison to wild type using a proteomics
approach. Differentially expressed proteins between control and treated plants are to be identified and their possible roles in Cd stress responses discussed. Using this novel
strategy that, to best of our knowledge has never been applied, we will be able to
understand, at the biochemical level, which are the proteins implicated in the
transgenic plants ability to withstand heavy metal stress as induced by cadmium.
2
Material and methods
Plant material
Plant material used in this work had its origin in the work of Almeida et al. in 2005,
where a cassette harboring the AtTPS1 gene under the control of the CaMV35S
promoter and the Bialaphos resistance gene was inserted in the binary plasmid vector
pGreen0229 and used for Agrobacterium-mediated transformation of Nicotiana
tabacum plants 22. We chose two of the three original strains which already shown enhanced tolerance to water deficit and osmotic stress (Almeida et al., 2005, 2007)
and heavy metal induced-stress in a physiology study by Batista (2009). The strains
used were B5H, B1F originated from Nicotiana tabacum cv. Petite Havane which wild
types were used as controls. Culture conditions have been previously described by
Baptista,51. Briefly, all strains were gown in hidroponic culture with Hogland’s nutritive
solution in 2 L capacity boxes. Each of the strains and Wt were grown in conditions of
heavy metal contamination Cd (25, 50 and 100 μM), Cu (50, 100 e 200 μM) and As (25,
50 and 100 μM) We used the 50 µM of cadmium concentration and a zero control for
each strain, for now on refered to as Wt C (Wild type zero control) Wt Cd 50 (Wild type
treated with 50 µM of cadmium), B5H C (B5H zero control), B5H Cd 50 (B5H treated
with 50 µM of cadmium), B1F C (B1F zero control) and B1F Cd 50 (B1F treated with 50
µM of cadmium). We choosed cadmium, due to its importance as contaminant and we
choose the 50 µM concentration, because it should provide a good insight in the
protein patter variation. The last expanded leaf was cut and immediately frozen in
20
section were conducted in a preliminary phase of the project and not by the author of
this MSc thesis. Information herein described is reported only for descriptive purposes and to present the framework in which the proteomics analysis was later conducted.
Figure 5: Picture of tobacco plants grown under hydroponic conditions. Adapted from Batista51 Protein extraction and concentration
The plant material was emerged in N2 and ground with a Mikro-Dismembrator S
(Sartorius, Goettingen, Germany) at 3.000 rpm for 90 seconds. Proteins were
precipitated with a solution of 60 mM dithiothreitol (DTT), 10 % trichloroacetic acid
(TCA) in Acetone (w/v) cooled at -20ºC and incubated for 1 hour at -20ºC and later
vortexed for 15 seconds followed by a 16.000G, 10 minutes centrifugation at 4ºC. The
pellet was first washed in 100 mM ammonium acetate in methanol cooled at -20ºC
and then in 80 % acetone cooled at -20ºC. Between each wash, the pellet was
incubated at -20ºC for 30 min and was afterwards vortexed for 15 seconds, followed
by a 16.000G centrifugation at 4ºC and for 10 minutes. The pellets were dried for 1
hour in a Thermomixer (Eppendorf, Hamburg, Germany) at 800 rpm, at room
temperature (RT) and were then dissolved in IEF DIGE lysis (buffer 30 mM Tris, 7 M
Urea, 2 M Thiourea, 4% (w/v) 3-[(3-Cholamidopropyl)
21
was performed using the 2D Quant Kit (GE Healthcare, Uppsala, Sweden), following
manufacturer’s instructions.
2.1
2-DE Optimization
For the first-dimension, 600 μg of protein from each extract were incubated with urea
rehydration solution (8 M urea, 2% (w/v) CHAPS, 0.28% (w/v) DTT), 2% IPG buffer
3-10NL (GE Healthcare, Uppsala, Sweden) and a trace quantity of bromophenol blue, to a
total volume of 450 μL, for 1 hour at room temperature and were then centrifuged at 16.000 G for five minutes. This solution was used for the active rehydration of 24 cm
Immobiline™ DryStrip pH 3-10NL strips (GE Healthcare, Uppsala, Sweden) covered with
Immobiline™ DryStrip Cover Fluid (GE Healthcare, Uppsala, Sweden) during 12 hours at
30 V. The active rehydration and the remaining of the IEF setup were run in an Ettan™
IPGphor™ 3. The remaining of the IEF setup was as follows, 1 hour at 200 V, 1 hour at
500 V, 1 hour at 1.000 V, a gradient of 30 minutes set to 8.000 V and a final step at
8.000 V until reaching 50.000Vh.
After IEF, the strips were equilibrated, in order to reduce and alkylate the proteins.
Strips were equilibrated in equilibration buffer (6 M urea, 75 mM Tris-HCl pH 8.8,
29.3% (v/v) glycerol, 2% (w/v) SDS, 0.002% (w/v) bromophenol blue) with either 6.5
mM DTT and 10 mM iodoacetamide (IAA) during 15 minutes for each stage of the
process.
The second dimension was performed, on large slab, 1 mm thick and 12.5% acrylamide
gels (Acrylamide 40% 29:1, 1.5 M TrisCl, pH 8.8, 10% (w/v) SDS, 10% (w/v) Ammonium
Persulfate (APS), 10% (v/v) Tetramethylethylenediamine (TEMED)). The second
dimension was performed in Ettan™ DALTsix (GE healthcare, Uppsala, Sweden) with
Laemmli electrophoresis buffer (25 mM Tris base, 192 mM glycine, 0.1% (w/v) SDS)
and the running conditions were 10 mA/gel, 80 V, 1 W/gel during 1 hour followed by
15 W/gel until the dye front reached the end of the gel. Gels were stained with
22
RuBisCo depletion trial
The RuBisCo depletion was attempted by adapting a protocol used by Kim and
co-workers52. The plant material was emerged in N2 and ground with a
Mikro-Dismembrator S (Sartorius, Goettingen, Germany) at 3.000 rpm for 90 seconds, and
the grinded samples were suspend in 1mL of Mg/tritonx100 solution containing 0.5 M
Tris-HCl, pH 8.3, 2% v/v tritonX100, 20 mM MgCl2, 2% v/v β-mercaptoethanol. The
extracts were centrifuged at 12.000G for 15min the supernatant was saved and 200 µL
of a 50% (w/v) polietilenoglicol (PEG) solution was added to the supernatant and
incubated on ice for 30 minutes and then centrifuged at 1.500G for 10 minutes the
pellet was saved and 200µL of a 50% PEG solution was added to the supernatant and
Incubated on ice, for 30min followed by 15 minutes of centrifugation at 12.000G; the
pellet was saved and 80% acetone was added to the supernatant, incubated, on ice for
30 min then centrifuged at 12.000G for 15min. Proteins were precipitated with a
solution of 60 mM DTT, 10 % TCA in Acetone (w/v) cooled at -20ºC and incubated for 1
hour at -20ºC, then vortexed for 15 seconds, followed by a centrifugation at 16.000G
for 10 minutes at 4ºC. The resulting pellet was first washed in 100 mM ammonium
acetate in methanol cooled at -20ºC and then in 80 % acetone cooled at -20ºC.
Between each washes, pellet was incubated at -20ºC for 30 min, followed by 15
seconds vortexing and 16.000g, 10 minutes at 4ºC centrifugation. The pellets were
dried for 1 hour in a Thermomixer (Eppendorf, Hamburg, Germany) at 800 rpm, at
room temperature (RT) and then were dissolved in IEF DIGE lysis buffer (30 mM Tris, 7
M Urea, 2 M Thiourea, 4% (w/v) CHAPS, pH 8.5) for 2-DE gel electrophoresis.
Plant tissue amount and volume of buffer trial
Three different quantities of plant tissue and three different volumes were tested. In terms of plant tissue were accessed 1leaf, 1.5 leaves and two leaves, in terms of lysis
buffer volume, 500 µL, 750 µL and 1mL mere accessed. 30 µg of quantified protein
were runned in a 1-D gel stained with CCB.
23
Visible staining was performed to visualize the spots that would be selected for manual
picking upon gel analysis. Coloidal Coomassie Blue (CCB) or Silver staing were respectively used for larger and smaller spots. All gels used in 2-DE protocol
optimization were also subjected to Coloidal Coomassie Blue staining.
Silver Staining was performed using the SilverQuestTM Silver Staining Kit (Invitrogen,
Carlsbad, California) with several changes being made to the manufacturer protocol.
We used 300 mL of each solution per gel; 45 min in sensitizing instead of 10 min; 20
min in 30% ethanol instead of 10 min, 30 min in staining instead of 15 min, and use 30
mL of Stopper instead of 10 mL. The distaining protocol was made following the
manufacturer protocol. A total of 100 µL of 50% (v/v) mixture of Distainer A and B was
added to the exized spots and incubated at room temperature for 15 minutes, then
the solution was removed and ultra pure water was added and incubated also at room
temperature for 10 minutes. This step was repeated until the spots were completely
distained.
For CCB, gels were stained in a solution of 7.84% (w/v) Ammonium sulphate, 1.57%
(v/v) Ortho-phosphoric acid, 0.08% (w/v) Coomassie G-250, 20% (v/v) Methanol)53 for
48h under agitation followed by five successive steps of washing with double-distilled
water for 15 minutes.
2-DE-DIGE
2-DE-DIGE was performed following instructions from the manufacturer (GE
Healthcare, Uppsala, Sweden). The pH of each sample was adjusted to 8.5 with 100
mM and 250 mM NaOH solution, using pH test srips (Sigma-Aldrich, St. Louis, Missouri)
in the day when labelling would be performed and using 24 cm Immobiline™ DryStrip pH 3-10NL strips (GE Healthcare, Uppsala, Sweden). An internal standard (IS) was
made by mixing 30 μg of each of the samples used in the study. The samples (30 μg)
and the internal standard were labelled with CyDye DIGE Fluor minimal dyes (240 pmol
per 30 μg protein, GE Healthcare, Uppsala, Sweden) and incubated on ice for 30 min in
the dark. One microlitter of 10 mM Lysine was then added to stop the reaction, and
the samples were left on ice for 10 min in the dark. Replicates were multiplexed
24
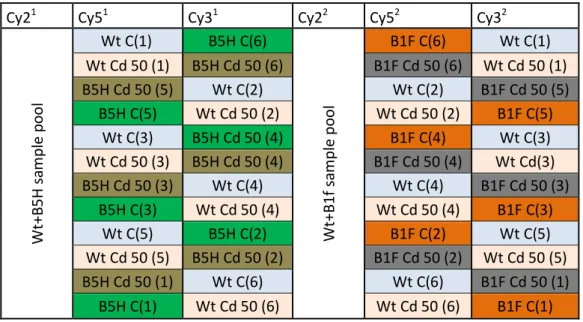
present in Table 1 in order to prevent bias results in gel image analysis. As shown in
the follwing table this work was divided in two assays, one directly comparing the B5H strain control (B5H C) and treated with 50 µM of cadmium (B5H Cd 50), with Wild
typet control (Wt C) and trated with 50 µM of cadmium (Wt Cd 50) refered from mow
on as B5H/Wt assay and other one directly comparing the B1F strain control (B1F C)
and treated with 50 µM of cadmium (B1F Cd 50), with Wt C and Wt Cd 50, refered
from mow on as B1F/Wt assay.
Cy21 Cy51 Cy31 Cy22 Cy52 Cy32
W t+ B 5 H s a m p le p o o l Wt C(1) B5H C(6) W t+ B 1 f sa m p le p o o l B1F C(6) Wt C(1) Wt Cd 50 (1) B5H Cd 50 (6) B1F Cd 50 (6) Wt Cd 50 (1) B5H Cd 50 (5) Wt C(2) Wt C(2) B1F Cd 50 (5) B5H C(5) Wt Cd 50 (2) Wt Cd 50 (2) B1F C(5) Wt C(3) B5H Cd 50 (4) B1F C(4) Wt C(3) Wt Cd 50 (3) B5H Cd 50 (4) B1F Cd 50 (4) Wt Cd(3) B5H Cd 50 (3) Wt C(4) Wt C(4) B1F Cd 50 (3) B5H C(3) Wt Cd 50 (4) Wt Cd 50 (4) B1F C(3) Wt C(5) B5H C(2) B1F C(2) Wt C(5) Wt Cd 50 (5) B5H Cd 50 (2) B1F Cd 50 (2) Wt Cd 50 (5) B5H Cd 50 (1) Wt C(6) Wt C(6) B1F Cd 50 (1) B5H C(1) Wt Cd 50 (6) Wt Cd 50 (6) B1F C(1) Table 1: sample randomization for DIGE assays: 1 represent the B5H/Wt assay and 2: the B1F/Wt assay in the first line is represented which Cy Dye is to be used in each column
The two samples (30 μg) for each batch and the internal standard (30 μg) were mixed
before adding 2x lysis buffer (7 M urea, 2 M thiourea, 4% CHAPS (w/v), DeStreak
Reagent (GE Healthcare, Uppsala, Sweden)) to a final volume of 450 μl, and 2% v/v ampholytes immobilized pH gradient (IPG) buffer (pH 3-10, GE Healthcare, Uppsala,
Sweden) (see Table 2 and 3 for further details). The batch was left on ice for 10 min in
the dark before loading onto IPG strips (Immobiline Dry Strips, 24 cm, pH 3-10 NL, GE
Healthcare, Uppsala, Sweden) for isoelectric foccusing. The current experiment thus
25 Table 2: table containing the mixtures made for each IPG strip in the B5H/Wt assay
B5H/Wt Cy51 V(µL)2 Cy33 V(µL)4 pool Cy2 V(µL)5 samples total (µL)6
2xLysis7 deStreak8 Total9
1 wtc1 13,77 B5HC6 11,35 16,13 41,24 41,24 367,52 450,00 2 WtCd50_1 17,79 B5HCd50_6 16,34 50,26 50,26 349,47 450,00 3 B5HCd50_5 18,39 wtc2 15,00 49,52 49,52 350,96 450,00 4 B5HC5 17,24 WtCd50_2 14,89 48,26 48,26 353,49 450,00 5 wtc3 20,16 B5HC4 15,98 52,26 52,26 345,49 450,00 6 WtCd50_3 17,24 B5HCd50_4 14,48 47,85 47,85 354,31 450,00 7 B5HCd50_3 10,73 wtc4 14,40 41,26 41,26 367,48 450,00 8 B5HC3 12,90 WtCd50_4 29,41 58,44 58,44 333,13 450,00 9 wtc5 19,57 B5HC2 10,93 46,63 46,63 356,75 450,00 10 WtCd50_5 19,45 B5HCd50_2 14,50 50,07 50,07 349,85 450,00 11 B5HCd50_1 9,10 wtc6 12,50 37,73 37,73 374,54 450,00 12 B5HC1 14,85 WtCd50_6 26,07 57,05 57,05 335,90 450,00
Table 2: 1:samples marked with Cy5; 2volume of the sample for 30 µg of protein; 3samples marker with Cy3; 4 volume of sample containing 30 of protein. 5 contains the volume of sample pool B5H/Wt marked with Cy2 for 30 µg. The 6column contains the total volumes of the samples marked with Cy5 and Cy3 and sample pool. 7 Contains the volume of 2x Lysis buffer needed to dilute the samples according to the users’ manual. 8 contains the volumes of DeStreak solution needed to make 450 µL in the 9 represent the total volume loaded in to each IPG strip.
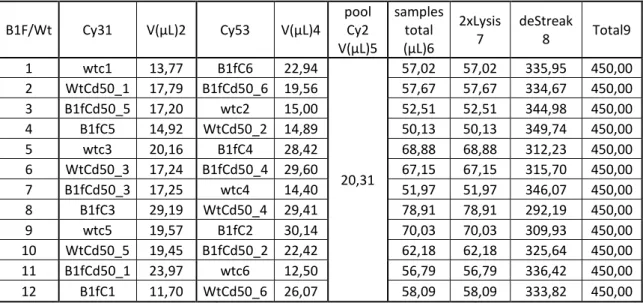
Table 3: table containing the mixtures made for each IPG strip in the B1F/Wt assay
B1F/Wt Cy31 V(µL)2 Cy53 V(µL)4 pool Cy2 V(µL)5 samples total (µL)6 2xLysis 7 deStreak 8 Total9 1 wtc1 13,77 B1fC6 22,94 20,31 57,02 57,02 335,95 450,00 2 WtCd50_1 17,79 B1fCd50_6 19,56 57,67 57,67 334,67 450,00 3 B1fCd50_5 17,20 wtc2 15,00 52,51 52,51 344,98 450,00 4 B1fC5 14,92 WtCd50_2 14,89 50,13 50,13 349,74 450,00 5 wtc3 20,16 B1fC4 28,42 68,88 68,88 312,23 450,00 6 WtCd50_3 17,24 B1fCd50_4 29,60 67,15 67,15 315,70 450,00 7 B1fCd50_3 17,25 wtc4 14,40 51,97 51,97 346,07 450,00 8 B1fC3 29,19 WtCd50_4 29,41 78,91 78,91 292,19 450,00 9 wtc5 19,57 B1fC2 30,14 70,03 70,03 309,93 450,00 10 WtCd50_5 19,45 B1fCd50_2 22,42 62,18 62,18 325,64 450,00 11 B1fCd50_1 23,97 wtc6 12,50 56,79 56,79 336,42 450,00 12 B1fC1 11,70 WtCd50_6 26,07 58,09 58,09 333,82 450,00
Table 3: 1:samples marked with Cy3; 2volume of the sample for 30 µg of protein; 3samples marker with Cy5; 4 volume of sample containing 30 of protein. 5 contains the volume of sample pool B5H/Wt marked with Cy2 for 30 µg. The 6column contains the total volumes of the samples marked with Cy5 and Cy3 and sample pool. 7 contains the volume of 2x Lysis buffer needed to dilute the samples according to the users’ manual. 8 contains the volumes of DeStreak solution needed to make 450 µL in the 9 represent the total volume loaded in to each IPG strip. Protein extracts were then loaded on each strip holder and the strips where then
placed and covered with Dry Strip Cover Fluid. The active rehydration of the strips and
Isoelectric focusing (IEF) were carried out on an Ettan IPGphor 3 system (GE
Healthcare, Uppsala, Sweden) using the following programs: rehydration: 30V (step
and hold) for 22h, after rehydration the paperwiks where placed and the IEF started
26
1.000 V (gradient) for 6h, 10.000 V (gradient) for 2 h and 10.000 V (step and hold) for
80.000 Vh.
After IEF, the proteins were reduced and alkylated by equilibration of the strips for 15
min in equilibration buffer (50mM Tris-HCl pH 8.8, 6 M urea, 30 % glycerol (v/v), 2 %
SDS (w/v), 0.002 % bromophenol blue (w/v)) containing 6.5 mM DTT followed by 15
min in equilibration buffer containing 10 mM iodacetamide. Separation of the second
dimension was performed on 1.0 mm thick gels under low fluorescence glass plates
(GE Healthcare, Uppsala, Sweden). IPG strips were loaded on SDS-PAGE 12.5 %
acrylamide gels and sealed with a 0.5% (w/v) agarose solution. For the second
dimension an Ettan DALTsix electrophoresis unit (GE Healthcare, Uppsala, Sweden)
was used with electrophoresis buffer (Tris 25 mM, glycine 192 mM, 0.2 % SDS (w/v)).
Gels were run at 20 ºC, 1 W/gel for 17H and 17 W/gel until dye front reached the end
of the gel.
Gel image acquisition and analysis
Visible stained gels were scanned at 300-dpi resolution using a calibrated
densitometer, ImageScanner (Amersham Biosciences, Piscataway, New Jersey), using
LabScan version 5.0.
The DIGE images were scanned with a laser-based scanner FLA-5100 (FujiFilm) using
532 and 635 nm excitation lasers (DGR1double filter) for Cy3 and Cy5, respectively,
and a 473 nm excitation laser (LPB filter) for Cy2 under Image Reader FLA 5000 version
1.0 (FujiFilm). The 2-DE gels were scanned in low-fluorescence glassplates at a
resolution of 100 μm.
The gel images were then analyzed using Progenesis SameSpots analysis software
version 3.3.1 from NonLinear Dynamics following the instructions manual. All
analytical gels were aligned to its internal standard (IS) and the IS of each gel was aligned to a IS reference gel (chosen by the user). Following detection and filtering of
spots, images were separated into groups (Wt C, Wt Cd 50, B1F C, B1F Cd 50, B5H C
and B5H Cd 50) and analyzed to determine significant changes in 2-D spot abundance.
27
was included for each spot and any proteins with an Anova p-value < 0.05 or an
absolute abundance variation of less than 1.5 fold were excluded from further consideration.
In- gel Digestion and Mass spectrometry analysis
Spots of interest were excised manualy, using a 1 mL micropete tip with the cutted
end. These procedures have been thoroughly described by Ventosa. Briefly, excised gel
spots were washed with 50 % (v/v) acetonitrile (ACN) to remove stain traces, then
were dehydrated with 100 µL of ACN for 15 minutes, then the ACN was discarded and
the spots were incubated in 50 µL of a 10 mM of DTT in 100mM of NH4HCO3 solucion
for 45 minutes at 56ºC, in order to reduce disulphide bridges, the solution was
discarded and the spots were incubated in 55 mM of IAA in 100mM of NH4HCO3
solucion for 30 minutes at RT in the dark in order to alkylate the previously reduced
disulphide bridges. The spots were then dehydrated with ACN and vacuum-drying.
In-gel digestions were performed by adding 20 μL 6.7 ng/μL modified porcine trypsin
(Promega, Madison, Wisconsin) in 50 mM NH4CO3. The gel pieces absorbed the trypsin
solution for 30 min on ice and remaining liquid was removed. Finally 30 μL of 50 mM
NH4CO3 were added and the samples incubated at 37 °C for 16 h. The obtained
supernatant was recovered and gel pieces were further incubated with 200 µL ACN for
15 min then the liquid was recovered. To the gel pieces was added 200 µL of 5 % (v/v)
formic acid for 15 min, the liquid was then colected and to the gel pieces was added
200 µL of ACN incubated for 15 min and the liquid was then colected in order to
further extract peptides trapped in the gel. Peptides were desalted and concentrated
according to the method of Gobom et al.38 Using homemade zip-tip columns (GELoader tip 0.5-20 µL, Eppendorf, Hamburg, Germany) with EmporeTM Octadecyl C18
extraction disks (Supelco Analytical, Sigma-Aldrich St. Louis, Missouri). The column was
washed with 20 μL 5 % (v/v) Formic Acid (FA). The tryptic peptides was loaded on the
column and afterwards bound peptides were eluted with 0.6 μL of matrix solution
(α-cyano-4-hydrocynnamic acid 5 gL-1 in 50 % acetronitrile, 5% FA) directly on the MALDI
28
TOF-TOF Analyzer apparatus. Data were acquired in positive MS reflector using
PepMix1 calibration mixture (LaserBio Labs, France) standard to calibrate the instrument. Each reflector MS spectrum was collected in a result-independent
acquisition mode, typically using eight thousand laser shots per spectra in an
800−4.000 m/z range and a fixed laser intensity of 3.000V. Fifteen of the strongest
precursors were selected for MS/MS, the strongest precursors being fragmented first.
MS/MS analyses were performed using CID (Collision Induced Dissociation) assisted
with air, with a collision energy of 1 kV and a gas pressure of 1 x 10⁶ torr54.
Identification of proteins differentially expressed
Raw data was generated by the 4000 Series Explorer Software v3.5.3 (build 1017)
(Applied Biosystems) and contaminant m/z peaks resulting from trypsin autodigestion
were excluded when generating the peptide mass list used for data-base search.
Using the mass list, database queries were performed against five databases,
UniRef100 2012, NCBInr (20120701), SwissProt 2012, SwissProt 2012 restricted to
Viridiplantae (Green Plants), and Medicago (MT_3.5_nt CDSSeq_20100825) using
Mascot search engine (version 2.2.04).nd had defined a peptide tolerance of 50 ppm
and a MS/MS tolerance of 0.3 Da. The queries had also defined carbamidomethyl of
the cysteines as a fixed modification; oxidation of methionines and deamidation as
variable modifications. Tryptic peptides with tolerance to one missed cleavage were
considered. Depending on the data base protein identification considered valid were
the ones with a score of at least 85 (NCBInr and UniRef100); 70 (SwissProt); 67
(Medicago) and 58 (SwissProt 2012 restricted to Viridiplantae (Green Plants)). Mascot search engine calculated the significance (p < 0,05 ) for the database used.
It was also used the Protein Pilot software version 3.0, revision 114732; (Applied Biosystems, USA) searches were performed using the NCBInr 20120701 database
without taxonomic restrictions and search parameters set as follows: enzyme, trypsin;
29
modification and amino acid substitution. protein identification considered valid were
the ones with a score of at least 8555.
3
Results
3.1
Optimization of 2-DE electrophoresis
For the optimization of 2-DE electrophoresis trials, we used 600 µg of quantified
protein extract. We followed the protocol presented previously and Colloidal
Coomassie Blue (CCB) staining, to estimate the efficiency of the extraction protocol
and the condition of the sample in terms of degradation as well as obtain
familiarization with the 2-DE technique.
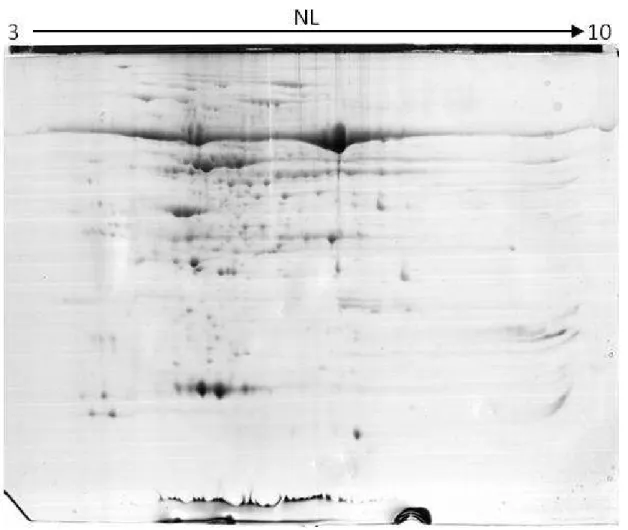
Figure 6: 2-DE gel obtained from 600 µg of protein and CCB stained
Observing the obtained gel image present in figure 6, we noticed a spot belonging to
one major protein, RuBisCO which could be masking numerous minor proteins, so we
We used a PEG fractionation protocol, and we performed the 2
efficiency of the depletion. We loaded a total of 300 µg of quantified protein extract, that upon 2-DE was stained with Colloidal Coomassie Blue, resulting in the gel images
presentedin figure 7.
Figure 7: 2-DE gel obtained from 300 As may be seen from figure 7
content, not only RuBisCO. As a consequence, and also because in similar studies, leaf
protein extracts are rarely depleted, we decided not to conduct the depletion protocol.
An additional optimization question needing to be answered
tissue needed to be ground. Accordingly, we have tried several quantities of plant
material and volumes of lysis buffer to solubilise the proteins, as seen in figure 8,
reaching the conclusion that the equivalent to 1 leaf of plant material was to be ground and proteins solubilised in 500 µL of buffer.
Figure 8: 1D gel, CCB stained containing centrifuge step; 11: two leaves; a: 500
e used a PEG fractionation protocol, and we performed the 2-DE assay to assess the
efficiency of the depletion. We loaded a total of 300 µg of quantified protein extract, DE was stained with Colloidal Coomassie Blue, resulting in the gel images
gel obtained from 300 µg of protein CCB stained; A: non-depleted sample; B: depleted sample As may be seen from figure 7, the depletion led to a generalized loss of p
. As a consequence, and also because in similar studies, leaf
protein extracts are rarely depleted, we decided not to conduct the depletion protocol.
An additional optimization question needing to be answered lay in the amount of plant ed to be ground. Accordingly, we have tried several quantities of plant
material and volumes of lysis buffer to solubilise the proteins, as seen in figure 8,
reaching the conclusion that the equivalent to 1 leaf of plant material was to be ins solubilised in 500 µL of buffer.
containing 30µg of protein in each sample 10: one leaf (500 µ 11: two leaves; a: 500 µL; b: 750 µL; c: 1 mL; 12: 1.5 leaves; a: 500 µL; b: 750
30
DE assay to assess the
efficiency of the depletion. We loaded a total of 300 µg of quantified protein extract, DE was stained with Colloidal Coomassie Blue, resulting in the gel images
depleted sample; B: depleted sample , the depletion led to a generalized loss of protein
. As a consequence, and also because in similar studies, leaf
protein extracts are rarely depleted, we decided not to conduct the depletion protocol.
in the amount of plant ed to be ground. Accordingly, we have tried several quantities of plant
material and volumes of lysis buffer to solubilise the proteins, as seen in figure 8,
reaching the conclusion that the equivalent to 1 leaf of plant material was to be
µL) 10* additional L; b: 750 µL; c: 1 mL
31
The 1-D gels are simply qualitative due to the interfering of urea present in the buffer
3.2
2-DE-DIGE
As previously explained, all work was divided in two specific assays, one comparing
directly B5H to Wild type plants in both 50 µM cadmium exposure and control
conditions (B5H/Wt assay) and other comparing directly B1F plants to Wild type plants
in both 50 µM cadmium exposure and control conditions (B1F/Wt assay)
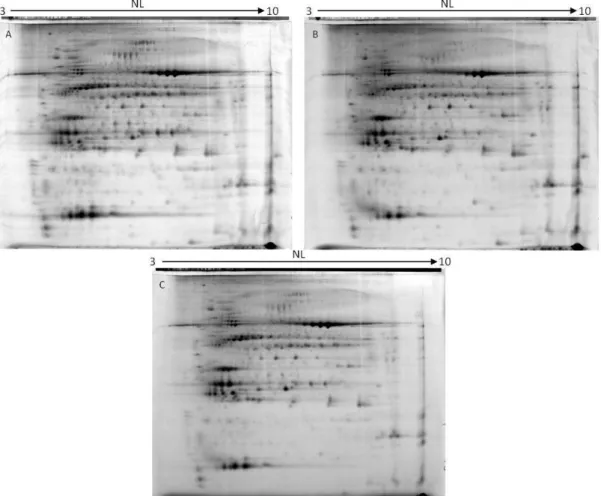
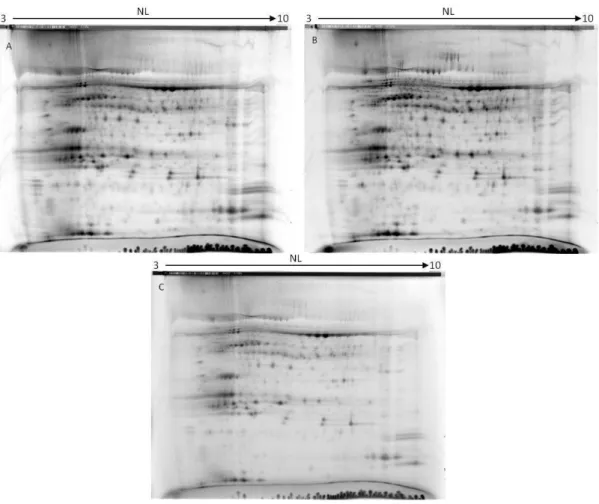
Figure 9: images resulting from one DIGE gel from the B5H/Wt assay; A: Wt treated with 50 µM of cadmium marked with Cy 3 dye; B: B5H control sample marked with Cy 5 dye; C: internal standard marked with Cy2 dye.
Twenty four 2-DE-DIGE runs were made for this work divided in two batches of
twelve runs each, according to tables 2 and 3 previously presented. Each gel resulted
in three gel images, one for each Cye Dye as shown in figures 9 and 10 for the B5H/Wt and B1F/Wt assay respectively.
32 Figure 10: images resulting from one DIGE gel from the B5H/Wt assay; A: B1F control sample marked with Cy 3 Dye; B: Wt treated with 50 µM of cadmium marked with Cy 5 Dye; C: internal standard marked with Cy2 Dye.
Once all the images regarding the two assays were acquired, image analysis was
performed.
3.3
Gel image analysis
3.3.1 B5H/Wt assay
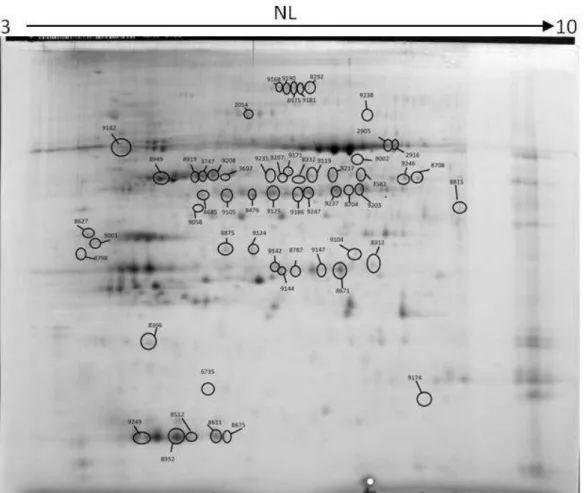
Gel analysis using the Progenesis SameSpots for the B5H/Wt resulted in the spot
33 Figure 11: spot picking image resulting from the gel image analysis of the B5H/Wt assay
Progenesis Same Spots gel analysis also created the Principal Component Analysis
(PCA), presented in Figure 12. As may be seen, groups Wt C, B5H C and B5H Cd 50
clustered together whereas the group Wt Cd 50 forms a separate cluster.
Figure 12: Principal Components Analysis from the assay B5H/Wt representing the four groups in this assay WtC; WtCd50; B5H C and B5H Cd50
From the gel analysis, a list of spots showing differential expression was generated.
Results are summarized in Table 4. They indicate that the Average Normalized
Volumes, as well as the significance level and the fold for each spot in the four
Table 4: spot list for B5H/ # Anova (p) 8293 2,84E-06 8875 3,51E-06 9206 1,44E-05 9235 1,70E-05 8476 1,73E-05 8919 3,00E-05 8787 3,07E-05 8671 3,40E-05 9119 7,21E-05 9247 7,52E-05 9181 9,15E-05 8512 9,25E-05 9105 1,04E-04 8312 1,58E-04 9147 1,79E-04 9238 3,35E-04 8708 4,33E-04 8685 4,43E-04 9104 4,47E-04 9144 5,31E-04 8611 8,47E-04 9124 0,001 2916 0,002 9142 0,002 8675 0,003 5484 0,003 9001 0,004 8704 0,004 8501 0,004 9002 0,004 9171 0,005 9042 0,005 3697 0,005 8627 0,005 8798 0,005 9174 0,006 for B5H/Wt assay Fold
Average Normalized Volumes
WtC WtCd50 B5H C 4,4 0,731 3,202 1,021 4,2 0,672 2,847 1,017 2,8 0,888 2,513 1,155 2,6 0,921 2,394 1,048 2,9 0,917 2,651 1,443 3 0,812 2,444 1,167 3,6 0,765 2,721 1,016 7,2 0,696 5,025 1,089 3,8 0,866 3,265 0,991 3,3 0,922 2,998 1,241 3,7 0,782 2,924 1,007 2,4 0,985 2,348 1,309 2,6 0,852 2,213 1,327 3,2 0,89 2,858 1,191 3,2 0,964 3,121 1,136 2,4 1,013 2,21 0,907 2,7 1,031 2,767 1,168 3,2 0,758 2,458 1,29 2 0,922 1,873 1,102 4,5 0,63 2,835 0,926 2,1 0,972 2,058 1,335 2,8 0,853 2,368 1,055 3 0,977 2,957 1,458 2,3 1,13 2,574 1,283 2,3 0,81 1,834 1,143 3,9 0,744 2,902 1,371 1,5 1,502 1,003 1,449 2,3 1,22 2,769 1,289 2,9 1,303 3,763 1,46 1,8 1,278 2,037 1,155 1,8 0,92 1,626 1,035 2,7 1,099 2,938 1,362 3,2 0,862 2,747 1,325 1,7 1,712 1,02 1,312 1,5 1,54 1,001 1,227 2,1 0,672 1,387 0,893 34
Average Normalized Volumes
B5H Cd50 1,051 1,104 1,156 1,183 1,279 1,299 1,103 1,608 1,445 1,214 1,118 1,437 1,169 1,224 1,415 1,034 1,45 1,087 1,215 0,84 1,375 1,026 1,669 1,312 1,149 1,73 1,217 1,536 1,75 1,198 1,104 1,107 1,429 1,137 1,209 0,908
6735 0,006
9182 0,006
9058 0,007
8949 0,008
ANOVA, fold and average normalized volumes calculated, obtained in
Each spot have a group of four images of the spot in four gel images, one for each
experimental group. An example of a graphic ilustrating the results from the
expression analysis for two spots (8300 and 9237), is
individual expression profiles for the differentially expressed proteins that were identified are also represented
Figure 13: Examples of two spots showing differential expression as a conseque
3.3.2 B1F/Wt assay
Similar to the previously described the for B5H/Wt image analysis, a Progenesis
SameSpots analysis was equally conducted the for B1F and Wt lines, creating the spot picking image presented in Figure
2 1,187 0,742 0,599
1,8 0,852 1,509 1,246
1,6 1,247 1,914 1,222
2,3 0,762 1,742 1,107
, fold and average normalized volumes calculated, obtained in the image analysis in the B5H/Wt assay
Each spot have a group of four images of the spot in four gel images, one for each
experimental group. An example of a graphic ilustrating the results from the
expression analysis for two spots (8300 and 9237), is shown in Figure 13. In the annex,
individual expression profiles for the differentially expressed proteins that were identified are also represented.
Examples of two spots showing differential expression as a consequence of Cd exposure in the experiment
Similar to the previously described the for B5H/Wt image analysis, a Progenesis
SameSpots analysis was equally conducted the for B1F and Wt lines, creating the spot picking image presented in Figure 14,
35 0,972 0,981 1,196 1,004
the image analysis in the B5H/Wt assay
Each spot have a group of four images of the spot in four gel images, one for each
experimental group. An example of a graphic ilustrating the results from the
shown in Figure 13. In the annex,
individual expression profiles for the differentially expressed proteins that were
nce of Cd exposure in the B5H/Wt
Similar to the previously described the for B5H/Wt image analysis, a Progenesis
36 Figure 14: spot picking image resulting from the gel image analysis of the B1F/Wt assay
A Principal Component Analysis (PCA) was also generated and is presented in Figure
15. In this experiment groups Wt Cd 50 and the B1F C clustered separately whereas
groups Wt C and B1F Cd 50 seem to have clustered together.
Figure 15: Principal Components Analysis from the assay B1F/Wt representing the four experimental groups for these assay WtC;WtCd50; B1F C and B1F Cd50
A list of the spots presented in the Spot picking image with their anova, fold and average normalized volumes of the spots differentially expressed for this assay is presented in table 2.
Table 5: Spot list for B1F/Wt assay # Anova (p) 5832 3,08E-08 5473 9,73E-08 5495 1,02E-07 5625 1,14E-07 5666 1,70E-07 5838 1,76E-07 5574 2,07E-07 5519 2,69E-07 5731 2,82E-07 5371 4,79E-07 5459 6,08E-07 5358 6,78E-07 5472 8,09E-07 5756 9,39E-07 1250 1,06E-06 1258 1,77E-06 5415 2,69E-06 5803 3,58E-06 5668 5,82E-06 5365 7,95E-06 5379 8,55E-06 5834 9,23E-06 5542 1,17E-05 5715 1,29E-05 1274 1,45E-05 5446 1,69E-05 5470 2,34E-05 5630 2,50E-05 1205 3,09E-05 5831 3,66E-05 3503 3,87E-05 5590 4,02E-05 5600 4,66E-05 5624 5,28E-05 5533 7,29E-05 5412 7,94E-05 5837 1,00E-04 5736 1,37E-04 for B1F/Wt assay
Fold Average Normalised Volumes
Wt C Wt Cd 50 B1f C 2,7 0,893 2,331 1,226 2,9 0,842 2,337 1,158 3,5 0,828 2,741 1,278 3,2 0,732 2,335 1,367 4,3 0,623 2,7 1,363 3 0,891 2,487 1,268 2,8 0,773 2,131 1,386 3,1 0,771 2,377 1,172 2,9 0,821 2,368 1,192 4,2 0,749 2,801 1,264 2,6 0,854 2,198 1,152 3,4 0,637 2,148 1,446 3,7 0,671 2,466 1,217 2,4 0,806 1,919 1,382 3,9 0,779 2,733 1,228 4,5 0,72 2,697 1,219 2,8 0,843 2,342 1,537 2,2 0,909 2,02 1,306 2,4 1,027 2,161 1,507 3,4 0,668 2,283 1,175 2,3 0,984 2,148 1,104 2,3 0,786 1,835 1,261 5,3 0,659 3,492 1,206 2,8 0,828 2,347 1,204 3,5 0,738 2,161 1,32 3,1 0,799 2,345 1,257 2,7 0,861 2,328 1,395 2,9 0,84 2,473 1,26 3,1 0,754 2,334 0,94 2,1 0,913 1,922 1,404 1,7 1,358 0,833 0,831 1,9 1,17 1,974 1,329 2,5 1,034 1,932 1,261 2,7 0,858 2,144 0,922 3,9 1,002 2,933 1,301 1,9 0,977 1,902 1,377 2,4 0,764 1,861 1,425 2,4 1,137 2,01 1,34 37
Average Normalised Volumes
B1f Cd 50 0,873 0,82 0,788 0,855 0,722 0,84 0,926 0,776 0,898 0,667 0,888 1,056 0,757 0,986 0,7 0,596 0,896 1,123 0,903 0,871 0,925 1,138 0,707 0,907 0,617 0,768 0,987 0,866 0,819 1,157 0,81 1,015 0,776 0,784 0,749 1,192 1,228 0,837
3050 1,65E-04 5629 1,68E-04 5738 2,58E-04 5746 3,87E-04 5664 3,99E-04 5818 4,12E-04 5798 4,36E-04 5674 0,001 3545 0,001 5744 0,002 5618 0,002 5760 0,002 5751 0,003 4543 0,004 2220 0,005 2201 0,006 5699 0,007 5839 0,007 5650 0,007 4345 0,011 5769 0,013 3534 0,014
ANOVA, fold and average normalized volumes calculated, obtained in the image analysis in the B1F/Wt assay
Figure 16: some of the spots identified as differentially expressed in the assay B1F/Wt
Similarly to the previously mentioned experiments, examples of graphics and images,
illustrating the variation of spot expression in the four experimental groups of the assay is presented in figure 16. In the annex, individual expression profiles for the
differentially expressed proteins that were identified are represented.
2,1 0,962 2,051 1,239 2 0,969 1,975 1,332 2,8 0,981 1,958 1,205 2,6 0,854 2,221 1,086 2,7 1,024 2,106 1,226 2 0,926 1,838 1,255 2,3 0,791 1,808 1,314 2 0,991 1,965 1,129 2,5 0,857 1,782 1,193 1,9 0,968 1,854 1,388 1,8 1,092 1,573 1,149 1,8 1,081 1,901 1,286 3 1,062 2,442 1,207 1,8 1,42 0,863 0,769 260,2 0,36 2,907 88,483 87 0,582 50,66 43,476 1,9 1,852 0,976 1,271 1,8 1,679 0,919 1,095 1,8 0,891 0,911 1,122 1,5 1,24 0,861 1,098 2,5 0,98 2,29 1,331 2,2 0,823 1,598 0,862
, fold and average normalized volumes calculated, obtained in the image analysis in the B1F/Wt assay
: some of the spots identified as differentially expressed in the assay B1F/Wt
he previously mentioned experiments, examples of graphics and images,
illustrating the variation of spot expression in the four experimental groups of the assay is presented in figure 16. In the annex, individual expression profiles for the
expressed proteins that were identified are represented.
38 1,03 1,092 0,707 0,898 0,794 0,945 1,266 1,079 0,727 0,997 0,894 1,141 0,818 1,146 0,34 0,622 1,415 1,458 1,609 1,294 0,905 0,714 , fold and average normalized volumes calculated, obtained in the image analysis in the B1F/Wt assay
: some of the spots identified as differentially expressed in the assay B1F/Wt
he previously mentioned experiments, examples of graphics and images,
illustrating the variation of spot expression in the four experimental groups of the assay is presented in figure 16. In the annex, individual expression profiles for the