Novabase
Equity Research
Nuno Sampaio 152110115
Advisor: Prof. José Carlos Tudela Martins
Abstract
The objective of this thesis is to value a Portuguese quoted equity. A detailed analysis of the main valuation methods was presented as well as the strengths and weaknesses of each one in light of an updated academic literature. The most appropriate method for the specific firm was identified and a complete equity valuation was done.
Dissertation submitted in partial fulfillment of requirements for the degree of International MSC in Business Administration, at Católica Lisbon School of Business and Economics, September, 2012
2 Table of Contents 1. Introduction ... 4 2. Executive Summary ... 5 3. Literature Review ... 7 3.1. Valuation ... 7
3.2. Discounted Cash Flow ... 8
3.2.1. Firm Valuation ... 9
3.2.1.1. Free Cash Flow to the Firm - FCFF ... 9
3.2.1.1.1. Risk free rate ... 10
3.2.1.1.2. Beta ... 10
3.2.1.1.3. Risk Premium ... 12
3.2.1.2. Adjusted Present Value – APV ... 14
3.2.1.2.1. Tax Shields ... 15
3.2.1.2.2. Expected Bankruptcy Costs ... 16
3.2.1.3. APV vs. FCFF ... 18
3.2.1.4. Capital Cash Flow – CCF ... 18
3.2.2. Equity Valuation ... 20
3.2.2.1. Free Cash Flow to Equity – FCFE ... 20
3.2.2.2. Dividend Discounted Method – DDM ... 20
3.3. Relative Valuation – Multiples ... 21
3.4. Contingent Claim Valuation - Option Theory ... 24
4. Novabase – Company Presentation ... 25
4.1. History ... 25
4.2. Structure ... 26
4.2.1. Business Solutions (BS) ... 26
4.2.2. Infrastructures & Managed Services (IMS) ... 27
4.2.3. Digital TV (DTV) ... 27 4.2.4. Venture Capital ... 27 4.3. Geographical Presence ... 28 4.4. Financial Performance ... 28 4.5. Stock Performance ... 30 4.6. Strategy ... 31
4.7. Novabase’s positioning among its competitors ... 32
4.8. SWOT Analysis... 33
3
4.10. Dividend Policy ... 35
5. Industry Overview ... 36
5.1. Information Technology ... 36
5.2. Worldwide Market ... 37
5.3. West European Market ... 40
5.4. Portuguese Market... 42 6. Novabase’s Valuation ... 46 6.1. Valuation Assumptions ... 46 6.1.2. Revenues ... 46 6.1.3. Operational Expenses ... 47 6.1.4. EBITDA ... 48 6.1.5. Working Capital ... 49
6.1.6. CAPEX and Depreciations & Amortizations ... 50
6.1.7. Net Debt ... 51
6.1.8. Weighted Average Cost of Capital - WACC ... 52
6.2. DCF’s Valuation ... 53
6.3. Sensitivity Analysis ... 55
7. Relative Valuation – Multiples ... 56
8. Valuation Comparison with Millennium BCP ... 57
9. Conclusion ... 59
10. Appendixes ... 60
11. References ... 73
11.1. Academic Literature ... 73
11.2. Investor Relations ... 75
11.3. Industry Associations documents ... 75
11.4. Investment Banks research ... 76
11.5. Other documents and sources ... 76
4
1. Introduction
This Master Thesis was written as the final assignment of the International Masters of Science in Business Administration at the Catholic University of Portugal. It is divided in two parts: the literature review and the Equity Valuation case.
In the first one, Literature Review, I make a complete analysis of the main valuation methods, presenting the advantages and disadvantages of each one. Moreover, I expose which valuation models are more suitable for certain companies, since there is no single best method for every company.
In the equity valuation case half I perform a detailed analysis and consequent valuation of a Portuguese company listed on the Lisbon Stock Exchange - Novabase, the leading company in IT Business Solutions in the domestic market. The choice of valuing Novabase was due to its recent but successful history in one of the most promising and rising industries in the World - Information Technology.
Besides the typical equity valuation, I also perform an overview of the Information Technology Industry in order to support many of the valuation assumptions, and a detailed presentation of Novabase’s strategy.
In the end, I make a comparison of my valuation with one of a recognized investment bank, Millennium BCP, explaining possible differences in valuation methodologies and assumptions.
5
2. Executive Summary
August 2012 Company Report IT Industry Upside:97,2% 0% 20% 40% 60% 80% 100% 120% PSI20 Novabase NOVABASE (NBA:LS)Nuno Sampaio – Católica Lisbon School of Business and Economics
The lack of investment from the public and private sectors and the strong pricing pressure in its domestic market is affecting all of Novabase’s divisions.
On a positive note, the company managed to sign strategic partnerships with relevant player in IT industry.
The macroeconomic environment in Portugal is proving to be quite challenging, with revenues falling 16% between 2008 and 2011. Economic downturn should still bring lower domestic revenues in both 2012 and 2013.
However, International business has in the meantime partially offset this difficult context and accounts now for 20% of consolidated revenues. Management expects business abroad to reach 25% of revenues in 2012, which implies a growth rate of over 30% in 2012.
Recommendation: BUY
Share Price: EUR 2,05
Target Price: EUR 4,04
No. of shares (mn) 31,4
52 Wk high Price: EUR 2,60
6 August 2012 Company Report IT Industry (mn €) Turnover FY11 BS 89,6 IMS 86,0 DTV 52,8 Capital 1,2 TOTAL 229,6 EV 126,9 - Net Debt -9,9 - Minorities 9,8 Equity Value 127,0 # shares (mn) 31,4 Price 4,04 DCF Assumptions 12-13 14-17 TV Re 19,2% 13,7% 9,5% Rf 2,5% 2,5% 2,5% Beta 1,07 1,07 1,07 Market Premium 5,5% 5,5% 5,5% Country R. Premium 10,1% 5,0% 1,0% D/EV 0,0% 0,0% 0,0% WACC 19,2% 13,7% 9,5% g 2,0% NOVABASE (NBA:LS)
Nuno Sampaio – Católica Lisbon School of Business and Economics
Tough Outlook in the Portuguese IT market: although worldwide IT spending is expected to grow by 5 % in 2012, the macro environment and austerity measures in Portugal should lead IT market to decline by 3,9%.
Novabase’s Revenues and EBITDA will, however, increase due to its International Business, after an abrupt drop in the last two years.
Novabase’s strong Balance Sheet should allow it to a sooner recovery.
Low liquidity continues to penalise stock. This issue may be overcome with the possible entrance in the PSI-20 index.
Company Presentation
Novabase, headquartered in Lisbon, Portugal, was founded in 1989 as a software-house, specialized in customized solutions development. Nowadays, it is the leading Portuguese company in IT business solutions with a turnover (2011) of €229,6 million, being almost 20% of it generated outside Portugal.
7
3. Literature Review
3.1. ValuationFirm valuation, as one of the main problems in corporate finance, has been subject of detailed study in the past literature. In the past years, with the increasing capitalism, firm valuation has gained even more importance, playing a major role either in merger and acquisitions or in a shareholder value-oriented management. Fernández (2007) claims that “understanding the mechanisms of company valuation is an indispensable requisite” which goes further than its weight in mergers and acquisitions, being an unique tool to indentify sources of economic value creation and destruction within the company. Copeland, Koller and Murrin (1994) also consider valuation as useful tool for a better decision making in order to maximize the shareholder value which they believe to be the fundamental goal of all businesses.
Contrary to the general idea about valuation, it is neither a science nor a fully objective pursuit of the company or any other asset’s true value (Damodaran 2002). Even though, it may be anchored in quantitative models, valuation is ultimately result of the assumptions used which are not more than subjective inputs. This fact emphasises the importance of not taking into account any prior positions on the value of a firm in the process of the valuation. Koller, Goedhart and Wessels (2005) express the same idea, defending that “valuation can be highly sensitive to small changes in assumptions about the Future”.
In the literature, it is possible to find a large variety of methodologies regarding the firm valuation. In his textbook, Damodaran (2005) divides these methodologies into three main approaches: discounted cash flow valuation (present value of expected future cash flows); relative valuation (compares the price of an asset to the market value of similar or comparable assets); contingent claim valuation (option pricing models).
Figure 1: Main valuation categories and corresponding examples
Discounted Cash-Flow Valuation
E.g., PER,EV/EBITDA
Relative Valuation
E.g., Black Scholes model
Contingent Claim Valuation
E.g., Black Scholes model
8 Although, virtually, each valuation approach is no more than a different way to express the same underlying model, each method highlights diverse aspects of the valuation problem (Young, Sullivan, Nokhasteh and Holt 1999). It is therefore clear why analysts employ a wide range of valuation models, from the most basic model to sophisticated ones.
3.2. Discounted Cash Flow
The Discounted Cash Flow method is based on the belief that ultimately what can be distributed to Shareholders is Cash and hence the phrase ‘Cash is King’ (Copeland 2005). Damodaran (2002) argues that DCF “is the foundation on which all other valuation approaches are built”.
Value =
n t 1 t t t r 1 CF Where,CFt = Cash Flow at period t r = Discount rate
There are several methods to value a firm making use of discounted cash flow approach. The finance literature includes three different methods: Firm Valuation which values the entire company; Equity Valuation which seeks for the equity stake and Adjusted Present Value (APV) that equals the values of each claim on the firm separately, beginning with values of the operations, considering the value added by debt and other non-equity claims afterwards. These three approaches differ in the relevant cash flows and discount rates used by each one as it will be further explained.
As Young et al. (1999) claim, Oded and Michel (2007) showed that every discounted cash flow method leads to the same company’s value if the debt is rebalanced.
9
3.2.1. Firm Valuation
3.2.1.1. Free Cash Flow to the Firm - FCFF
Free Cash Flow to the Firm is the most widely accepted approach of discounted cash flow valuation, making use of the weighted average cost of capital (WACC) as the discount rate (Luehrman 1997a).
Value of the Firm =
n t 1 t t t WACC 1 FCFF Where,
FCFFt= Free Cash Flow Firm in period t WACC = Weighted average cost of capital
WACC is a calculation of a firm's cost of capital in which, each category of capital (debt and equity) is proportionately weighted (Bierman 2010).
WACC d
Ke E D E t 1 K E D D Where, E D D = Debt-to-value ratio K d =Cost of Debt t = taxes E D E = Equity-to-value ratio Ke = Cost of EquityThe cost of equity represents the rate of return required by an investor to own and bear the risk of owning a stake of the firm. The most common procedure for its estimation is the Capital Asset Pricing Model (CAPM). According to CAPM, the expected return on
10 any asset is equal to the risk free rate plus a risk premium which is calculated through the company’s expected systematic risk relative to the “market” portfolio (beta).
) R -R ( -R Ke f L m f Where,
Ke= cost of equity Rf = Risk free Rate
βL= Systematic risk of the company Rm – Rf = Market Risk Premium
Despite its simplicity, the controversy in CAPM arrives with the calculation of the risk-free rate, the market risk premium and the beta:
3.2.1.1.1. Risk free rate
The risk-free rate plays an important role in the when determining the cost of capital. There is an (implicit) consensus that the yields on long-term government bonds should be considered as a proxy of risk free rate. Although theoretically, the maturity of these bonds should be aligned with the investment life (Damodaran 2008), practitioners typically just opt for a ten-year bond.
Damodaran (2002) and Koller et al. (2005) recommend that the appropriate risk-free rate should be determined using a 10 year government bond. Fernandez (2004) points that the expected risk-free rate should have nothing to do with historical returns.
3.2.1.1.2. Beta
The beta is defined by Damodaran (2002) as the covariance of the asset divided by the variance of the market portfolio which measures the risk that the investment adds to the market portfolio. =
m m i R Variance R , R iance var Co11 Where,
Ri =Share’s returns Rm = Market return
According to Fama and French (2004) the Market beta is commonly (and correctly) interpreted as a measure of the sensitivity of the asset’s return to variation in the market return. The same authors consider it the slope in the regression of the asset’s return on the market return. If this definition is broadly accepted, the discussion among academics arises with the choice of the market portfolio which is commonly assumed to be a certain stock market index (such as S&P 500), depending on the asset industry and location. However, Macqueen (1980) considers this proxy an inefficient market portfolio, since it contains diversifiable risk and it is no more than a subset of the efficient market. Rosenber and Rudd (2002) consider that this efficient market should be a composition of all the assets in the world, proportionate to their value.
Koller et al. (2005) follow an alternative approach, recommending an industry-derived unlevered beta, levered to the company’s target D/E ratio. Damodaran (2002) calls this approach Bottom-Up Betas and states that it represents a significant improvement on regression betas since, averaging across a number of regression betas has much lower standard error than each regression beta and it can be adapted to reflect actual and expected changes in a firm’s business.
Rosenberg and Guy (1976) also suggest a different approach, which may be related whether to industry-specific features or company-specific, such as balance-sheet items or earnings performance. This method links more closely the beta to the firm’s intrinsic operating and financial characteristics. Rosenberg and Rudd (1982) propose adjusting upward the beta for companies showing: persistent growth (implied by the total assets growth rate or low dividend payout ratios); strong earnings variability; and high leverage, given the debt’s constraints and risk of financial distress. However, companies with low business risk and steady cash-flow tend to be more strongly levered in order to build tax shields, which can lead to mixed effects. The authors also propose the introduction of a downward adjustment for size (smaller firms are, on average, riskier).
12 3.2.1.1.3. Risk Premium
Risk Premium is not a consensual issue amongst academics or practitioners. A wide variety of methods are used to compute the Risk Premium (Damodaran 2008), however, the most popular one among practitioners is, by far, to infer it from past stock returns relative to riskless investments.
Whether country risk’s adjustment should or not be introduced is a sensitive issue regarding the risk premium. Although the literature does not usually support this view, analysts often decide to include a country risk premium in some markets.
Stulz (1995) argues that, with the globalization capital markets, the risk of securities is now efficiently spread among investors with globally diversified portfolios. On the other hand, James and Koller (2000) claim that the country risk should not be reflected in the discount rate but, instead, in the cash flows projections – through the computation of different scenarios – rather than in the discount rate and support this idea with three arguments: (i) investors can diversify most of the risks (ii) risks are idiosyncratic, meaning that “they don’t apply equally to all industries or even to all companies within an industry”; (iii) equity investments in a company can often be less risky than investments in government bonds which is overlooked when using the country’s credit risk as a proxy for firm’s risk. However, the author recommends that the cost of capital should be adjusted for macroeconomic variables (e.g. it is easy to understand that an increase in inflation leads to a higher cost of debt) but not in order to incorporate the country risk.
Damodaran (2008) is not a proponent of adjusting cash flows rationale, arguing that allowing for the possibility of poor outcomes, is not risk adjustment given that the expected cash-flow outcome will still be risky and therefore require an extra risk adjustment. The author suggests that expected cash-flow should be adjusted for the country risk premium in order to generate truly “certainty equivalent”.
Other authors (e.g. Goedhart and Haden 2003), consider that there is no single proper method, being the choice dependent on the underlying valuation.
After presented the most controversial issues in CAPM, it is important to have in mind, regarding the FCFF valuation that, if one wants to know how much the equity of a firm
13 is worth, one must subtract the value of all the nonequity claims to the value of the company (Koller et al. 2005). Nonequity claims can be grouped into four different categories: debt such as bonds, short-term and long-term bonds; debt equivalents including operating leases, pensions, specific types of provisions, preferred stock, and contingent liabilities; hybrid claims such as employee stock options and convertible bonds and minority interests.
If before the appearance of advanced computers, the FCFF method was regarded as being relatively practical (Luehrman 1997b), Ruback (2002) claims that this model is proven today to be the easiest to develop, given that it does not need forecasting debt levels and interest paid on a year-to-year basis. Instead, it only requires analysts to determine WACC’s implicit target leverage ratio, which is a delicate feature compared to APV approach.
The very same reason is pointed out by many academics as a weakness when studying the FCFF’s effectiveness due to its inflexibility concerning a change in capital structure. Luehrman (1997a) states that, if with a stable D/E ratio, the method works fairly well, it seems to be a fragile approach when facing changes in this ratio. Researchers discuss the use of firms’ optimal capital structure or the industry’s long-term trend when calculating the WACC, in order to minimize this limitation.
A changing capital structure leads not only to a changing WACC but also to a modified cost of equity “since debt payments have priority over cash flows to equity, adding leverage increases the risk to equity holders” (Koller et al. 2005).
According to Luehrman (1997b), in most real situations (non-static capital structures), FCFF approach still needs to be largely adjusted – “not only for tax shields but also for issue costs, subsidies, hedges, exotic debt securities, and dynamic capital structures”. Under complex and constantly changing capital structures, the computation of the appropriate WACCs based on a yearly estimation of the D/E ratios would be extremely impractical (Koller et al. 2005).
Ruback (2002) suggests that, in these cases, the WACC needs to be re-estimated every “because the WACC depends on value weights, the value of the firm has to be estimated simultaneously”.
14 This FCFF limitation has left space to the development and notoriety of models, like the Capital Cash Flow (CCF) and the Adjusted Present Value (APV) which will be discussed further ahead.
3.2.1.2. Adjusted Present Value – APV
Although FCFF remains as the most used DCF valuation method, an alternative approach, Adjusted Present Value, has emerged in the literature as a valid method. Luehrman (1997a) explas that the APV method esintablishes a barrier between the intrinsic value of the assets and the value added by a favourable capital structure. In other words, APV’s approach unbundles the components of the value, analysing them separately and then adding their value to the base-case value (value of the project as it was exclusively financed with equity). Damodaran (2006) explained the APV’s main difference when compared to other typical DCF valuations: APV starts by valuing the firm without any debt and then consider the net effects (both benefits and costs) of adding debt to the firm, in contrast to the conventional approach, where those effects are captured in the discount rate.
The Modigliani and Miller’s work (1958), who studied the leverage‘s effect on value of the firm, is the base of APV approach. The authors postulated in their first proposition that, in a perfect market under a no taxes assumption, the value of the levered firm is the same as the value of the unlevered firm, being the firm’s value independent of the capital structure. When taxes are introduced, given that interest payments on debt are tax-deductibles, debt does add value:
Vfirm levered = V firm unlevered + Tc*D Where, Vfirm
levered = Firm value if levered
Tc = Corporate Income Tax D = Firm Debt
15 Myers (1974) followed the same rationale when, later, developed the APV. Damodaran (2006), presented the model in a simple way:
AdjustedPresent Value = V firm
unlevered PV tax shieldsExpectedBankruptcy costs
Where,
PV tax shields = Tc*D
If the calculation of an all equity firm is quite straightforward:
Value of all equity firm =
Where,
Ku = cost of equity of the unlevered firm
The same straightforwardness doesn’t apply to the computation of the Present Values of Tax Shields and Expected Bankruptcy Costs.
3.2.1.2.1. Tax Shields
There is absolutely no consensus in the computation of the value of tax Shields. Initiating the debate, Modigliani and Miller (1958) discount interest tax deductions using the unlevered equity rate. However, in 1963, they corrected it discounting interest tax shields ate the riskless debt rate.
Nevertheless some authors, including Miles and Ezzell (1980, 1985), Harris and Pringle (1985), and Kaplan and Ruback (1995), subsequently returned to Modigliani and Miller’s original tax approach, discounting tax deduction at the unlevered equity discount rate.
16 Harris and Pringle (1980) proposed discounting the tax shields at the unlevered cost of capital. Miles and Ezzell (1980), suggests that a firm with a fixed debt-to-equity target should discount its interest tax shields with cost of debt in the first year, and in the following periods at a cost of capital for the unlevered firm. In turn, Ruback (2002) argues that if there is a fixed amount of debt overtime, interest tax shields should be discounted with cost of debt.
Other researchers have used the cost of risky debt to discount interest tax deductions, such as Myers (1974), Luehrman (1997), Damodaran (2006).
On the other hand, Fernandez (2001) reaches the value of tax shields calculating the difference between two different cash flows (each one with its own risk): the present value of an unlevered firm’s taxes and the present value of taxes for a levered firm. The author adds that it does not means the unlevered cost of equity is the appropriate discount rate.
3.2.1.2.2. Expected Bankruptcy Costs
The calculation of the expected bankruptcy costs requires not only direct (i.e. liquidation cots) and indirect costs (i.e. change in the perception of customer) of bankruptcy, but also the estimation of the probability of default with the additional debt.
Expected Value of Bankruptcy costs =Probability bankruptcy costs PVbankruptcy costs
The bankruptcy costs may be computed, making use of historical data and literature which have analyzed the scale of this cost. The estimation of the probability of bankruptcy can be done aided by historical default rates provided by rating agencies that links each level of debt to a bankruptcy probability (Vernimmen 2005).
Damodaran (2006) discusses the idea of discounted cash flow valuation, not explicitly considering the possibility of firms failing. The author considers and refutes two types of arguments of the proponents of this valuation: those of who believe that there is no need to consider distress explicitly (i.e. we value only large, publicly traded firms and distress is very unlikely for these firm); and those of who believe that discounted cash
17 flow valuations already incorporate the effect of distress (i.e. we adjust either the discount rates, or the expected cash flows for the possibility of distress).
Damodaran (2006) claims that, “even large publicly traded firms sometimes become distressed for one reason or the other” which highlights the fact the growth is inevitable and costs of financial distress should be properly determined. In the same reading, he proposes several methods for that propose, including APV methodology.
The impact of financial distress in valuation has been subject of other author’s empirical studies. Korteweg (2007) studied 244 firms in 22 industries between 1994 and 2004 and found, an average ex-ante costs of financial distress of 5% of firm value, not exceeding 11% for any industry. However, in bankruptcy, the costs of distress can rise as high as 31% of firm value. He also found that industries with large growth opportunities development tend to have high potential costs of financial distress, which is consistent with the debt overhang problem (Myers 1977).
Expected bankruptcy costs play a key role in the capital structure decision-making since they impose limits from which the benefits of interest tax shields do not compensate anymore. There is a mass support Modigliani and Miller’s idea that bankruptcy costs provide the basis for the existence of an optimal capital structure.
However, some authors have challenged this view of optimal capital structure. Haugen and Senbet (1978), argue that “bankruptcy costs, which affect the capital structure decisions, must be trivial or nonexistent if one merely assumes that capital market prices are competitively determined by rational investor”.
The authors claim that, under the assumption that if the market value of the dismantled assets exceeds their aggregate value as an ongoing firm, liquidation takes place, even if bankruptcy do not occur, the liquidation will still take place. This would happen since it is in the best interest of existing shareholders. Therefore they conclude that the firm’s financial structure and the bankruptcy event are irrelevant for the liquidation decision. Consequently, bankruptcy costs should not play a major role in the determination of the optimal capital structure.
18 3.2.1.3. APV vs. FCFF
Luehrman (1997a) claims that APV is less restrictive than FCFF since it works perfectly well whether there is a variable capital structure or in cases of a target capital structure. The author also points the benefits of APV as a managerial tool allowing decision-makers to understand from where value (or loss) is coming. In addition, WACC as a discounting rate is unable to deal with complex capital structures.
According to Sabal (2007) APV is more easily applicable in a non-perpetuity situation and, contrarily to FCFF, it does not require constant corporate tax rate and Market Debt ratio - two of the main WACC method’s assumptions. As mentioned before, these FCFF drawbacks can be mitigated or even eliminated if the discount rate is calculated in a yearly basis which, however, turns the method very complicated and time demanding. Goedhart et al (2005) is, as well, a proponent of the APV’s adequacy for companies with a changing capital structure.
Luehrman (1997b), as mentioned in the APV literature, also emphasizes the lack of FCFF’s adequacy in the real world due to its extensive required adjustments, as well as the reduced fit for cross-border valuation.
Booth (2002) suggests the APV as the best method to value highly levered transactions (such as levered buyouts, LBOs) due to the fact that a large part of the post-transaction value comes from a favourable financing structure.
Nevertheless, WACC’s based methods (FCFF) are more appropriate, with a fixed debt ratio under a perpetuity situation, whereas there is no consensus on which discount rates to use in tax shields valuation when using the APV approach (Sabal 2007). This argument, however, may be challenged by the Fernández’s study (2006) in which he shows that the differences in valuing tax shields are precisely in the origin of several formulas for the calculation of WACC (differences in authors’ WACCS correspond to different ways to value tax shields). Thus, there is no reason for FCFF methods being more adequate in perpetuities than the APV since they would be equivalent, from a theoretical point of view.
3.2.1.4. Capital Cash Flow – CCF
According to Ruback (2002), Capital Cash Flow approach is algebraically equivalent to the FCFF method. The simplicity is its advantage when comparing to FCFF given that
19 the interest tax shields are included in the cash flows. In other words, Capital Cash Flows equal Free Cash Flows plus the interest tax shields, being the appropriate discount rate a before-tax WACC which corresponds to the riskiness of the assets.
Value of the firm =
n t 1 t bf n 1 g WACC FCFF Where,
FCFF1 = Free Cash Flow to the Firm in the next period WACCbf = Weighted average cost of capital before taxes gn =Growth rate Pre-tax WACC= d Ke V E K V D
Choosing between FCFF and CCF depends uniquely on their ease to use, “determined by the complexity of applying the method and the likelihood of error” (Ruback 2002). Generally, this choice of method is determined by the form of the cash flows projections. When the cash flows do not include the interest tax shields and the target capital structure is not expected to change over time, one should apply the FCFF. Whereas if the there is a financing plan with detailed information, the CCF is, usually, the best option.
When comparing the CCF with the APV method, the author states that APV results in a higher valuation than the CFF, because it uses a lower discount rate in the computation of the tax shields. While CCF discounts the tax shields with the cost of assets, the APV discounts tax shields using the debt rate. Being the first one higher than the last one, APV considers interests tax shields to be less risky than the firm as a whole.
Nevertheless, Booth (2007) disapproves the use of CCF model, claiming that it does not offer any advantage over the traditional WACC approach.
20
3.2.2. Equity Valuation
3.2.2.1. Free Cash Flow to Equity – FCFE
Damodaran (2006) defines FCFE as a direct valuation method consisting in discounting the expected cash flows to shareholders, at an appropriate rate of return appropriate regarding the level of risk in the firm.
Equity value =
n t 1 t e t t k 1 FCFE Where,FCFE = Free Cash Flow to Equity Ke = Cost of Equity
The FCFE corresponds to the value that, after the company reinvests enough to maintain its business running and after repay most of its debt obligations available to be paid as dividends.
FCFE = Net Income – (CAPEX - Depreciation) - Change in Non-cash Working Capital + (New Debt Issued - Debt Repayments)
Damodaran (2006) noticed that the disadvantage of FCFE that cash flows relating to debt have to be considered explicitly. While FCFF is a pre-debt cash flow, FCFE has to take into account new debt issuances and debt repayments. The author argues that FCFE predictions are much more difficult than optimal target of debt-to-equity ratio, required for the WACC discounting. Koller et al. (2005) follow the same rationale, considering that the method becomes pretty difficult to implement due to the fact that it requires forecasting changing debt and interest payments on a year-to year basis.
Nevertheless, both models are theoretically equivalent and result in the same if one adopts consistent assumptions regarding the financial leverage (Damodaran 2006).
3.2.2.2. Dividend Discounted Method – DDM
DDM valuation is based on the premise that when investors purchase stock in publically traded companies, they generally expect to receive two types of cash flows: dividends during the holding period and an expected price at the end of that period (Damodaran
21 2006). Since the expected selling price is itself defined by future dividends, the value of the stock equals present value of all dividends through infinity.
Value of the firm =
n t t Ke gn Dividend 1 1 Where, n
g = Expected Growth Rate
It is important to notice that, in the dividend discount model, the expected growth rate can be written as a function of the retention ratio and the return on equity.
Expected Growth Rate = Retention ratio * Return on Equity
This model, although theoretically simple, lacks support from practitioners, who argue that it is tremendously difficult to implement (Vernimmen et al. 2005). The dividend’s growth rate is the biggest concern since it is not only affected by economic performance, but also by other factors such as gearing or the payout ratio. This model can turn quite tricky in situations when a firm opts to accumulate cash instead of reward the shareholders (even if it is affordable) resulting in an underestimation of the true value of equity (Damodaran 2002)
Nonetheless, Damodaran (2006) states that DDM requires fewer assumptions than other DCF methods since in the end it boils down to defining a growth rate for dividends.
3.3. Relative Valuation – Multiples
In a relative valuation - peer comparison – one values an asset “based upon how other similar assets are priced in the market”. Making use of this approach, one estimates the value of a stock by looking at the market pricing of “similar” stocks. (Damodaran 2006). This rationale requires markets to correctly assess the value of the firms, at least in average. Otherwise, if the markets systematically underprice or overprice an entire sector, it can lead to a mispricing of the intrinsic value of the asset.
22 Since multiples reflect the market’s perceptions of a firm’s growth expectations, two firms with similar perspectives and operating features should have similar multiples. Using multiples may improve DCF valuation due to the fact that cash flows do not provide any information on the competitive and strategic positioning of the company (Koller et al. 2005).
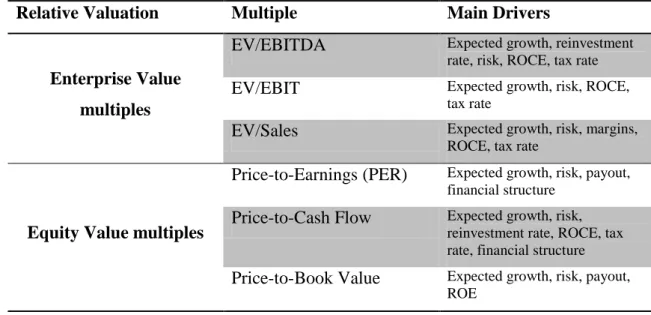
In multiples valuation, it is essential to correct any differences concerning specific characteristics of the assets. Usually, the firm is valued making use of a multiple regarding the profit-generating capacity. While in the company value have to be compared with operating data, such as EBITDA, the equity value need to be compared with data after debt expenses, such as net profit or cash flow. According to Vernimmen (2005) there are two types of multiples: market multiples and transaction multiples. For market multiples, “a peer group comparison consists in setting up a sample of comparable, listed companies that have not only similar sector characteristics, but also similar operating characteristics” whereas for transaction multiples one “should use transactions in the same sector as the company you are trying to value”.
Figure 2: Relative Valuation’s multiples and main drivers
Relative Valuation Multiple Main Drivers
Enterprise Value multiples
EV/EBITDA Expected growth, reinvestment rate, risk, ROCE, tax rate EV/EBIT Expected growth, risk, ROCE,
tax rate
EV/Sales Expected growth, risk, margins, ROCE, tax rate
Equity Value multiples
Price-to-Earnings (PER) Expected growth, risk, payout, financial structure
Price-to-Cash Flow Expected growth, risk, reinvestment rate, ROCE, tax rate, financial structure Price-to-Book Value Expected growth, risk, payout,
ROE
Source: Damodaran (2006)
In order to calculate the firm’s value using a multiples valuation, one simply multiply a value driver such as sales, earnings, EBITDA, cash flows or some other industry specific metric, by the corresponding multiple. These multiples are basically an average of the ratios of the selected value driver for all the existing comparable companies (Liu et al. 2007).
23 When comparing with absolute valuation, the multiples approach has relative advantages, such as its simplicity and quickness, as well as being relatively straightforward and easily understandable.
Relative valuation, nevertheless, is very difficult to implement in individual companies’ valuation with no existing comparable firms. Comparable companies are basically firms with similar expected growth rate, ROIC, cost of capital and capital structure (Koller et al. 2005). Nevertheless, according to the same author, having the same value drivers may be very useful to multiples valuation, but “differences in accounting, the effects of inflation, cyclicality, and other factors can distort multiples”.
One of the most used Enterprise Valuation multiples is the EV/EBIT, which allows comparing the true profit-generating capacity of the various companies. An essential issue in order to get a truthful comparison is the need to normalize the earnings, excluding all non-recurring items. On the other hand, the EV/EBITDA multiple can eliminate differences between diverse depreciation policies and capital structures. Concerning equity multiples, they all present stock price or market capitalization in the numerators and book value for figures such as earnings, cash-flows or equity capital in the denominator. Attention shall be paid to the fact that the company’s capital structure may affect these multiples, creating distortions in the valuation. This requires further attention in the definition of the peer group. Goedhart et al. (2005) argues that it is key to look at differences among firms within the same sector, being essential to identify a good quality peer group, which may be a difficult task.
The PER ratio has the ability to capture risk and growth of a stock. It means that one can fairly assess the value of a firm based on the PER of its comparable companies which present similar growth and risk. Boatsman and Baskin (1981) claim that this valuation method is particularly useful when the firm’s value is not observable. Alford (1992) explores few criteria for the comparable firms, including size (a surrogate for risk), ROE (a surrogate for growth) and industry membership. Although Bhojraj and Lee (2001) defend that industry membership is not a reliable condition for company comparability, according to the author mentioned above, the industry membership is the major element, capturing the cross-sectional differences in the Price-Earnings ratio and size.
24 It is interesting to notice that, if a firms is expected to have a 100% payoff ratio and no earnings growth, then the shareholders’ required rate of return is the inverse of the PER (Vernimmen, 2005).
Regarding the PBV multiple, it attempts to capture future value creation. Given that, under perfect markets, the discrepancy between the market value and book value is the value added, the PBV corresponds to the present value of future residual income. Past literature relates PBV to return for shareholders’ profitability, risk and growth.
Both Chan and Chen (1991) and Ohlson (1995) studied the importance of PBV in valuation. While the first authors suggest that the PBV multiple represents the production efficiency of a firm, the last one claims that PBV reflects a firm’s excess rate of return caused by the firm’s superior performance.
Cheng and McNamara (2000) found that the P/E multiple valuation method performs better than the PBV valuation approach, but, more important than that, a combination of P/E and PBV method outperforms both P/E and PBV individual methods.
3.4. Contingent Claim Valuation - Option Theory
According to Vernimmen (2005), the contingent claim valuation allows analysts to value flexibility which is particularly relevant when valuing projects. This methodology is mostly used when deciding whether or not to explore an opportunity (Luehrman 1997).
Although it is not a common valuation approach, it can be appropriate to particular cases such as companies with a single product, companies in a commodity-based industry, or companies in (or near) financial distress” (Koller et al. 2005).
According to Damodaran (2002), “an option can be valued as a function of the following variables - the current value, the variance in value of the underlying asset, the strike price, the time to expiration of the option and the riskless interest rate”.
Due to this model’s complexity and the irrelevance for my valuation case, I will no further discuss this subject.
25
4. Novabase – Company Presentation
4.1. HistoryNovabase, headquartered in Lisbon, Portugal, was founded in 1989 as a software-house, specialized in customized solutions development. Nowadays, it is the leading Portuguese company in IT business solutions with a turnover (2011) of €229,6 million, being almost 20% of it generated outside Portugal.
During its first years of existence, the company has developed a notable list of key clients, mainly in the public sector (agriculture, social security etc.) and created its own products, such as GEMEO (occupational medicine), GPLO (work licensing) and NOVAMAIL (correspondence management and archiving).
Then, in a second stage of development, Novabase developed services for other business sectors, essentially for the financial market. Along with this evolution, the company set up a more horizontal structure in order to smooth the launch of new service offers and developed new areas of expertise - workflow, BI, e-learning etc.
In 2008, after a major reorganization, Novabase is now organized in four different business areas: Business Solutions & Consulting; Infrastructures & Managed Services (IMS); Digital TV and Venture Capital.
Novabase, despite its independency, has important partnerships with important players in the market, such as Microsoft, Sony, Cisco and SAP, which ensures the customer access to industry-leading solutions in each area.
The company’s operations are now worldwide, being present in 33 countries on 5 continents. With over 2000 employees Novabase currently has offices in Portugal, Spain Germany, France, the Middle East and Angola.
26
4.2. Structure
Novabase’s activity is now structured around six industries: Telecoms & Media, Financial Services, Government & Healthcare, Energy & Utilities, Aerospace & Transportation and Manufacturing & Services sectors. Each industry has a specialized team who provide personalized products and services.
In 2011, a new offer structure was defined, consisting of four business areas: Business Solutions, Infrastructures & Managed Services, Digital TV and Venture Capital. (For a full map of the competences used in each area see exhibit 1, 2 and 3)
Figure 3: Industries and Business Areas
Source: Novabase Annual Report
4.2.1. Business Solutions (BS)
Novabase’s Business Solutions area is responsible for conceiving, designing and deploying individual solutions for the customers. This business area incorporates diverse competencies in technology, management, design and business expertise.
27 BS segment includes today the business of Novabase Consulting and the areas of Ticketing and Managed Services previously considered within IMS segment.
4.2.2. Infrastructures & Managed Services (IMS)
This Novabase’s business area, making use of its engineering and consulting expertise in information and communication technologies, designs, plans and deploys complex infrastructures. Moreover, in this area, the company strives to transform, manage, operate and optimize these assets through comprehensive projects such as outsourcing services.
IMS’s IT management services and solutions include auditing, consulting and training services in process’s reengineering and automation, streamlining, risk and internal control, IS/IT strategic plans, best practices integration, certification in standards and compliance with regulations.
4.2.3. Digital TV (DTV)
Digital TV is a product and service portfolio including all set-top boxes available on the market, through licensing, middleware platforms and solutions.
The customers in this area include set-top box manufacturers (OEM/ ODM market), cable and pay-TV operators (operator market) and residential customers (retail market). This division has been the least profitable. Owing to the saturation on the market and the consolidation taking place, the business saw a constant shrinkage since 2008, dropping to 21% of the total operations by 2010.
4.2.4. Venture Capital
Novabase Capital, Sociedade de Capital de Risco, SA is a venture capital firm owned entirely by Novabase SGPS, SA with the purpose of finding and supporting Portuguese ICT business projects – in early development or expanding – with high value potential in collaboration with Novabase.
Novabase Capital has ownership in three venture capital funds totaling €23.5 million in capital: FCR Novabase Capital, FCR Novabase Capital Inovação e Internacionalização and FCR IStart I (the first two managed by Novabase Capital).
28
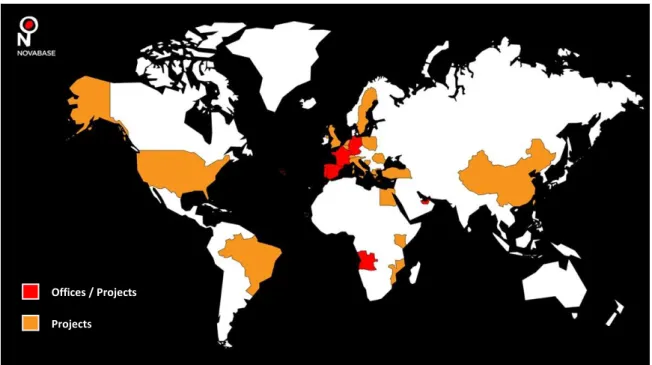
4.3. Geographical Presence
Novabase has now offices in five countries beside Portugal – Spain, France, Germany, Angola, United Arab Emirates – and projects in twenty two other countries.
Figure 4: Novabase’s World
Source: Novabase Annual Report
Despite the current strategy of Internationalization, Portugal is still the geographical market which generates the major slice of the turnover (80%) followed by Africa and Spain (see exhibit 5).
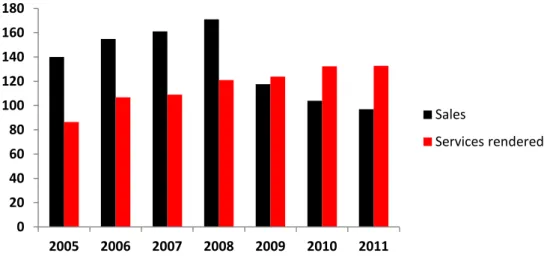
4.4. Financial Performance
Novabase’s turnover in 2011 was €229,6 million, a decrease of 2,8% compared to €236.3 million in 2009. It is the second straight year of decreasing turnover due to due to the contraction of business in Portugal in the product component. It is interesting to notice that in the past years, despite a declining in Sales, there has been a continuing growth of the Services Rendered in the past years which reveals that IT services remain to grow whereas sales of both hardware and software have been decreasing. This subject will be further analyzed.
Offices / Projects Projects
29 Figure 5: Novabase’s Turnover (in million €)
Source: Novabase Annual Report
It is important to notice that Business Solution and IMS represent 76,5% of the total turnover (39% and 37,5%, respectively). In the other hand, the Venture Capital contributes merely with 5% (see exhibit 5).
In 2011, Novabase reached an EBITDA of €14,2 million 2011, a decrease of 35.7% compared to €22.2 million in 2010, (there was no falling in EBITDA since 2008). This decline reflects the costs associated with the internationalization and the intense competitive pressure which affected mainly the IMS and DTV businesses (see exhibit 7), as well as the product sales’ profitability.
Figure 6: Novabase’s EBITDA (in million €)
Source: Novabase Annual Report
0 20 40 60 80 100 120 140 160 180 2005 2006 2007 2008 2009 2010 2011 Sales Services rendered 14,18 23,04 21,05 21,73 22,17 14,24 0 5 10 15 20 25 2006 2007 2008 2009 2010 2011
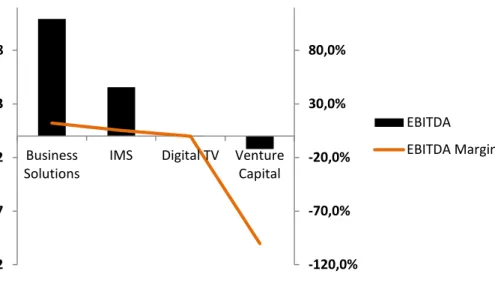
30 The only two segments which presented positive EBITDA were Business Solutions and IMS – €10,9 million and €4,6 million – whereas Digital TV presented a slightly negative EBITDA and the Novabase Capital had a 100% negative EBITDA margin.
Figure 7: Novabase’s EBITDA (in million €) and EBITDA margin (%) by Business
Area
Source: Novabase Annual Report
Finally, the overall EBITDA margin was 6.2%, below the 9.4% margin obtained in 2010.
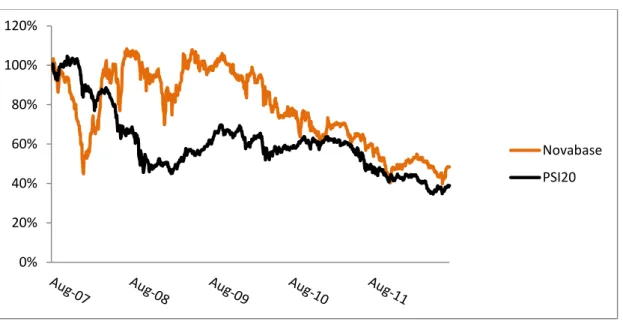
4.5. Stock Performance
Novabase stock has devaluated 52 % since 2007 compared to a 61% devaluation in the Portuguese Index – PSI-20. This is a result of the global financial crisis followed by the European Sovereign Debt crisis and economic downturn caused by them.
In 2007 the Novabase’s stock performance was weaker than the PSI-20’s which, along with the entry of new market players with significantly higher liquidity levels, caused its exit from the Portuguese index. However in 2008, after the mentioned major restructuring, Novabase’s stock has recovered its value contrary to the loss in the value of PSI-20 due to the Lehman Brothers’ bankruptcy and the following global crisis.
-120,0% -70,0% -20,0% 30,0% 80,0% -12 -7 -2 3 8 Business Solutions
IMS Digital TV Venture Capital
EBITDA EBITDA Margin
31 Since 2010, with the beginning of the European Sovereign Debt crisis which deeply affected the Portuguese market, Novabase and PSI-20 have been presenting similar performance.
Figure 8: Novabase and PSI 20 stock performance
Source: Bloomberg
4.6. Strategy
Given the difficulties on the domestic market, all the attention is given to internationalization. In the initial phases of its internationalization, Novabase is pushing into developing its presence in Angola and Spain.
The company saw its exports growing by 30% in 2011 to account for almost 20% of the total business, giving a strong leverage to the overall turnover. Particularly in Angola, the company is going after projects in the financial services and telecommunications. For 2012, Novabase provides a guidance that illustrates Novabase is committed to further overall growth, put on the back of the international expansion and the recovery of the domestic profitability through an increase in Novabase’s competitiveness.
The Digital TV business provides more opportunities for international expansion, and the emerging countries are clearly targeted, particularly the BRIC ones.
0% 20% 40% 60% 80% 100% 120% Novabase PSI20
32 One the local market, as the public sector is expected to cut on their IT expenditure, Novabase tries to balance it with its clients in the private sector. Utilities is one of the targeted areas by Novabase in Portugal, while in most other industries the company is rather safe-guarding its business and defending the existing contracts and deals. Since there is little space to grow in the Portuguese marketplace, the strategy focuses on winning market share via contractual stability and internationalization.
In technology, Novabase is looking to find its way into the Cloud market in the medium term, especially since the company has been at both ends of the IT landscape: application and infrastructure.
The Novabase Capital unit continues to go after opportunities with technology start-ups.
4.7. Novabase’s positioning among its competitors
According to Pierre Audoin Consultants, IBM is, in Portugal, leader in both Software & IT services, IT services, Project Services and Outsourcing whereas Novabase’s position fluctuate from second to fourth in the domestic markets in which it is present.
Figure 9: Novabase’s positioning in PAC’s rankings - Portugal
Segment Rank Leader
Software and IT services # 3 IBM
System Infrastructure Software Not present Microsoft
Tools Not present Microsoft
IT services # 2 IBM
Hardware Maintenance Not present IBM
Project Services # 2 IBM
Outsourcing # 4 IBM
33 In the IT Services segment, Novabase is leader in the public sector playing minor roles in sectors as Manufacturing, Banking or Insurance.
Figure 10: Novabase’s positioning in PAC’s IT Services rankings - Portugal IT Services
Sector Rank Leader
Manufacturing # 4 IBM Banking # 4 IBM Insurance # 4 IBM Public # 1 Novabase Telecom # 2 IBM Utilities # 4 Logica
Retail & Wholesale # 3 Glintt
Services and Consumers # 2 IBM
Transport # 2 Amadeus
Source: Pierre Audoin Consultants
4.8. SWOT Analysis
Strengths Weaknesses
Plan-Build-Run capabilities Clear leader in the Public sector
Critical mass relative to most other local IT services providers; the largest domestic IT services provider - at a comfortable distance from the second ranked
Coverage of both the application and infrastructure services domains
One of the leaders in SAP services
Still not clearly positioned in the outsourcing business - perceived as more present in the infrastructure management than in apps outsourcing
Non-IT and resale account for 44% of the Business
The Digital TV business delivers low profitability, while the international market is under consolidation
34
Opportunities Threats
Various forms of outsourcing, ranging from managed services to AM
Incremental development and maintenance in banking and telecom Niche areas in utilities and adjacent to EDP Cloud and Mobility as the next technologies impacting first the infrastructure, then the application layer Portuguese-speaking African countries
Tough competition from large international players (IBM, Accenture Logica, HP, Capgemini etc.)
Dependence on the Portuguese public sector, which is to shrink in the next couple of years
Softness of clients on domestic market, inhibiting development plans abroad and diversification
Further margin deterioration, especially in its Digital TV business
4.9. Shareholder structure
The main shareholders are Novabase’s members of the Corporate Boards, holding 37,57% of the stock. These shareholders signed new shareholders’ agreement, valid until April 30th 2015, which sets that these shareholders exercise their voting rights in Novabase General Meetings in the way approved by the majority in the following matters: dividend policy, share capital increases and reductions, composition of corporate bodies, merger or de-merger of Novabase, and others. This agreement ensures shareholding stability for the next three years and therefore stability of management and control of corporation. This can also mean that the stock has less speculative value. Other important shareholders are Partbleu SGPS, Grupo Banco Espírito Santo SA and Santander Asset Management owning 24,44% of the company (10,13%, 9,37% and 4,94% respectively). Novabase is floated in the stockmarket, having a free-float of 25%.
35 Figure 11: Shareholder’s Structure
Source: Novabase Annual Report
4.10. Dividend Policy
Until 2009, Novabase had a no-dividend policy, preferring to reinvest the profits in the company’s activities instead of distribute dividends.
In 2009 Novabase paid to its shareholders the first dividend since it is listing on the stock exchange, with an extraordinary dividend distribution, along with return of capital to shareholders, presenting a payout ratio of 121%.
For the next years Novabase has a solid dividend policy which considers an annual payment of a dividend in the amount corresponding to between 30% and 40% of the consolidated net profit of each financial year. This strategy has already been followed in the previous two years despite the tremendous downturn in the profits.
Figure 12: Novabase’s Dividend Policy (in million €)
2009 2010 2011
Profit of the year 13,05 13,69 2,94
Dividend 15,70 4,08 0,94
Payout Ratio 120% 30% 32%
Source: Novabase Annual Report
Shareholders' Agreement Partlbeu SGPS Group Banco Espírtio Santo
Santander Asset Management Others
36
5. Industry Overview
5.1. Information TechnologyIn this section I will briefly overview the industry of Information Technologies at a time that they are present in almost every dimension of the economy, business and personal life. Information Technology is defined by the Information Technology Association of America as “the study, design, development, implementation, support or management of computer-based information systems, particularly software applications and computer hardware”.
IT is an ever-changing industry, where the demand for new technological solutions and a market constantly and rapidly evolving, obliges the IT players to a persistent investment on innovation and new solutions to satisfy its customers’ needs.
The great majority of the IT firms lives in frenzied innovation challenge, with an incessant need of continuous reinvention. When looking to the main companies such as Microsoft, Hewlett-Packard, Google, Cisco Systems or IBM, one can easily observe this constant effort in the pursuit of the next revolutionary technology that may overtake the market.
The information technology industry, with an increased productivity, particularly in the developed world, has become one of the most robust industries worldwide. Helping many other industries in their own development, assuring efficient utilization of skilled labour forces and easy accessibility to information, IT industry has been a key driver of global economic growth and a major source of employment.
European Commission estimates that the investment in IT is responsible for almost an half of the increased productivity in the EU. Being a sector highly dependent on R&D, IT represents about one quarter of the total R&D investment in EU.
The development and evolution of the IT industry changed the ways companies internally organize themselves as well as the way they relate with their stakeholders, namely the suppliers and customers. Nowadays, regardless the industry in which they operate, firms are dependent on IT, to support their business activities or to differentiate themselves from competitors. This necessity leads companies to whether build up their own IT department or outsource IT services from specialized companies.
37 The Information Technology industry consists of all computer, communications, and electronics-related organizations, including hardware, software, and services (these three segments, due to its IT functionality, are the ones used when sizing the market in the next chapter). Completing tasks using Information Technology results in a rapid processing and information mobility as well as in an improved reliability and integrity of processed information.
5.2. Worldwide Market
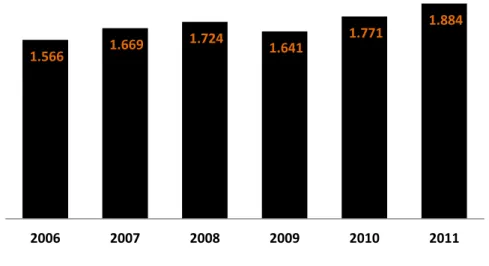
In September 2008, the bankruptcy of Lehman Brothers led to an unprecedented fall in confidence of both consumers and business, generating a wave of destocking, fall in production, trade and capital investment. The collapse of world trade was unprecedented. During the first quarter of 2009, world exports in value terms were 31 percent lower than one year before and world imports 30 percent lower. Of course, the IT industry did not escape the worst stage of the world economic crisis.
Figure 13: Worldwide IT Spending (in billion $)
Source: IDC Reports
But the crisis was short lived. Concerning the Worldwide IT spending, there was a decline in 2009 - the peak of the crisis - for the first time in the past few years but it was followed by a rapid recuperation in 2010, exceeding the pre-crisis values. The biggest reason why this industry remained strong was due to the fact that business models are changing, going online, web-enabling everything they touch. Compliance is also one of
1.566 1.669
1.724
1.641 1.771
1.884
38 the drivers, being just not an option to cut. Nevertheless, during the recession, the IT industry was sustained by a wave of innovations combining social networks, mobile Internet, cloud computing, and consumer electronics.
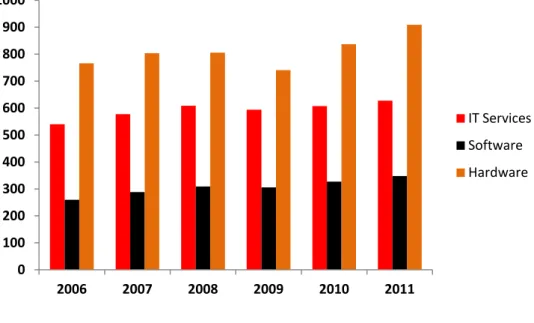
Hardware is the biggest contributor for the worldwide spending, accounting today for almost an half of the market. The Hardware segment was also the segment which suffered the most in 2009, diminishing its revenues by 8% (against a decrease of 2% and 1% of the IT services and Software segments, respectively). This is explained by the fact that Hardware is the easiest segment of IT spend to cut from budgets as there is no ongoing spend to support. Hardware spending is also heavily impacted by the poor access to credit, both for individuals and companies.
Figure 14: Worldwide IT Spending by Segment (in billion $)
Source: IDC Reports
However, the overall worldwide IT industry recovery in 2010 was also led by the strong growth in the IT hardware equipment (12,9%), which was followed by software with 7% and IT services with just 2,2%. In 2011 the overall Information Technology spending continued to grow, but at a lower rate - 6,4% - as well as the diverse sectors which followed an identical trend.
Geographically, the major responsible for this resilience was, as it is possible to see in Figure 15 the Asia/Pacific region increasing its IT spending by 8% in 2010 and 10% in 2011 as well as the North America. Latin America, Middle East & Africa as well as the
0 100 200 300 400 500 600 700 800 900 1000 2006 2007 2008 2009 2010 2011 IT Services Software Hardware
39 Central & Eastern Europe also presented growing IT spending but their contribution to the worldwide spending is still small. The Western Europe region will be discussed individually below.
Figure 15: IT spending by geographical area (in billion $)
Source: IDC Reports
The biggest contributor for the worldwide overall IT spending is, unsurprisingly, the United States of America expending in 2011 $606,2 billion, which corresponds to almost one third of the total. The other biggest spenders are, in decreasing order of expense, Japan, China, UK, Germany, France and Brazil. Naturally, these are also the countries with the largest Gross Domestic Product (GDP).
Figure 16: GDP and IT spending by country (in billion $)
0 200 400 600 800 1.000 1.200 1.400 1.600 1.800 2.000 2006 2007 2008 2009 2010 2011
Central & Eastern Europe Middle East & Africa Latin America Asia/Pacific Western Europe North America 0 2.000 4.000 6.000 8.000 10.000 12.000 14.000 16.000 United States
China Japan Germany France Brazil United Kingdom 0 100 200 300 400 500 600 700 GDP IT Spending
40 Source: IDC Reports and IMF
Beyond the simple rationale that the richest countries being naturally the biggest spenders, it also highlights the importance of IT, being one of the main drivers of the global economy nowadays. Is it is possible to see in the Figure 17, the correlation between the world GDP and IT spending. These results are consistent with Kramer et al (2001) study in which it was found a significant positive correlation between the GDP and IT spending and also with productivity. This finding takes us to the notion of IT-led development, which may be the reason for the strong investments on IT as well as for the consistent growth of this industry and its reliance.
Figure 17: GDP growth vs. IT Spending growth
Source: IDC Reports and IMF
5.3. West European Market
In a vast number of West European countries, the after-effects of the global economic and financial crisis are still having an impact on the economy.
Government efforts to stimulate economic growth in the aftermath of the global economic crisis converted into a serious deterioration of the public finances in many countries. Few countries face now not only a sovereign debt crisis, caused by high government debt burdens but also pressure on European financial institutions related to large holdings of that debt by those same financial institutions. This crisis shifted the
-8% -6% -4% -2% 0% 2% 4% 6% 8% 10% 12% 14% 2007 2008 2009 2010 2011 IT Spending GDP
41 focus to pushing through unpopular and painful austerity measures in order to reduce fiscal deficits and restore public finances in the name of current stability.
In countries such as Italy, Spain, Portugal, Greece and Ireland, due to the high levels of national debt, IT investments in the public sector are subdued and consumer spending is down.
In contrast with others regions in the world, this crisis continued to weigh heavily on IT market developments in Western Europe in 2010 despite an improved investment environment in many countries as well as requirements for upgrades in many technology areas. EU sovereign debt crisis affects economic performance resulting in weaker IT spending.
In 2010, the Western European IT spending presented the second lowest rate among all regions worldwide with 6%, only higher than the Middle East & African rate,
Western European IT expenditure has not fully recovered to the levels achieved in the pre-crisis context of 2008 and, in 2011, Western Europe was the only region in the entire world to decline its overall IT spending, decreasing it by 0,2% mainly due to hardware segment.
Figure 18: European IT Spending by Segment (in billion $)
Source: IDC Reports and IMF 0 50 100 150 200 250 2006 2007 2008 2009 2010 2011 IT services Software Hardware