Diversity patterns of
honey bee (Apis
mellifera L.)
populations from the
archipelago of the
Azores: insights from
mtDNA and wing
geometric
morphometrics
Helena Mendes Ferreira
Mestrado em Biodiversidade, Genética e Evolução
Departament o de Biologia2017
Orientador
Maria Alice Pinto, Professor Doctor, Polytechnic Institute of Bragança (IPB), Mount ain Research Centre (CIM O) - Bragança, Portugal
Co-orientador
Miguel Carneiro, Doctor, Research Centre in Biodiversity and Genetic Resources (CIBIO/ InB IO) - Vairão, Portugal
Todas as correções determinadas pelo júri, e só essas, foram efetuadas.
O Presidente do Júri,
“We are all in the gutter, but some of us are looking at the stars.”
Firstly, I would like to thank to my thesis supervisor professor Maria Alice Pinto for accepting me and for the extraordinary guidance through this study. I am deeply grateful for everything you have done for me, mainly for always being available to clarify all my doubts, for being patient and for everything I had the opportunity to learn with you. I had the opportunity to grow as a person and, above all, to grow as a professional. It was an honor to have you as my supervisor.
Secondly, I would also want to deeply thank Miguel Carneiro, for having accepted to be my co-supervisor and for all the good advices during my thesis writing, mainly during the final phase.
I would like to express my feeling of deep gratitude to Professor Tiago Francoy for having accepted the challenge to teaching me geometric morphometrics, and for the extraordinary guidance through all this process.
I also want to express my deepest gratitude to all veterinarians and technicians of the "Direção Regional da Agricultura e Desenvolvimento Rural dos Açores" who have played a key role in this study by collecting all the samples across the Azores , namely: Franck Aguiar, Nuno Salvador, Janyne Sousa, Ivan castro, Célia Mesquita, Ana Jorge, José Dias, Paulo, Rico, Pedro Leal, Vagner Paulos, Luis Xavier, Luís Silva, Martins Silva, Carlos Gouveia, Ana Carina Coimbra, João Ramos, João Arruda, Edgardo Melo, João Luís, and Moniz da Ponte. Special thanks are due to Paula Vieira for the coordination of the sampling and for the unconditional support. Finally, I would like to thank the "Director Regional de Agricultura", Dr. Fernando Sousa, for authorizing the sampling.
I am so grateful to my friends and also my work colleagues: Dora, Cátia, Julio, Andreia, Paulo (the best beekeeper ever), Fernando, Angelo and the newcomer Miquelina. Thank you for always pushing me and motivating me and for all the support, love and beers (right Andreia?) in the bad and also in the good moments. You were incredible! I could not ask for better friends, with whom I took great pleasure in working and sharing ideas and knowledge. Dora and Cátia, thank you for being always by my side during this long journey, and for the super great time we spent together in that yellow attic. Dora, without you I would never have known the fantastic world of honey bees. Thank you for never giving up on me, and always believe in me and my capacities.
A thank you to all the people with whom I had the opportunity to meet during the time I was in Brazil and especially for the warm welcome. I wanted to express my gratitude to all researchers and technicians in LabApis in Ribeirão Preto, especially
for patiently having clarified all my doubts and sharing all your knowledge with me. You were certainly one of the most important people during this journey. Thank you for all the love and support.
I would also like to show my gratitude to my lovely friends, Ilda, Marta and Sara, for having been patient with me, and always having the right words of support and motivation which contributed a lot for this work. Ilda, thank you so much for always being available to me when I most needed.
I would like to thank to my friend Rui, for all the scientific debates and the thousand of discussions about the global problems. You know that I always have the best arguments and you never admit, but you know that I'm always right. Thank you for always listening all my problems and concerns.
A special thank to my parents, to whom I owe the privilege of being able to do this master’s and this thesis. Thank you for always believing in me and for encouraging me to pursue my dreams.
A huge and special thank to my sisters, Joana and Carla, my brother Ricardo and to Lúcia and Fred. Thank you for always being available to me, for all the love you shared. Thank you for tolerating my bad mood whenever things did not go as expected. Joana, I'm so sorry for all the invitations I had to refuse to go to the cinema, to go shopping, to go for a walk, to go for a coffee. I promise to reward you.
Thanks to my lovely sister Ana. You are a great part of me, and it is in you that I always seek the strength to continue my journey. You cannot imagine how grateful I am to have had the opportunity to meet you and be a sister. Thank you for always light all my steps. I miss you so much.
A huge thank to my little nephews, Maria and João. Thank you for always distracting me from my work, and reminding me of how good it was to be your age. I loved sharing this journey of my life with you. You were undoubtedly the best breaks of my work.
I would like to thank to my sweet grandparents, for the love, care and support. Finally, I want to thank to one of the most special person I know: my boyfriend Raul. It was great pleasure to make this journey by your side. Thank you for selfless love and for support when I thought it was impossible to move on. No word I can pronounce will express my feeling of gratitude to you. This was just the beginning of our lives.
This study was partially funded by the research project "BEEHEAL: Promoting bee health for sustainable agriculture". This project is funded through the ARIMNet2
European Union’s Seventh Framework Programme for research, technological development and demonstration under grant agreement no. 618127.
Os padrões de diversidade genética de populações de abelha mellifera (Apis mellifera L.) são praticamente desconhecidos nos Açores, contrariamente ao de outros arquipélagos da Macaronésia, como as ilhas Canárias e a Madeira. De forma a tentar preencher esta lacuna, um total de 473 colónias de abelha melífera foram amostradas ao longo das oito ilhas dos Açores ocupadas por esta mesma abelha para posterior análise mitocondrial (mtDNA) e variação morfométrica das asas. A origem do mtDNA foi obtida usando-se a técnica PCR-RFLP da região intergénica tRNAle u-cox2, técnica conhecida como teste DraI. As diferenças morfológicas na forma das asas das populações das diferentes ilhas foram analisadas através da morfometria geométrica, usando-se 19 pontos anatómicos distribuídos ao longo da venação das asas. Para além das 473 colónias dos Açores, foram avaliados os padrões morfométricos de uma coleção de referência contendo 711 colónias de A. m. iberiensis, 11 colónias de A. m. ligustica, e 15 colónias de A. m. carnica.
Os padrões maternos foram razoavelmente congruentes com os padrões morfológicos obtidos para as asas. O teste DraI permitiu a identificação de 13 haplótipos diferentes, incluindo um novo haplótipo (A64’). Dos 13 haplótipos, 10 pertencem á linhagem Africana (linhagem A), dois à linhagem da Europa ocidental (linhagem M) e um à linhagem da Europa do leste (linhagem C). Entre as sub-linhagens Africanas conhecidas, a sub-linhagem AIII foi a mais frequente (62.38%) e apenas 3% da sub-linhagem AI foi encontrada no Faial. Os dados do mtADN sugerem introduções históricas de colónias de abelha melífera nos Açores, originárias do norte de Portugal, onde uma frequência elevada de haplótipos de ascendência da sub-linhagem AIII é encontrada. Para além das introduções históricas, os padrões maternos das populações Açoreanas parecem ter sido moldados por recentes importações de raças comerciais de linhagem C, como é sugerido pelas elevadas frequências de haplótipos de linhagem C encontrados no Pico, Faial e Graciosa.
Os resultados obtidos para a morfometria geométrica revelaram o poder da venação das asas para diferenciar as populações nos Açores e também permitiram distingui-las das subespécies da coleção de referência. Os padrões morfométricos das asas mostraram que, no cômputo geral, as populações dos Açores exibem uma relação próxima com A. m. iberiensis, contudo, algumas populações, especialmente da Graciosa, tendem a ficar agrupadas com A. m. ligustica e A. m. carnica.
O efeito fundador resultante das introduções de A. mellifera em períodos passados, o ambiente insular particular, a barreira ao fluxo de genes devido ao isolamento geográfico e o fluxo genético associado à atividade apícola mais recente
Palavras-chave: Apis mellifera, abelha melífera, Arquipélagos dos Açores,
The patterns of genetic diversity of the honey bee (Apis mellifera L.) populations from the Azores are virtually unknown, contrary to other Macaronesian archipelagos such as the Canary Islands and Madeira. In an attempt to fill this gap, a total of 473 honey bee colonies were sampled across the eight islands of the Azores occupied by honey bees, which were then surveyed for mitochondrial DNA (mtDNA) and wing morphometric variation. The mtDNA origin was assessed using a PCR-RFLP technique of the intergenic tRNAleu-cox2 region, known as the DraI test. Morphological differences in the wing shape among the populations of the different islands were analyzed with the geometric morphometric approach using 19 anatomical landmarks distributed along the wings venation. In addition to the 473 colonies of the Azores, morphometric patterns were assessed on a reference collection comprising 711 colonies of A. m. iberiensis, 11 colonies of A. m. ligustica, and 15 colonies of A. m. carnica.
Maternal patterns were reasonably congruent with the morphological patterns obtained with the wings. The DraI test allowed identification of 13 different haplotypes, including a novel one (A64’). Of the 13 haplotypes, ten belong to the African lineage (lineage A), two to the western European lineage (lineage M), and one to the eastern European lineage (lineage C). Among the known African sub-lineages, sub-lineage AIII was the most frequent (62.38 %) and only 3% of sub-lineage AI was found in Faial. The mtDNA data suggest that historical introductions of honey bee colonies in the Azores originated from the northern part of continental Portugal, where a high frequency of haplotypes of sub-lineage AIII ancestry is found. In addition to historical introductions, the maternal patterns of the Azorean populations have seemingly been shaped by recent importations of commercial breeds of C-lineage ancestry, as suggested by the high frequency of C-lineage haplotypes found in Pico, Faial and Graciosa.
The results obtained with geometric morphometrics revealed the power of the wing venation to discriminate different populations in the Azores, and also to distinguish them from the subspecies of the reference collection. The wing morphometric patterns showed that, overall, populations from the Azores exhibited a closer relationship with A. m. iberiensis; however some populations, especially those from Graciosa, tend to be clustered closer to A. m. ligustica and A. m. carnica.
The founder effect resulting from introductions of A. mellifera in historical times, the particular insular environment, the barrier to gene flow due to geographical isolation, on one hand, and the contemporary human-assisted gene flow associated with beekeeping activity, on the other hand, are non-mutually exclusive factors that have possibly shaped the diversity patterns observed today in the Azores.
i
Table of Contents
List of Tables...ii
List of Figures ...iv
List of Abbreviations and Acronyms ...ix
1. Introduction ... 1
1.1 Brief introduction to the genus Apis... 1
1.2. Evolutionary history of Apis mellifera ... 2
1.3. Mitochondrial DNA surveys in the honey bee ... 6
1.4. The importance of the study of morphological traits ... 12
Objectives ... 15
2. Material and Methods ... 16
2.1. Study Area ... 16
2.2. Sampling ... 17
2.3. MtDNA intergenic tRNAleu-cox2 region... 18
2.4. Geometric Morphometrics of the wings... 19
3. Results ... 22
3.1. Mitochondrial DNA ... 22
3.2. Wing geometric morphometrics... 29
4. Discussion... 48 4.1. Mitochondrial DNA ... 48 4.2. Geometric Morphometrics ... 53 5. Conclusion ... 56 6. References... 58 7. Supplementary Material... 79
ii
List of Tables
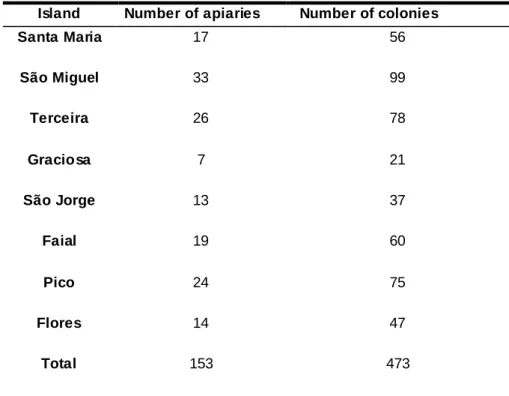
Table 1. Total number of apiaries and colonies sampled in the Azores
Archipelago………18
Table 2. Number of honey bee forewings used through the study………20
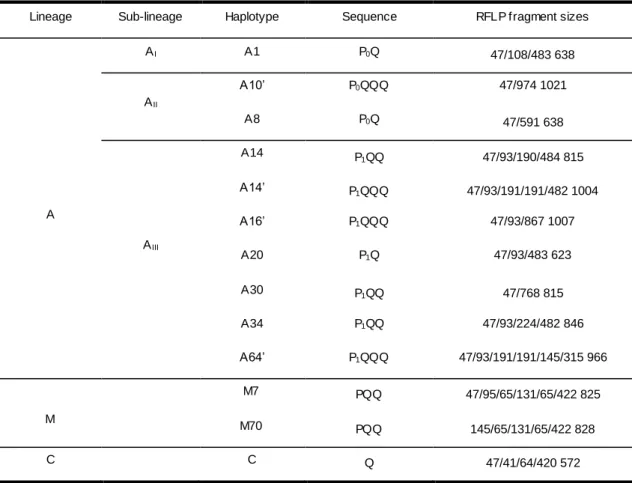
Table 3. RFLP length patterns deuced from the DraI test for the 13 haplotypes found in
the Azores Archipelago………22
Table 4. Distribution of the different haplotypes (number/frequency) and diversity
measures for each of the eight islands sampled in the Azores. Haplotypes are grouped by lineage (A, M, C) and African sub-lineage (AI, AII,
AIII)………25
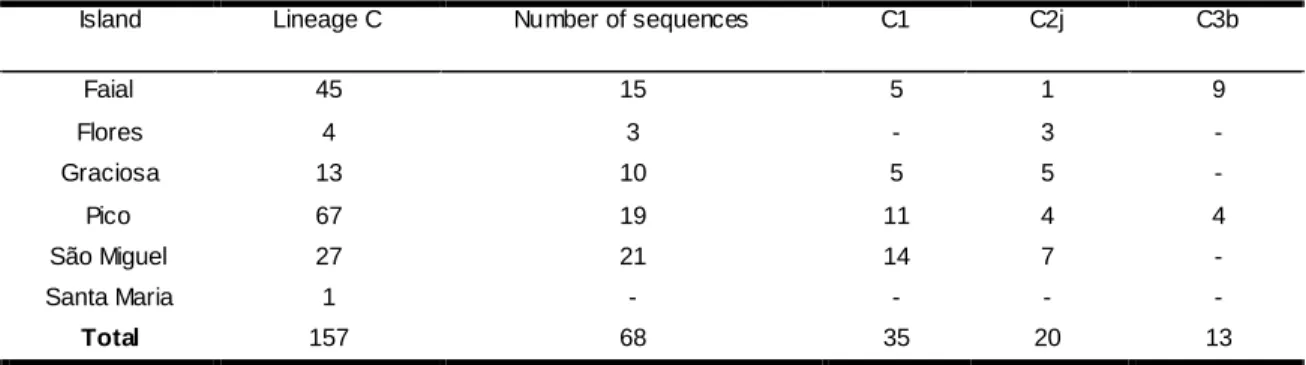
Table 5. Distribution of C-lineage haplotypes of the 69 sequenced Individuals across
the Azores………..28
Table 6. Relative contributions of each anatomical landmark for the variation observed
in the wings of honey bee from the Azores Archipelago………...31
Table 7. Canonival variates generated in the CVA and respective variance……...36 Table 8. Procrustes (below the diagonal) and Mahalanobis (above the diagonal)
distances between populations, obtained with the CVA data for the wings of honey bee from the eight islands of the Azores Archipelago. All distances were highly significant (P-value <0.0001)………..38
Table 9. Procrustes (below the diagonal) and Mahalanobis (above the diagonal)
distances, obtained with the CVA data for the wings of honey bee from the eight islands of the Azores Archipelago and the reference subspecies A. m. iberiensis, A. m. ligustica, and A. m. carnica. All distances were highly significant (P-value <0.0001)…43
Table 10. Procrustes (below the diagonal) and Mahalanobis (above the diagonal)
distances, obtained with the CVA data for the wings of honey bee from the Azores Archipelago and populations from A. m. iberiensis from Portugal and Spain. All distances were highly significant (P-value <0.0001)………46
Table S1. Distribution of the 31 susbspecies of A. mellifera according the respective
iii
Table S2. PCR-RFLP assay that have been used to identify honey bee matrilineal
origins (Adapted from Meixner et al. 2013)………..61
Table S3. Beekeeping statistics provided by “Secretaria Regional da Agricultura e do
Ambiente, Região Autónoma dos Açores” for 2014 and 2015, the years when sampling was carried out………..62
Table S4. Procrustes (below the diagonal) and Mahalanobis (above the diagonal)
distances between populations, obtained with the DFA data for the wings of honey bee from the eight islands of the Azores Archipelago. All distances were highly significant (P-value <0.0001)……….63
Table S5. Procrustes (below the diagonal) and Mahalanobis (above the diagonal)
distances, obtained with the DFA data for the wings of honey bee from the eight islands of the Azores Archipelago and the reference samples A. m. iberiensis, A. m. ligustica and A. m. carnica. All distances were highly significant (P-value <0.0001)………64
Table S6. Procrustes (below the diagonal) and Mahalanobis (above the diagonal)
distances, generated with the DFA data obtained for populations from the Azores archipelago, continental Portugal, and Spain. All distances were highly significant (P-value <0.0001)………..65
iv
List of Figures
Figure 1. Phylogeny representing the three clades of Apis. All of the 10 extant Apis
species apart from A. mellifera are found only in Asia. Node I represents the split between A. mellifera and other cavity-nesting bees. Node II represents the most recent common ancestor of extant subspecies of A. mellifera (Adapted from Han et al. 2012)………...1
Figure 2. Map with the geographical distribution of the 31 subspecies of A. mellifera.
The color of the names indicated the respective evolutionary lineage: A-African lineage (red), M-Western and Northern European linage (blue), C- Eastern European lineage (orange) and O- Middle East and Western Asia lineage (green). A. sossimai (Engle 1999), A. m. taurica (Apaltovv1938) and A. m. artemisia (Engle 1999) are subspecies with sparse information on their evolutionary lineage (black) (Adapted from
Chávez-Galarza et al.
2016a)………...4
Figure 3. Three of the four hypotheses proposed for the origin of A. mellifera: (A) An
expansion from the Middle East, involving colonization of Europe via two routes one eastern and one western was first suggested by Ruttner (1978) on the basis of morphometric analyses. This theory fits with the molecular analyses by Han et al. 2012 (B) An expansion from the Middle East, which did not involve the western colonization route into Europe was suggested on the basis of trees constructed from mtDNA (Garnery et al. 1992). (C) An origin in Africa was proposed by Wilson (1971) and an expansion out of Africa via both an eastern and western route was suggested by the analysis of >1000 SNPs by Whitfield et al. (2006) (Adapted from Han et al. 2012)………...5
Figure 4. Map of the study area showing the location of the nine islands of the Azores
archipelago, located in the Macaronesia biogeographical region……….16
Figure 5. Right forewing of an Apis mellifera worker showing the 19 landmarks……..20
Figure 6. Map with the distribution of the different haplotypes identified with the DraI
v Miguel (n=99); Terceira (n=78); Pico (n=67); Faial (n=60); São Jorge (n=37); Flores (n=47); Graciosa (n=21)………...24
Figure 7. Map with the geographical distribution of the different lineages (M, C, A) and
African sub-lineages (AI, AII, AIII) observed in the eight islands from the Azores archipelago. An additional map with the different lineages (M, C, A) and African sub-lineages (AI, AII, AIII) obtained for the Iberian Peninsula by Chávez-Galarza et al. (2017)………..27
Figure 8. Pie charts showing the present (sampling in 2014/2015) mtDNA survey of
honey bees from São Miguel and data from previous studies (sampling in 2006 and 2011) (De La Rúa et al. 2006; Muñoz et al. 2013). The distribution of lineages M and C and African sub-lineages AI, AII, AIII is shown. The pie chart in the line below takes into account the correction of haplotype A9, now A30………29
Figure 9. Procrustes residuals of the 19 landmarks in the veins intersections of the
honey bee wings from the Azores Archipelago. The blue dots represent the mean landmark position and the small black dots forming a cloud represent the landmark positions for individual configurations in the sample. The number of each landmark is indicated by the red numbers………30
Figure 10. Graphs illustrating the shape variation in the honey bee wings from the
Azores Archipelago. Deformation grids of PC1 (A) and PC2 (B) showing the shifts of landmark positions with straight lines with a thin-plate spline. Each line starts with a dot at the location of the landmark in the starting shape (mean shape) and the length and direction indicates the movement of the respective landmark until the target shape. Wireframes of the PCA1 (C) and PC2 (D) showing the 19 landmarks connected with straight lines. The overall mean shape, which is shown with a light blue outline and open dots at the positions of the landmarks, is compared with the target shape represented as a dark blue outline with solid dots. The 19 landmarks are represented in red. ……….32
Figure 11. Diagram showing the percentages of total variance for which the 34 PCs
vi
Figure 12. Scatter plot showing the clusters produced by PCA for the eigh islands of
the Azores archipelago analysed in this study. Faial (FAI), Flores (FLO), Graciosa (GRA), Pico (PIC), São Jorge (SJO); Santa Maria (SMA), São Miguel (SMI), and Terceira (TER). Each circle/elipse represents an island. The PC1 is represented in the X axis and PC2 in the Y axis………...34
Figure 13. Graphs illustrating the shape variation in the honey bee wings from the
Azores Archipelago. a) Deformation grids of CV1 showing the shifts of landmark positions with straight lines with a thin-plate spline. Each line starts with a dot at the location of the landmark in the starting shape (mean shape) and the length and direction indicate the movement of the respective landmark until the target shape. b) Wireframes of the CV1 showing the 19 landmarks connected with straight lines. The overall mean shape is shown with a light blue outline and open dots and the positions of the landmarks are compared with the target shape represented as a dark blue outline with solid dots. The 19 landmarks are represented in red……….35
Figure 14. Scatter plot showing the clusters produced by CVA for the eigh islands of
the Azores archipelago analysed in this study. Faial (FAI), Flores (FLO), Graciosa (GRA), Pico (PIC), São Jorge (SJO); Santa Maria (SMA), São Miguel (SMI), and Terceira (TER). Each circle/elipse represents an island. The CV1 is represented in the X axis and CV2 in the Y axis ………..36
Figure 15. Differences of populations from Graciosa (GRA) and Santa Maria (SMA). A)
The wireframe graph exhibits shape differences, with the light blue outline representing the mean shape and the target shape represented as a dark blue line. B) Results of the linear discriminant analysis of the differences in wing shape. C) Results of the cross -validation test for the discriminant function in the wing shape. In the Y axes are represented the frequencies and in the X axes the discriminant function scores………..………39
Figure 16. Differences of populations from Faial (FAI) and Pico (PIC). A) The
wireframe graph exhibiting slight shape differences, with the light blue outline representing the mean shape and the target shape represented as a dark blue line. B) Results of the linear discriminant analysis of the differences in wing shape. C) Results of the cross-validation test for the discriminant function in the wing shape. In the Y axes are represented the frequencies and in the X axes the discriminant function scores...40
vii
Figure 17. Scatter plot showing the clusters generated by PCA for the eight islands of
the Azores archipelago analysed in this study: Faial (FAI), Flores (FLO), Graciosa (GRA), Pico (PIC), São Jorge (SJO), Santa Maria (SMA), São Miguel (SMI), and Terceira (TER). The reference samples of A. m. ligustica, A. m. carnica and A. m. iberiensis were included in the analyses. Each circle/ellipse represents an island or subspecies. The PC1 is represented in the X axis and PC2 in the Y axis.……….41
Figure 18. Scatter plot showing the clusters generated by CVA for the eight islands of
the Azores archipelago analysed in this study: Faial (FAI), Flores (FLO), Graciosa (GRA), Pico (PIC), São Jorge (SJO), SMA (SMA), São Miguel (SMI), and Terceira (TER). The reference samples of A. m. ligustica, A. m. carnica and A. m. iberiensis were included in the analyses. Each circle/ellipse represents an island. The CV1 is represented in the X axis and CV2 in the Y axis…….………42
Figure 19. Neighbor-joining dendrogram of morphological proximity between the eight
islands of Azores archipelago and the reference samples A. m. iberiensis, A. m. ligustica and A. m. carnica constructed based on the Mahalanobis square distances……….………44
Figure 20. Scatter plot showing the clusters produced by PCA for three populations;
Azores (AZO); Spain (ESP), and Portugal (POR). Each circle/ellipse represents a population. PC1 is represented in the X axis and PC2 in the Y axis.………...45
Figure 21. Scatter plot showing the clusters generated by CVA for three populations:
Azores (AZO), Spain (ESP), and Portugal (Por). Each circle/ellipse represents one such population. The CV1 is represented in the X axis and CV2 in the Y axis. ……….…46
Figure 22. Scatter plot showing the clusters generated by CVA when the variable
lineage/sub-lineage were added, for the eight islands of the Azores archipelago analysed in this study: Faial (FAI), Flores (FLO), Graciosa (GRA), Pico (PIC), São Jorge (SJO), SMA (SMA), São Miguel (SMI), and Terceira (TER). The reference samples of A. m. ligustica, A. m. carnica and A. m. iberiensis were included in the
viii analyses. Each circle/ellipse represents an island. The CV1 is represented in the X axis and CV2 in the Y axis.……….……….47
Figure S1. Map of the Iberian Peninsula with the location of the 237 apiaries sampled
across three transects: Atlantic transect (AT), Central transect (CT), and Mediterranean transect (MT). Map obtained from Chávez-Galarza et al. 2013……….66
Figure S2. Sequence alignment of the intergenic tRNAleu-cox2 region showing variation among haplotypes of C and A lineages. Substitution sites are numbered from 1 to 10. Indels (showed with a dash) are indicated by letters from “a” to “f” with a grey background. DraI recognition sites (TTTAAA) are indicated by nucleotides in black and white background. Unidentified nucleotides are represented by a bold N with a grey background. The absence of the P element characterizes lineage C. Sub-lineage AIII is identified by the P1 element (denoted by the “d1” deletion marked in grey). The haplotype A30, with just a recognition site, was identified not only with the sequence but also with PCR-RFLP band pattern in a 4% wide-range agarose gel……….68
ix
List of Abbreviations and Acronyms
AT: Atlantic Transect
bp: Base pairs
CIMO: Centro de Investigação de Montanha
COX1 gene or COI gene: Cytochrome Oxidase subunit I COX2 gene or COII gene: Cytochrome Oxidase subunit II
CT: Central Transect
CVA: Canonical Variate Analysis CV1: Canonical Variate1
CV2: Canonical Variate 2
DFA: Discriminant Function Analysis DNA: Deoxyribonucleic Acid
DraI: Restriction enzyme from Deinococcus radiophilus that recognizes TTT^AAA sites
DWV: Deformed Wing Virus
E2: Reverse primer
GenBank: Genetic sequence database
H2: Forward primer
Iberian honey bee: Apis mellifera iberiensis
km: Kilometer
km2: Square kilometer
Lineage A: African lineage
Lineage C: Eastern Europe lineage
Lineage M: Western and Northern European lineage Lineage O: Near East and Asia lineage
x
MT: Mediterranean Transect mtDNA: mitochondrial DNA Mya: Million years ago
PC1: Principal Component 1 PC2: Principal Component 2
PCA: Principal Component Analysis PCR: Polymerase Chain Reaction
PCR - RFLP: Polymerase Chain Reaction - Restriction Fragment Length
Polymorphism
P-value: It is a statistical probability of Karl Pearson
RFLP: Restriction Fragment Length Polymorphism
SNPs: Single Nucleotide Polymorphisms
tRNAleu gene: transfer RNA leucine gene
X: Cartesian Coordinate X Y: Cartesian Coordinate Y
': Haplotype with three Q elements %: Percentage
3′ UTR: 3′ Untranslated Region 5′ UTR: 5′ Untranslated Region
1. Introduction
1.1 Brief introduction to the genus Apis
Insects are the most successful and diverse organisms in the world, providing vital ecosystem services as pollination, pest control, decomposition, among others (Losey et al. 2006). Among the insect pollinators, the highlight goes to the bees, which are responsible for pollination of both agricultural crops and wild plants (Potts et al. 2010). The Western honey bee, Apis mellifera Linnaeus 1758, is one of the main pollinators with a high ecological and environmental impact, besides the great economic importance, and is therefore spread across the entire world (Klein et al. 2007; Potts et al. 2010; Breeze et al. 2011; Han et al. 2012). While honey bees and humans present currently a strict relationship, the oldest records date back to 7000 years ago in the cave paintings in Spain that already demonstrate humans collecting honey (Crane 1999).
The honey bee belongs to the genus Apis, which includes ten species divided into three groups: the cavity-nesting bees (A. mellifera, A. cerana, A. koschevnikov, A. nuluensis, A. nigrocincta), the giant bees (A. dorsata, A. laboriosa, A. binghami), and the dwarf bees (A. florae, A. andreniformis) (Arias and Sheppard 2005; Raffiudin and Crozier, 2007) (Figure 1). Based on phylogenetic analysis, A. breviligula and A. indica should be considered as species instead of subspecies and added to the genus (Lo et al. 2010) (Figure 1).
Figure 1. Phylogeny representing the three clades of Apis. All of the 10 extant Apis species apart from A. mellifera are found only in Asia. Node I represents the split betw een A. mellifera and other cavity-nesting bees. Node II represents the most recent common ancestor of extant subspecies of A. mellifera (Adapted from Han et al. 2012).
Two cavity-nesting bees, A. mellifera and A. cerana, were considered the most recently derived sister taxa. Based on sequence data from mtDNA and nuclear loci it is estimated that A. mellifera diverged from the sibling species A. cerana between 6 and 9 million years ago (Cornuet and Garnery 1991; Arias and Sheppard 2005). Apart from A. mellifera, all of the bee species from genus Apis are currently confined to Asia.
Eusocial bees are characterized by the presence of three different castes in the same colony: drones, workers and the queen (Boomsma et al. 2005; Barchuk et al. 2007). Hymenoptera males of the genus Apis are haploid; emerging from unfertilized eggs and die right after mating (Baer 2005; Boomsma et al. 2005). Workers are originated from diploid eggs and are usually sterile. Each colony of A. mellifera possesses normally only one active queen which is able to generate offspring (Barchuk et al. 2007). The nuptial flight of honey bee queens is performed few days after the emergence of the queen and mating takes place in male congregation areas (Baer 2005). Species of the genus Apis are extremely polyandrous. In queens from A. mellifera the number of matting can vary between subspecies (Kraus et al. 2004).
1.2. Evolutionary history of Apis mellifera
After the split from A. cerana, A. mellifera eventually diversified into numerous subspecies and attained its present distributional range in Europe, Africa, Western and Central Asia (Ruttner 1988). Although mtDNA data suggests that the four evolutionary lineages diverged around 0.7 to 1.3 million years ago (Garnery et al. 1992; Arias and Sheppard 1996), recent estimations based on the genetic analysis of 8.3 million SNPs resulting from whole genome sequencing indicate a split from each other around 300 000 years ago (Walberg et al. 2014).
Initially, 25 subspecies were described by Ruttner (1988) based on morphological traits. The advent of new molecular techniques increased this number to 30 (Ruttner 1988; Hepburn and Radloff 1988; Engel 1999; Sheppard et al. 1997; Sheppard and Meixner 2003; Meixner et al. 2011). The 30 subspecies of A. mellifera were grouped in four main evolutionary lineages, showing a particular geographic distribution: African lineage A, Western and northern Europe lineage M, Eastern Europe lineage C and Middle East and Western Asia lineage O (Figure 2). The exactly geographic range and distribution of the different subspecies of A. mellifera are showed in the supplementary material (Table S1). Recently a new subspecies of A. mellifera winter tolerant was described in Xinyuan prefecture, located in Xinjiang Uygur Autonomous Region of China and named A. m. sinisxinyuan (Chen et al. 2016).
According to morphological and molecular data this new subspecies was placed in the lineage M and the estimated time of divergence between A. m. mellifera and A. m. sinisxinyuan is about 132 000 years (Chen et al. 2016). The differences in morphology, behavior and biological traits observed across the natural range of the different subspecies of A. mellifera, are the result of historical patterns of isolation and posterior adaptation to distinct habitats (De la Rua et al. 2009). Furthermore, the native range occupied by the western honey bee, Apis mellifera was extended worldwide to support pollination and for the honey production (Jaffé et al. 2010; Byatt et al. 2015).
Initially, the subspecies described by Ruttner (1988) were grouped, based on morphometric analysis, into the four evolutionary lineages: A, M, C and O. With the development of molecular techniques and new morphological data, some of the subspecies were reassigned to other lineages, such as the case of A. m. intermissa, A. m. sahariensis, and A. m. siciliana, which were originally placed in lineage M (Ruttner et al. 1978) and later relocated to lineage A (Ruttner 1988). Mitochondrial data was generally concordant with the morphological lineages; however, the mtDNA did not support the existence of lineage O, as it does not distinguish between C and O haplotypes (Cornuet and Garnery 1991; Garnery et al. 1992). Indeed, while morphometric analyses placed A. m. cypria, A. m. anatoliaca and A. m. caucasia in the lineage O (Ruttner 1988; Kandemir et al. 2011), mitochondrial data suggested that they belong to lineage C (Garnery et al. 1992; Smith et al. 1997; Kandemir et al. 2006). Therefore, later studies considered only three maternal lineages considered (A, M and C) while morphometry identified four lineages (A, M, C and O.). Later on, a new pattern of mtDNA variation that differed from those previously reported was observed in populations of A. mellifera from Near East, and the existence of a fourth maternal lineage was postulated (Franck et al. 2000a; Palmer et al. 2000). This new lineage was named O, which was erroneously associated with the morphological lineage O (Franck et al. 2000a). Recently, with the inclusion of additional geographical data and with new sequence analyses, lineage O was reclassified as an African sub-lineage and renamed Z (Alburaki et al. 2011). Along with the sub-lineage Z, the complexity of African lineage is also reflected by additional three sub-lineages (AI, AII, AIII) described by Franck et al. (2001). Also the maternal lineage Y, identified in populations of A. m. jemenitica from northeastern Africa (Franck et al. 2001), is seemingly part of the African (lineage A) maternal variation (Meixner et al. 2013). Analyses based on Single Nucleotides Polymorphism (SNPs) were largely congruent with the existence of the four divergent evolutionary lineages (Whitfield et al. 2006; Han et al. 2012) proposed by morphological data (Ruttner 1988).
Figure 2. Map w ith the geographical distribution of the 31 subspecies of A. mellifera. The color of the names indicated the respective evolutionary lineage: A-African lineage (red), M-Western and Northern European linage (blue), C- Eastern European lineage (orange) and O- Middle East and Western Asia lineage (green). A. sossimai (Engle 1999), A. m. taurica (Apaltov 1938) and A. m. artemisia (Engle 1999) are subspecies w ith sparse information on their evolutionary lineage (black) (Adapted from Chávez-Galarza et al. 2016a).
Regarding the origin of A. mellifera, there are some doubts that several studies have not been yet able to clarify and so far there are multiple scenarios under discussion. The first scenario of the origin of the evolutionary lineages was proposed by Ruttner (1978) that using morphological characters stated that the origin of the lineages was in the Middle East or Northeast Africa, from where the Europe was later colonized through two routes: via Western and Northwestern Africa to the Iberian Peninsula and via Middle East to the Balkans. This theory fits with molecular analyses, namely 1029 SNPs from Whitfield et al. (2006) reanalyzed by Han et al. (2012). Using different genetic parameters conclude that the origin of A. mellifera occurred probably in Asia, close where other Apis species are currently found (Han et al. 2012) (Figure 3A).
Also Garnery et al. (1992), based on mtDNA analyses proposes a Middle Eastern origin, but unlike Ruttner (1978) does not propose a colonization of Europe via western route and migration across the strait of Gibraltar, once the phylogenetic tree groups A and C lineage rather than M. The recent discovery of the new subspecie A. m. sinisxinyuan in the Tian Shan Mountains raises questions about the origin of the M lineage, suggesting a colonization of Europe through Asia, supporting the scenario proposed by Garnery et al. (1992) (Figure 3B).
Studies conducted by Whitfield et al. (2006) with basis on 1136 SNPs derived from the nuclear genoma support an origin of the honey bee in Africa however with the lineage A giving origin to the M lineage, who expanded later through the Western. According Whitfield et al. (2006), lineage C colonized the Europe while O lineage spread into Asia (Figure 3C).
Figure 3. Three of the four hypotheses proposed for the origin of A. mellifera: (A) An expansion from the Middle East, involving colonization of Europe via tw o routes one eastern and one w estern w as first suggested by Ruttner (1978) on the basis of morphometric analyses. This theory fits w ith the molecular analyses by Han et al. 2012 (B) An expansion from the Middle East, w hich did not involve the w estern colonization route into Europe w as suggested on the basis of trees constructed from mtDNA (Garnery et al. 1992). (C) An origin in Africa w as proposed by Wilson (1971) and an expansion out of Africa via both an eastern and w estern route w as suggested by the analysis of >1000 SNPs by Whitfield et al. (2006) (Adapted from Han et al. 2012).
In the most recent study Cridland et al. (2017) combined whole genome datasets generated by Harpur et al. (2012) and Walberg et al. (2014) and added other whole genomes to understand the evolutionary history of this subpecies. Results highlight a possible origin of the honey bee in the Middle East or in Northeastern Africa (Cridland et al. 2017), supporting the earlier hypothesis of Ruttner (1988), and also molecular analyses (Han et al. 2012; Walberg et al. 2014). However instead of an ancient split between the A and O lineages, Cridland et al. (2017) proposed that the M, C and O are all originated in the African continent.
1.3. Mitochondrial DNA surveys in the honey bee
The mitochondrial DNA (mtDNA) of the honey bee was completely sequenced in 1992 (Crozier and Crozier, 1993). The mtDNA is a circular molecule ranging from 16500 to 17000 bp in honey bees, according to the observed length variability in different regions of the molecule (Cornuet and Garnery, 1991). Because the maternally inherited, all individuals in the colony (workers and drones) share the mtDNA with their mother queen. Thus, with a study of a single individual is possible to identify the maternal ancestry of individual colonies and also to understand the patterns of gene flow or introgression among hybridizing population (De La Rúa et al. 2009). Moreover, the non-recombinant nature of mtDNA makes data interpretation straightforward.
A variety of markers, including RFLP (Restriction Fragment Length Polymorphism), PCR-RFLP (Polymerase Chain Reaction- Restriction Fragment Length Polymorphism) and direct sequencing has been used to assess the mtDNA variation within honey bee (Meixner et al.2013). In the RFLP technique, the digestion with restriction endonucleases has been performed in the entire mitochondrial genome. Although a battery of restriction enzymes (HinfI, AccI, AvaI, BclI, BglII, EcoRI, HincII, HindII, HindIII, NdeI, PstI, PvuII, XbaI) has been applied in to studies of A. mellifera, and roughly differentiated between the three maternal lineages A, M and C, they do not prove to be diagnostic markers to indentify the different subspecies (Meixner et al. 2013). Later, a different technique was developed, consisting of RFLPs of PCR fragments, requiring fewer amounts of DNA and allowing the amplification of specific regions. Several mitochondrial genes in different subspecies were digested with a distinct range of restriction endonucleases (see supplementary material Table S2). The intergenic tRNAl eu-cox2 region, described by Cornuet and Garnery (1991) is the most used mitochondrial region. Since the studies developed by Garnery et al. (1993), the DraI test, which consists in the PCR amplification of the intergenic tRNAl eu-cox2 region
followed by the digestion with the DraI, becomes widely used to assess the genetic diversity within honey bee populations, associated with the relatively low cost and scoring simplicity (Reviewed by Meixner et al. 2013).
1.3.1 DraI test and the intergenic tRNA
leu-cox2 region
The intergenic tRNAleu-cox2 region has been assessed mostly by using the popular DraI test, a PCR-RFLP assay which consists of PCR amplification of the intergenic fragment followed by the digestion with the DraI restriction endonuclease, as described by Garnery et al. (1993). The intergenic region is a non-coding region with two distinct nucleotide sequences known as the P and Q elements, which is determined by the number of Q repeats and the forms of the P elements. The P element ranges from ~53 to 68 bp and exhibits three forms: P0, P, P1. The ~15 bp difference between P0 to P1 is due to a deletion in the 3´end of P element. The Q element, which varies between ~194 and 196 bp, can be repeated in tandem one to five times, although these repeats are not lineage specific (Garnery et al. 1993; De La Rúa et al. 1998; Franck et al. 1998, 2001; Alburaki et al. 2011; Rortais et al. 2011).
The intergenic region tRNAl eu-cox2 has been assessed over the years in the study of honey bees providing a powerful and informative content, which has allowed discrimination of the three main evolutionary lineages (Garnery et al. 1993; Franck et al. 1998). Moreover, the DraI test was able to separate the four different sub-lineages known within the African lineage: AI; AII; AIII and Z (Franck et al. 2001; Alburaki et al. 2011). Lineage A presents two forms of the P element: P0 is characteristic of the sub-lineage AI, AII and Z, while P1 is observed in sub-lineage AIII. The element P0 differs from P1 by a deletion of 15 bp in P1 in the P form at the 3’ end of the P element. Further distinction between sub-lineages AI, AII and Z is possible due to the number of DraI recognition sites. Sub-lineage AII is differentiated from sub-lineage AI by the absence of a DraI restriction site in the 5’ end of the first Q element, while sub-lineage Z exhibits an additional restriction site in the middle of the first Q element. Lineage C is characterized by the absence of the P element and only presents one Q element. Lineage M carries the P element, which has a large deletion of 13 bp in its middle, besides the two DraI restriction sites in the first Q element, as observed in sub-lineage Z. Although the DraI test exhibit high levels of polymorphism that allowed the identification of numerous haplotypes from M and C lineages and African sub-lineages AI, AII, and AIII, it is unable to distinguish the honey bees at the subspecie level, since some haplotypes are carried by different subspecies (e.g. A1 haplotype was observed
in A. m. iberiensis and A. m. adansonii; C1 was observed in A. m. carnica and A. m. ligustica).
1.3.2. MtDNA surveys in the Iberian honey bee A. m. iberiensis
The Iberian Peninsula is considered one of the most important glacial refugia in Europe during the Quaternary, offering a suitable habitat for many taxa (Goméz and Hunt, 2007). Events associated with this period strongly affected the distribution of species throughout the Iberia Peninsula and has deeply shaped the phylogeographic patterns of many species (Goméz and Hunt 2007). Since the 1990's, many studies have been developed in Iberian Peninsula with the native honey bee (A. m. iberiensis) to uncover patterns of genetic diversity. The mtDNA of A. m. iberiensis has been extensively surveyed mainly using the DraI test, but also sequence data, reveling a further complexity of honey bee populations from Iberian Peninsula (Franck et al. 1998; Garnery et al. 1998; De La Rúa et al. 2002; Miguel et al. 2007; Cánovas et al. 2008; Pinto et al. 2012, 2013). MtDNA data revealed the occurrence of two divergent evolutionary lineages forming a sharp cline, with lineage M existing mainly in the northeastern half and lineage A in the southwestern half of Iberia (Garnery et al. 1993; Garnery et al. 1998; De La Rúa et al. 2002; Miguel et al. 2007; Cánovas et al. 2008; Chávez-Galarza et al. 2017). The presence of a large diversity of haplotypes from M and A lineage ancestry makes the Iberian Peninsula one of the regions with the highest maternal diversity of in Europe (Cánovas et al. 2008; Pinto et al. 2013; Chavez-Galarza et al. 2017). Other markers have been used in addition to mtDNA including morphology (Cornuet et al. 1989; Arias et al. 2006; Miguel et al. 2010), allozymes (Smith and Glenn 1995; Arias et al. 2006), microsatellites (Franck et al. 1998; Garnery et al. 1998; De la Rúa et al. 2002, 2003; Miguel et al. 2007; Miguel et al. 2010; Cánovas et al. 2011) and SNPs (Chávez-Galarza et al. 2013, 2015). Studies using SNPs reinforced the idea that the Iberian Peninsula may have acted as glacial refuge during glaciations (Chávez -Galarza et al. 2015), as previously speculated by other authors using different molecular markers (Smith et al. 1991; Franck et al. 1998; De La Rúa et al. 2002; Miguel et al. 2007; Cánovas et al. 2008).
In addition to the northeastern-southwestern cline, the DraI test also revealed that Atlantic side of the Iberian Peninsula is a hotspot of African maternal diversity (Pinto et al. 2012; 2013). The maternal composition of honey bee populations in Portugal also exhibits a north-south partitioning with northern populations mainly bearing haplotypes of sub-lineage AIII ancestry contrasting with the southern populations mostly composed of sub-lineage AI haplotypes (Pinto et al. 2012; 2013).
Moreover, sub-lineage AIII is virtually absent in the African continent (Franck et al. 2001; Pinto et al. 2013) but commonly observed in the Macaronesia Islands, except in Cabo Verde (De La Rúa et al. 1998, 2001a, 2006; Muñoz et al. 2013). Contrasting with sub-lineages AIII and AII, the occurrence of sub-lineage AII is less frequent in honey bee population in Iberian Peninsula (Cánovas et al. 2008; Pinto et al. 2013).
1.3.3. MtDNA surveys in Macaronesian honey bee
Darwin has turned out the attention to the study of islands since he developed the theory of evolution by natural selection in the finches of the Galápagos Islands (Emerson et al. 2002). The scientific interest of islands is mainly triggered by the fact that they have a small size with oceanic boundaries, displaying a diversity of habitats with high levels of endemism providing natural laboratories for evolutionary studies (Emerson et al. 2002; Losos et al. 2009). Thus, the evolutionary processes underlying genetic diversity of insular populations may be distinct from those in the mainland and the reduced gene flow due to the oceanic barriers and also the genetic drift associated to founder events may lead to the formation of new species (Barton 1996; Emerson et al. 2002). In honey bees, the differences observed in insular populations allowed the characterization of new subspecies as is the case of the A. m. siciliana from Sicily (Sinacori et al. 1998), A. m. adami from Crete (Bouga et al. 2005), A. m. ruttneri from Malta (Sheppard et al. 1997), A. m. cypria from Cyprus (Bouga et al. 2005) and A. m. unicolor from Madagascar (Hepburn and Radloff 1988). Examples of adapted insular populations are described in other Apidae, such as the case of the two endemic Macaronesian bumblebees Bombus canariensis, from the Canaries, and Bombus maderensis, from Madeira (Erlandsson 1979). The geographic isolation also plays an important role in the development of particular traits in honey bees from islands that made possible their survival and local adaptation. For example, Sinacori et al. (1998) reported that A. m. siciliana can reduce or interrupt the brood rearing during summer and also has the ability to control the infestation of the mite Varroa destructor. In 1950 Eckert reported that honey bees from the Molokai Island in Hawaii were resistant to American Foulbrood, which is caused by Paenicillus larvae, a highly destructive brood disease (Szalanski et al. 2015).
La Rúa et al. (2006) assessed the genetic structure of honey bee populations from the Macaronesian islands of Madeira and São Miguel using the DraI test and microsatellites. MtDNA analysis of the populations from São Miguel revealed the existence of four African haplotypes belonging to sub-lineages AIII and AII and confirmed the presence of colonies of C-lineage ancestry. Later in a temporal analysis
of the mitochondrial diversity also assessed by the DraI test, Muñoz et al. (2013)
obtained similar results for São Miguel, however with a subtle increase of haplotypes of C-lineage and sub-lineage AII ancestry concurrently with a decrease of sub-lineage AIII haplotypes. Yet, these studies on São Miguel certainly are not representative of all the maternal genetic diversity existing across the entire archipelago.
Contrary to the Azores, in the last two decades the Canary Islands have been targeted by extensive sampling and many studies to unveil the genetic diversity of local populations (De La Rúa et al. 1998, 2001, 2002, 2003, Muñoz et al. 2013; Miguel et al. 2016). Not all Canary Islands can support honey bee colonies due to the lack of abundant nectar flows, such as in Lanzarote and Fuerteventura (De La Rúa et al. 1998). The remaining islands (Tenerife, El Hierro; La Gomera, Gran Canaria and La Palma) carry haplotypes mainly belonging to the African sub-lineages AIII, in addition to the considerable amounts of lineage C (De La Rúa et al. 1998). For this reason, an African origin was initially suggested for honey bees from Canarias (De La Rúa et al. 1998; 2001), conjecture that proved to be wrong when haplotypes of sub-lineage AIII ancestry were found to be abundant in the populations of northern Portugal, supporting instead a Portuguese origin (Miguel et al. 2016). Lineage C was not detected in La Palma in 1998 (De La Rúa et al. 1998), but recent studies report hybridization in middle and western populations, however in low levels (Miguel et al. 2016). In general, the lineages representative of the archipelagos of Canary, Madeira and Azores are of African ancestry, being sub-lineage AIII predominant (De La Rúa et al. 1998, 2001, 2002, 2003; Muñoz et al. 2013; Miguel et al. 2016), except in Cape Verde (Franck et al. 2001). Interestingly, this African archipelago only carries haplotypes belonging to sub-lineage AI, similarity to sub-Saharan Africa (Franck et al. 2001).
1.3.4. Signs of hybridization in insular populations of Apis mellifera:
consequences and conservation plans
Contrary to other domestic species, the mating in honey bee queens is extremely difficult to control, so the hybridization and introgression between local and introduced honey bees is very common (Franck et al.1998; Jensen et al. 2005; De La Rúa et al. 2009). The honey bees that have been globally imported are derived from the subspecies A. m. ligustica and A. m. carnica, both belonging to C lineage. These subspecies typically possess a docile nature and high productivity, which makes them favorite for beekeepers around the world (Ruttner 1988, Moritz et al. 2005). However, the introduction of foreign subspecies exposes the native subspecies to introgressive
hybridization, which modifies the gene pool of the local adapted populations leading to the loss of the genetic identity and threatening the survival of local populations across the world (e.g. Pinto et al. 2004; Jensen et al. 2005; De La Rúa et al. 2009; Pinto et al. 2014; Ivanova et al. 2007; Muñoz et al. 2014b). Native subspecies are important reservoirs of local adaptation (De La Rúa et al. 2009) due to the considerable environmental variation, to the weather conditions and flowering seasons but also the occurrence and variation of parasites and pathogens (Meixner et al. 2015). Furthermore, native honey bee exhibits particular behavior and morphological traits that reflect the adaptation to the natural habitats (De La Rúa et al. 2009).
Despite being away from the continental masses, honey bees that inhabit the islands do not become immune to the introduction of foreign subspecies ; in fact, isolation makes them even more vulnerable. Populations in the islands are more sensible to the extinction than those in the mainland due to several factors, including human over exploitation, habitat destruction or the problematic introduction of foreign species or diseases (Frankam 2008). Honey bee populations of the Mediterranean Islands are a good example of the harmful effects of the introduction of foreign subspecies. The sicilian honey bee, A. m. siciliana, has strongly hybridized with the honey bee from Italy, A. m. ligustica, since the beginning of the 20th century, which has almost led to the loss of this subspecies that is well adapted to the harsh environmental conditions of Sicilia (Muñoz et al. 2014b). In the Balearic Islands, honey bee populations from Formentera, Ibiza and Menorca present signs of introgression, which has drastically changed the genetic pool of local populations (De La Rúa et al. 2001, 2009). Although in Canary Islands is observed haplotypes from C lineage (De la Rua et al.1998, 2001, 2002; Muñoz et al. 2013; Miguel et al. 2016), analysis of mitochondrial diversity revealed that São Miguel presents the highest frequencies of C lineage haplotypes, when comparing to the remaining archipelagos of Macaronesia (De La Rúa et al. 2006; Muñoz et al. 2013).
In addition to the loss of the genetic identity, the introduction of foreign queens also exposes the native populations to foreign pathogens (De La Rúa et al. 2009). Until 2000, when were reported massive illegal introductions of foreign subspecies from C lineage in Pico, there were no records of the mite Varroa destructor. In the following year, Varroa was introduced in Flores, and later, in 2008 arrived at Faial. However, in the remaining islands Varroa is absent which make the beekeeping practice profitable, by not requiring treatment for the mite, which are relatively expensive, and also for the highest commercial value of the products derived from honey bee activity not affect by the mite.
In an attempt to control the introduction of foreign queens, where the local honey bee already exists, local honey bee conservation programs have emerged worldwide to protect local honeybee from genetic introgression. The early studies conducted in Las Palmas did not detect the presence of lineage C (De La Rúa et al. 1998; 2000), which led to the creation in 2001 of a conservation plan named “Honey bee Conservation Project on La Palma”. This also aimed to control the introduction of foreign subspecies, by banning honey bee importations ( Muñoz and De La Rúa, 2012; Muñoz et al. 2013; Miguel et al. 2016).
1.4. The importance of the study of morphological traits
The study of shape has played a crucial role in the world of biology as a way of investigating the inherent variation of different organisms. There are several factors that affect the morphology and that can lead to the variability that is observed among the individuals, molded by the strict relation between the organism and the environment (Ricklefs and Miles 1994). Competitive interaction between closely related species, unequal growth and morphogenesis processes, as well as different selective pressures caused by climate or habitat can lead to morphological differentiation (Atchley and Hall 1991; Ricklefs and Miles 1994; Adams and Rohlf 2000; Zelditch et al. 2004). Thus, it is possible to identify different groups of individuals based on morphological traits. Morphometry has therefore been widely used over the years covering a vast spectrum of species contributing to the taxonomic classification of species mostly before the availability of molecular approaches.1.4.1. Traditional Morphometry
Morphometric studies in honey bees began in 1916 in Russia when Cochlov compared different races of A. mellifera from different geographic zones using the length of the tongue (Ruttner 1988). The works of Alpatov (1929) and Goetze (1940) using univariate statistics contributed to describe different subspecies of A. mellifera. Later on, DuPraw (DuPraw 1964, 1965) developed multivariate statistical techniques, known as traditional morphometry or multivariate morphometrics. Traditional morphometrics consisted in the application of multivariate statistical analyses to the study of morphological variables as linear distance measurements but also angles and ratios (Adams et al. 2004; Slice 2007). Ruttner (1988) played a crucial role in the identification and classification of A. mellifera subspecies based on the concepts of traditional morphometry. The author was responsible for the description of 36 characters, including distances and angles, particularly related with the wing shape
measurements, analyzed with multivariate statistical analysis (Ruttner 1988). It should be noted that studies with traditional morphometry allowed Ruttner (1988) to identify the four evolutionary lineages in A. mellifera (A, M, C, and O).
1.4.2. Geometric morphometrics
At the end of the 20th century, a new technique of geometric morphometrics emerged using information on shape variation obtained from homologous landmarks coordinates (Bookstein 1991, Bookstein 1996). Geometric morphometrics requires landmarks describing specific anatomical locations that should be sufficient to cover the shape of the structure, be easily located and identifiable across the individuals (Zelditch et al. 2004; Adam et al. 2013). Homologous landmarks provide a more complete biological interpretation of the results (Rohlf and Marcus 1993). However, sometimes structures possess other landmarks called semi-landmarks that can capture information about the shape in boundary curves, in the end of structures or arbitrary points along an outline (Rohlf and Marcus 1993; Adam et al. 2013). Differences between specimens can be analyzed using several superimposition methods. Procrustes superimposition methods use raw coordinates obtained through homologous landmarks points of the specimens in study in order to extract shape information, which removes variation in size, orientation and position (Goodall 1991; Rolf and Marcus 1993; Bookstein 1996; Zelditch et al. 2004).The aligned landmark configurations generate points that lie in Kendall’s shape space in order to capture all possible variations in shape, and then are projected orthogonally into their Euclidean space tangent (Bookstein 1996; Rohlf 1999; Zelditch et al. 2004). This step is essential since conventional tools of multivariate statistical analysis work with the Euclidean linear space.
In contrast to geometric morphometrics, traditional morphometry has several disadvantages mainly by working with linear distance measurements that are usually deeply correlated with size, and many of those distances are not defined by homologous landmarks (Zelditch et al. 2004). Another difficulty is related to the same distances obtained from different shapes and the impossibility of representing them graphically (Bookstein 1994). Moreover, geometric morphometric approach has been replacing the traditional morphometry since it yields a powerful statistical analysis, is more efficient to detect the variations of shape and allows the graphical representation of geometric structures (Bookstein, 1991; Marcus and Corti 1996; Rohlf and Marcus 1993). Geometric morphometric techniques covers several fields in biology, paleontology and systematics and has been applied to a wide number of plants
(Shipunov and Bateman 2005; Viscosi and Cardini 2011; Savriama et al. 2012), invertebrates (Anstey and Pachut 2004; Mutanen and Pretorius 2007; Wappler et al. 2012; Smith et al. 2013) and vertebrates (O’Higgins and Jones 1998; Klingenber et al. 2001; Claude et al. 2004; Clabaut et al. 2007; Foster et al. 2008; Figueiredo et al. 2009; Ginter et al. 2012; Ottoni et al. 2013), including humans (Bookstein at al. 2001; Bruner 2004; Gonzalez et al. 2009; Perez et al. 2006; Harvati 2004; Gomez-Robles et al. 2008).
1.4.2.1. Geometric morphometric in bee wing venation
Morphometric geometric analysis in insects is mainly based upon the characteristics of the wings, such as shape and venation. Results obtained over the years using wing venation provided reliable information and have demonstrated the efficacy of this technique (Francoy et al. 2008, 2009; Matias et al. 2001; Baylac et al. 2003; Villemant et al. 2007; Gumiel et al. 2003; Perrard et al. 2012, 2014; Aytekin et al. 2007; Hoffman and Shirriffs 2002), when compared with traditional morphometry (Tofilsky 2008). Moreover, it was possible to identify new bee species using the wing venation based on the extremely rare bee fossil record (De Meulemeester et al. 2012; Wappler et al. 2012).
Wings are two-dimensional structures, with many anatomical landmarks, formed by homologous intersections of the veins, which can be compared among groups of individuals, populations, subspecies or species in order to appraise genetic diversity (Michez et al. 2009; Baylac et al. 2003; De Meulemeester et al. 2012; Gerard et al. 2015). Because they are flat and rigid structures, wings can be easily handled, which make them useful tools when compared with other organs (Michez et al. 2009; De Meulemeester et al. 2012; Gerard et al. 2015).
In A. mellifera, the results obtained through the morphometry allowed to discriminate between subspecies (Tofilski 2008; Kandemir et al. 2011; Barour and Baylac 2016) and also to infer about the effects of the Africanization process in Brazil (Francoy et al. 2008; 2009). In addition, geometric morphometrics of wings is often used along molecular tools such mtDNA, microsatellites and SNPs (Miguel et al. 2010; Oleksa and Tofilski 2015; Miguel et al. 2016) to better understand the evolutionary patterns that shaped variation observed between the different subspecies of A. mellifera.
A few studies using geometric morphometrics for the characterization of A. m. iberiensis have been performed in the Iberian Peninsula (Miguel et al. 2010; Chávez-Galarza et al. 2016b). In the most recent study results obtained with the variation of
wing shape of workers from 711 colonies collected across the Iberian Peninsula detected a Southwestern-Northeastern cline with the contact of two divergent evolutionary lineages A and M (Galarza et al. 2016b), previously undetected with traditional morphometry (Cornuet and Fresnaye 1989). These results were also largely congruent with by both nuclear (SNPs) and mitochondrial (mtDNA) markers, being able to capture the signature of complex evolutionary processes (Chávez -Galarza et al. 2013, 2015).
Objectives
The present study aims to provide a comprehensive survey of the genetic diversity of the honey bee populations inhabiting the Azores archipelago which will help understanding the relationship between insular populations and A. m. iberiensis populations, the putative historical source of the Azorean honey bees, and the impact of contemporary beekeeping activities. The main objectives of this study were:
-To examine the mitochondrial DNA variation of the intergenic tRNAleu-cox2 region using the DraI test;
-To characterize the patterns of wing geometric morphometric variability of the honey bee from Azores Archipelago, in comparison with reference samples representing three subspecies, using multivariate statistical analyses;
- To examine how concordant are the patterns revealed by mtDNA and wing geometric morphometrics data;
-To examine the impact of modern beekeeping in the local populations through detection of variation of C-lineage ancestry.
The findings of this study can be used as a baseline to delineate breeding and conservation programs towards a more sustainable beekeeping in the Azores.
The Macaronesian honey bee populations harbor important genetic diversity, yet this diversity has been increasingly threatened by introduced pests and diseases and genetic pollution from imported queens. Conservation of locally adapted diversity is paramount for honey bees to respond to both climate change and invasive pests and diseases.
2. Material and Methods
2.1. Study Area
The Atlantic archipelagos, of volcanic origin, located next to Europe and North Africa are collectively known as Macaronesia. The Azores is the youngest archipelago in the Macaronesia biogeographical region, which also comprises the archipelagos of Madeira, Canaries and Cape Verde (Fernándes-Palacios et al. 2011) (Figure 4). The Azores comprises nine islands and small islets that are located between 37º and 40º N latitude and 25º to 31 º W longitude, laying at 1584 km from the Portuguese mainland, with a total of 2333 km2. The Azores are located in a volcanically active region, in the junction of the Eurasian and the American plates.
Figure 4. Map of the study area show ing the location of the nine islands of the Azores archipelago, located in the Macaronesia biogeographical region.