Systems/Circuits
Optogenetic Activation of Dorsal Raphe Serotonin Neurons
Rapidly Inhibits Spontaneous But Not Odor-Evoked Activity
in Olfactory Cortex
Eran Lottem,
1*
X
Magor L. Lo¨rincz,
1,2,3* and Zachary F. Mainen
11Champalimaud Neuroscience Programme, Champalimaud Centre for the Unknown, 1400-038, Lisbon, Portugal,2Research Group for Cellular and Network
Neurophysiology of the Hungarian Academy of Sciences, Department of Physiology, Anatomy, and Neuroscience, and3Research Group for Cortical
Microcircuits of the Hungarian Academy of Sciences, Department of Physiology, Anatomy and Neuroscience, University of Szeged, 6726, Szeged, Hungary
Serotonin (5-hydroxytriptamine; 5-HT) is implicated in a variety of brain functions including not only the regulation of mood and control
of behavior but also the modulation of perception. 5-HT neurons in the dorsal raphe nucleus (DRN) often fire locked to sensory stimuli,
but little is known about how 5-HT affects sensory processing, especially on this timescale. Here, we used an optogenetic approach to
study the effect of 5-HT on single-unit activity in the mouse primary olfactory (anterior piriform) cortex. We show that activation of DRN
5-HT neurons rapidly inhibits the spontaneous firing of olfactory cortical neurons, acting in a divisive manner, but entirely spares
sensory-driven firing. These results identify a new role for serotonergic modulation in dynamically regulating the balance between
different sources of neural activity in sensory systems, suggesting a possible role for 5-HT in perceptual inference.
Key words: feed-forward; feedback; inhibition; neuromodulation; odor
Introduction
Serotonin (5-hydroxytriptamine; 5-HT), released from neurons
located in the brainstem dorsal raphe nucleus (DRN), is involved
in the regulation of mood and in behavioral control in
relation-ship to rewards and punishments (Soubrie, 1986;
Cools et al.,
2008;
Dayan and Huys, 2009). Although less studied, it is also
implicated in the regulation of sensory function (Davis et al.,
1980;
Jacobs and Azmitia, 1992;
Deemyad et al., 2013). Although
these effects have been characterized chiefly on a relatively slow
timescale, elicited pharmacologically or by electrical stimulation,
optogenetic stimulation of DRN 5-HT neurons can reduce
be-havioral sensitivity to noxious mechanical stimuli on the
time-scale of seconds (Dugue´ et al., 2014), and similar protocols can
exert other effects on behavior within
⬍1 s (
Fonseca et al., 2015).
Moreover, the firing of DRN 5-HT neurons is modulated on the
subsecond timescale (Waterhouse et al., 2004;
Ranade and
Mainen, 2009;
Cohen et al., 2015). Together, these data suggest
that transient changes in DRN activity could be coupled to
sim-ilarly rapid influences on sensory processing.
Here, we investigated the effect of 5-HT on olfactory sensory
processing. In the olfactory bulb (OB), 5-HT can affect odor
processing by inhibiting glutamate release from the terminals of
olfactory receptor neurons (Petzold et al., 2009) and exciting
external tufted cells (Liu et al., 2012). The primary olfactory
cor-Received Aug. 10, 2015; revised Sept. 21, 2015; accepted Oct. 10, 2015.
Author contributions: E.L., M.L.L., and Z.F.M. designed research; E.L. and M.L.L. performed research; E.L., M.L.L., and Z.F.M. analyzed data; E.L., M.L.L., and Z.F.M. wrote the paper.
This work was supported by European Research Council Advanced Investigator Grant 250334 (Z.F.M.), the Cham-palimaud Foundation (Z.F.M.), Hungarian Scientific Research Fund Grant NF 105083 (M.L.L.), Hungarian Brain Research Program Grant KTIA_NAP_13-2-2014-0014 (M.L.L.), and the Human Frontier Science Program (Z.F.M.) and Fellowships LT001009/2010L (M.L.L.) and LT000881/2011L (E.L.). We thank Drs. C. Poo, B. Atallah, and M. Murakami for helpful discussions.
The authors declare no competing financial interests. *E.L. and M.L.L. contributed equally to this work.
Correspondence should be addressed to either of the following: Magor L. Lo¨rincz, Research Group for Cellular and Network Neurophysiology of the Hungarian Academy of Sciences, Department of Physiology, Anatomy, and Neuro-science, University of Szeged, Ko¨ze´p fasor 52, 6726, Szeged, Hungary, E-mail:[email protected]; Zachary F. Mainen, Champalimaud Neuroscience Programme, Champalimaud Centre for the Unknown, 1400-038, Lisbon, Portugal; E-mail:[email protected].
DOI:10.1523/JNEUROSCI.3008-15.2016
Copyright © 2016 the authors 0270-6474/16/360007-12$15.00/0
Significance Statement
Serotonin is implicated in a wide variety of (pato)physiological functions including perception, but its precise role has remained
elusive. Here, using optogenetic tools
in vivo, we show that serotonergic neuromodulation prominently inhibits the spontaneous
electrical activity of neurons in the primary olfactory cortex on a rapid (
⬍1 s) timescale but leaves sensory responses unaffected.
These results identify a new role for serotonergic modulation in rapidly changing the balance between different sources of neural
activity in sensory systems.
tex or anterior piriform cortex (aPC) is also a significant target of
DRN innervation (De Olmos and Heimer, 1980;
Datiche et al.,
1995). Principal neurons in aPC receive two major sources of
input: (1) feedforward input from the OB via the lateral olfactory
tract (LOT); and (2) feedback input comprising the recurrent
collaterals of local principal neurons and top-down innervation
from other brain regions (Haberly, 1998;
Isaacson, 2010). It has
been proposed that recurrent olfactory cortex feedback circuitry
implements associative memory functions such as pattern
com-pletion and generalization (Haberly, 1985,
2001). The
neuro-modulators acetylcholine and noradrenaline have been shown to
differentially inhibit feedback circuits (Hasselmo and Bower,
1992;
Hasselmo et al., 1997), a function theorized to regulate
associative memory function (Hasselmo and Bower, 1992;
Has-selmo et al., 1997). However, these results are based on in vitro
recordings, and their consequences on in vivo firing in the
olfac-tory system have not been investigated.
In Bayesian theories of perception, experience is used to build
predictive models of the world that generate expectations or
pri-ors (Kersten et al., 2004;
Knill and Pouget, 2004). In the process of
perceptual inference, priors carried by feedback inputs are
com-bined with sensory data (likelihoods) carried by feedforward
in-puts to infer a posterior (Rao and Ballard, 1999;
Friston, 2010;
Summerfield and de Lange, 2014). It has been proposed that
spontaneous activity, in the absence of sensory input, will reflect
model-based priors (Fiser et al., 2010;
Berkes et al., 2011).
In this work, we combine electrophysiological and
optoge-netic tools to study the effects of DRN 5-HT on the aPC in vivo.
We show that 5-HT rapidly suppresses the spontaneous firing of
aPC neurons but spares odor-driven firing. Our results identify a
novel role for serotonergic modulation in dynamically regulating
the balance between different sources of neural activity in sensory
systems acting on a rapid timescale. Interpreted in the context of
predictive coding, these observations suggest that 5-HT regulates
the influence of priors on perceptual inference.
Materials and Methods
All procedures were performed in accordance with the European Union Directive (86/609/EEC) and approved by Veterinary Directorate-General of Portugal. Adult C57BL/6 mice were used in all experiments. All efforts were made to minimize the suffering and number of animals used in each experiment. The SERT–Cre mouse line (Zhuang et al., 2005) was used to express channelrhodopsin-2 (ChR2) selectively in serotoner-gic cells. Optogenetic methods followed methods described previously (Dugue´ et al., 2014). Data are presented as mean⫾ SEM, unless stated otherwise.
Viral infections. Male mice heterozygous for Cre recombinase under
the control of the serotonin transporter (Sert) gene [Slc6a4tm1(cre)Xz;
Zhuang et al., 2005] were injected with 0.5–1l of AAV2/1–Flex–ChR2– YFP in the DRN [coordinates: anteroposterior (AP),⫺4.7 mm; dorso-ventral (DV), 3.1–3.6 mm]. Histology confirmed prominent and specific ChR2 expression in DRN 5-HT neurons (Dugue´ et al., 2014).
Surgical procedures and in vivo electrophysiology. Adult mice (postnatal
day 60 –120) infected previously (2–5 weeks) with ChR2 in DRN 5-HT neurons were anesthetized with urethane (1.4 g/kg). Body temperature was maintained at constant levels using a heating plate (Supertech). After exposing the skull, a small hole was drilled above target areas at stereo-taxic coordinates [aPC: AP,⫹2.3 mm; lateral, 2.5 mm; DV, 2.9–3.6 mm]. The dura mater was then punctured, and the electrodes were lowered into the brain. A stainless steel screw (0.8 mm diameter) was placed into the skull over the cerebellum and served as a ground/reference.
Next, an optrode consisting of an optical fiber (200m diameter; numerical aperture 0.38) coupled to a 470 nm laser (Laserglow Technol-ogies) and a microelectrode was lowered into the DRN (coordinates: AP,⫺4.7 mm; DV, 3.0–3.6 mm) at a 32° angle. The electrode was
low-ered while brief light pulses were delivlow-ered (10 ms, 0.5 Hz) until a prom-inent optical local field potential was observed on the optrode located in the DRN indicative of synchronous firing in ChR2-expressing 5-HT neu-rons (Dugue´ et al., 2014).
Extracellular single units were recorded using metal microelectrodes (1–3 M⍀; FHC), 16-channel silicon probes (NeuroNexus Technologies), or glass pipettes filled with 0.5MNaCl (resistance, 10 –25 M⍀). Record-ings were acquired digitally using Spike2 software (Cambridge Electronic Design). Data were stored on a personal computer for offline analysis. Spike sorting was performed with Spike2 software (Cambridge Elec-tronic Design).
Odor presentation and optogenetic stimulation of the DRN. While under
anesthesia, mice were presented with one or several different odors [S(⫹)-2-octanol, R-(⫺)-2-octanol, amyl acetate, (⫺)-␣-pinene, (⫹)-␣-pinene, ( S)-(⫺)-pulegone, and diallyl sulfide diluted in mineral oil in a 1:10 ratio] using a custom-built olfactometer. Diluted liquid odors and a blank control odor (pure mineral oil) were loaded onto disposable sy-ringe filters (20l; Whatman) that were then inserted into a manifold. The flow of air through each of the filters was controlled independently using a three-way solenoid valve (NResearch). At any given moment, only one of the valves was open, passing either odorized or blank air streams at a flow rate of 100 ml/min through the filter and into the manifold. This stream was mixed within the manifold with a second, “carrier” stream of clean air (flowing at 900 ml/min; both streams con-trolled using mass flow controllers; Aalborg) from which it was delivered though Teflon tubes to the animal’s nose. Each recording session con-sisted of 5–20 blocks. Each block contained all the different trial combi-nations of odor and photostimulation. Odors were presented for either 1 or 2 s (n⫽ 5 and 58 neurons, respectively) and photostimulation (10 ms pulse width, 1–30 Hz) started 1 s before odor stimulation and cotermi-nated with it. A 20 –30 s interval was inserted between trials to allow for activity to return to baseline. In some experiments, we used a range of stimulation frequencies (1, 5, 10, and 30 Hz; n⫽ 15), whereas in others, different stimulus durations were used (2.1, 3, and 7 s; n⫽ 5).
Histology. At the end of some experiments, animals were given an
overdose of urethane and perfused through the heart with 20 ml of saline, followed by 50 ml of ice-cold 4% paraformaldehyde in PBS, and their brains removed and sectioned after overnight fixation for histology.
Data analyses. To test for significant modulations of firing rates
attrib-utable to either odor or photostimulation, we used receiver operating characteristic (ROC) analysis. We first generated two firing rate proba-bility distributions, one for the control condition and the other for the test. For photostimulation modulation analysis, we calculated the firing rates in a 4 s window aligned on stimulus onset. In cases in which multiple stimulation frequencies were used, the highest frequency of stimulation was chosen; 3 s stimulation was chosen in case of different stimulation durations. For odor modulation analysis, the window had the same duration as the odor stimuli (1 or 2 s). We then calculated the area under the ROC curve (AUC) comparing the two distributions. Fi-nally, we generated 1000 shuffled distributions, in which individual trials were assigned to either distribution randomly and calculated the AUC values for these shuffled data, as well. Conditions in which the real AUC value was⬎97.5% or ⬍2.5% of the shuffled values were consid-ered significant.
The value obtained using this analysis was also used to assign a modulation index (MI), which was calculated as follows: MI⫽ 2 ⫻ (AUC⫺ 0.5). An MI value of 1 corresponds to the strongest possible excitation (in which the lowest value of the modulated distribution is higher than the highest value of the control distribution), and a value of⫺1 corresponds to the strongest possible inhibition.
To calculate the latency to inhibition onset, we used change point analysis (Basseville and Nikiforov, 1993). For each unit, we calculated the cumulative sum of the difference between the (unsmoothed) peri-stimulus time histogram (PSTH) and mean firing rate throughout the trial. For inhibited units, these curves are characterized by an initial rising slope (in which the mean firing rate is higher than average) that peaks and starts decreasing at the onset of inhibition. The maximum of this curve within a 4 s time window aligned with
photostimula-tion onset was taken to be the change point, and its delay from stim-ulation onset was the latency.
For inhibited units that were stimulated with different frequencies, we calculated the dose response by first dividing each average firing rate by its corresponding control. In the case of different photostimulation du-rations, we calculated firing rates during a 7 s time window aligned to stimulation onset (the duration of the longest condition) and normalized these values to the control.
To test whether inhibition scaled with baseline firing rate across the population of recorded neurons and to test whether such scaling was divisive and/or subtractive, we calculated average firing rates during pre-photostimulation (4 to 0 s before onset) and post-photostimulation (0 to 4 s after onset). In control trials, stimulation of 0 amplitude was delivered. We then used linear regression to fit post-firing rates according to the following equation:
rpost⫽0⫹1⫻ rpre⫹2⫻ s ⫹3⫻ rpre⫻ s, (1) where rpreand rpostare the pre and post firing rates of each unit, respec-tively, and s, the photostimulation term, is equal to 1 in photostimulated trials and 0 in control trials (seeFig. 3A) or to the photostimulation
frequency (seeFig. 3B). Note that2and3correspond to the subtractive and divisive components of inhibition, respectively.
We also tested whether the inhibition of individual units scaled with baseline firing rate fluctuations in a similar manner. We first gathered all the pairs of firing rates comprising pre (4 to 0 s before photostimulation onset) and post (0 to 4 s after) in both stimulated and control trials. To avoid “flooring” effects attributable to the fact that neuronal firing can-not reach negative values, we discarded data points in which the post firing rate was 0. We then normalized all firing rates by dividing all values by the maximum pre value. Finally, we used linear regression to fit post firing rates. The model used was identical to the one described above (Eq. 1), only that here individual units were fitted separately, and data points correspond to individual trials instead of individual units.
Because this analysis relies on the existence of significant temporal correlations in the firing rates of units within the relevant time window, we only included units that displayed a significant correlation between pre and post firing rates (i.e., units with significant1values; n⫽ 14 neurons of 38 inhibited neurons). Failure to meet this criterion would suggest that the firing-rate fluctuations of the unit are too rapid, making the comparison between pre and post firing rates meaningless.
A similar analysis was performed to measure the scaling of odor re-sponses with baseline firing rates (seeFig. 7) and their interaction with photostimulation. The analysis was similar to that of spontaneous activ-ity described above, with one exception: the 4 s post time window was aligned on odor onset (1 s after photostimulation onset). To model the relation between prestimulation and poststimulation firing rates, their modulation by odors and photostimulation, and the interaction between the two, we used the following equation:
rpost⫽0⫹1⫻ rpre⫹2⫻ x ⫹3⫻ rpre⫻ s ⫹4⫻ rpre⫻ x ⫹5
⫻ s ⫻ x ⫹6⫻ rpre⫻ s ⫻ x. (2) Here, x is the odor term and is equal to 1 in trials in which odors pre-sented and 0 otherwise. This analysis was mainly aimed at determining whether the effects of 5-HT and odor stimuli were independent or not, as reflected in the magnitude of the interaction terms5and6. Note that, because we found that the subtractive term for photostimulation trials was 0 (seeFig. 4), we omitted this term from the model to decrease the number of free parameters of the model. A similar analysis using a similar model that included this term showed qualitatively similar results.
Breathing was monitored continuously during recording experiments using a piezoelectric strap (Kent Scientific) wrapped around the animal’s chest. During inspiration, expansions of the thorax result in sharp deflec-tions in the recorded signal (Spors et al., 2006;Gautam and Verhagen, 2012). Individual sniffs were defined as starting 50 ms before the peak of the deflection (to avoid splitting single inhalations into separate cycles) and ending 50 ms before the consecutive peak (for example, respiration data; seeFig. 8A).
To test for sniff phase locking of firing in individual units during odor presentation, we first computed the sniff phases of all action potentials occurring during the six sniffs after odor onset (⬃2 s). We then tested whether firing was locked significantly to sniffing using the Rayleigh test for non-uniformity of circular data. Only neuron– odor pairs that showed significant ( p⬍ 0.05) phase locking during both control and photostimulated conditions were analyzed further. Finally, we compared the average phase and magnitude of the sniff-aligned firing rate distribu-tions during control and photostimulated condidistribu-tions.
Results
DRN 5-HT photostimulation reduces the spontaneous
activity of aPC neurons in vivo
To study the effects of 5-HT release in vivo, we recorded
extracel-lular single-unit activity in the aPC in anesthetized SERT-Cre
mice. The mice were infected previously (2– 6 weeks) with AAV2/
1–Flex–ChR2–YFP to express the light-sensitive channel ChR2 in
5-HT neurons (Fig. 1
A), as described previously (
Dugue´ et al.,
2014).
Figure 1
B shows an example unit whose spontaneous
fir-ing was suppressed after DRN 5-HT photostimulation.
A comparison between the spontaneous activity of aPC
neu-rons recorded in the presence and absence of DRN
photostimu-lation (3 s trains of 10 ms light pulses at 10 –30 Hz, 5 mW) showed
prominent inhibition of neuronal activity (baseline firing rate,
5.42
⫾ 0.76 Hz; fraction of baseline firing rate after
photostimu-lation, 56
⫾ 8%; n ⫽ 63; p ⬍ 0.001, Wilcoxon’s signed-rank test;
Fig. 1
C). We used ROC analysis both to test for the significance of
photostimulation-induced changes in firing rates and to derive
an MI (see Materials and Methods). MI values range from
⫺1 to
1, with positive values indicating enhancement and negative
val-ues indicating suppression. Of 63 units, 38 (60%) showed
signif-icant suppression of firing, whereas only three neurons (5%)
showed increased firing. Overall, the distribution of MI values
was skewed heavily toward negative values (average MI,
⫺0.49 ⫾
0.05;
Fig. 1
D).
The time course of photostimulation-induced suppression of
aPC firing was rapid, reaching significant levels within 200 ms
(161
⫾ 48 ms, median ⫾ SEM; n ⫽ 38; data not shown). In a
subset of units tested with a range of frequencies (1–30 Hz), the
5-HT photostimulation effect was also dose dependent, with
higher stimulation frequencies resulting in a more prominent
effect ( p
⬍ 0.001, Kruskal–Wallis test; n ⫽ 15;
Fig. 2
A, B). By
varying the duration of photostimulation for a subset of units, we
found that, when calculated within a fixed time window
corre-sponding to the longest stimulus, the decrease in firing was
lin-early proportional to the fraction of photostimulation time
within the measurement window (fitted slope,
⫺0.80; n ⫽ 5; p ⬍
0.001;
Fig. 2
C,D). This indicates that, after its rapid onset, the
effect of photostimulation was constant throughout the entire
period of photostimulation.
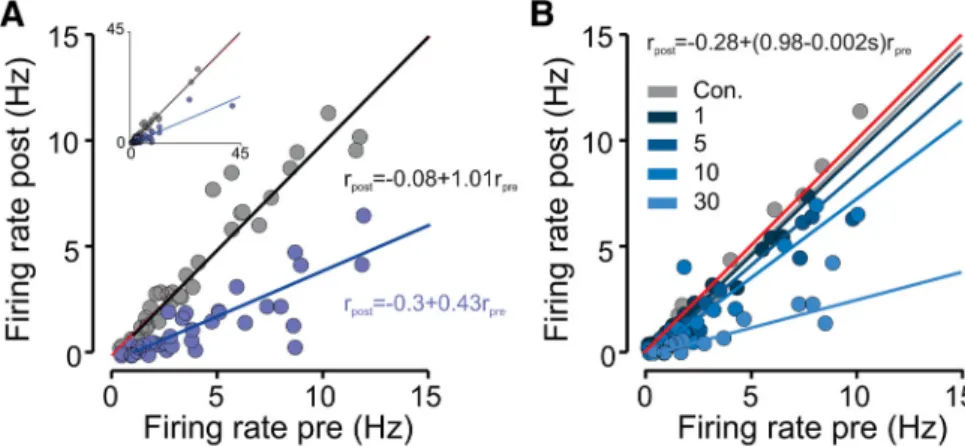
Divisive effect on spontaneous firing
We next asked whether the magnitude of inhibition of
spontane-ous activity depended on the firing rate of the recorded unit.
Figure 3
A shows, for each inhibited neuron, the firing rate during
photostimulation and a time-matched period in control trials as
a function of its baseline firing rate calculated during a 4 s time
window just before photostimulation onset. We found that firing
rates during DRN photostimulation were correlated strongly
with baseline firing rates in a proportional or divisive manner,
i.e., the larger the baseline firing rate, the larger the 5-HT-induced
inhibition. We used a linear regression to model the divisive and
subtractive components of inhibition (see Eq. 1). Consistent with
a divisive effect on spontaneous firing, we found that the
coeffi-cient of the term corresponding to an
in-teraction between firing rates before and
during photostimulation (
3in Eq. 1) was
significantly less than 0 [fitted value,
⫺0.58; 95% confidence interval (CI),
⫺0.64 to ⫺0.52; p ⬍ 0.001], whereas

2,
the coefficient of the additive
photo-stimulation term was not (fitted value,
⫺0.22; 95% CI, ⫺0.70 to 0.26; p ⬎ 0.05).
Additionally, the slope was dependent
on the frequency of
photostimula-tion (Fig. 3
B), with higher
phot-ostimulation frequencies yielding a
more prominent change in slope (fitted
coefficient of divisive term,
⫺0.024;
95% CI,
⫺0.02 to ⫺0.028; p ⬍ 0.00l).
These observations show an average
divisive effect of 5-HT action on
spon-taneous firing. One possible
explana-tion for this effect is that the magnitude
of inhibition correlates with the average
baseline activity of an individual neuron
but that the firing rate of each neuron is
reduced by a fixed amount, regardless
of its current state of activity.
Alterna-tively, the amount of inhibition received
by each neuron may actually covary
with instantaneous firing rate
fluctua-tions on a moment-by-moment
(trial-by-trial) basis. To distinguish between
these alternatives, we analyzed the effect
of photostimulation on instantaneous
firing rates by fitting a linear model for
each unit, in which we predict firing
rates immediately before and after
pho-tostimulation onset (Eq. 1;
Fig. 4
B).
Fig-ure 4, A and C, shows an example unit in
which the fluctuations in spontaneous
firing rate were correlated strongly
be-tween the two time periods. Consistent
with a divisive mechanism, we found
that the slope of the fitted linear curves
was reduced significantly in the
pres-ence of 5-HT and that the intercept was
not, both in the example unit and across
the population of neurons (fitted
coef-ficient of divisive term,
⫺0.59 ⫾ 0.09;
p
⬍ 0.001; fitted coefficient of
subtrac-tive term,
⫺0.025 ⫾ 0.04; n ⫽ 14; p ⬎
0.05, Wilcoxon’s sign-rank test with
Bonferroni’s correction for multiple
comparisons;
Fig. 4
D). Thus, 5-HT
ap-pears to have a divisive scaling effect not
just on a neuron-by-neuron basis but
also on the momentary firing rates of
individual neurons.
DRN 5-HT stimulation inhibits aPC activity during
odor presentation
Next, we examined the effect of DRN photostimulation on
odor-evoked neural activity in the aPC. To this end, anesthetized mice
were presented with odorants using a custom-built olfactometer
(see Materials and Methods). Odors evoked a significant
re-sponse in 33 neurons (52%), of which 25 (40%) were also
inhib-ited by light. Although some aPC neurons were inhibinhib-ited by
odors, all the units that were both odor responsive and light
modulated exhibited increased firing rates during odor delivery
and decreased firing rates during DRN photostimulation.
Figure
5
A shows an example odor-responsive neuron in which both
spontaneous and odor-evoked activity were inhibited by DRN
photostimulation. Thus, 5-HT photostimulation had an overall
Figure 1. DRN 5-HT photostimulation results in a prominent suppression of aPC spontaneous activity. A, Top, Schematic of the experimental setup. ChR2-expressing DRN neurons were photostimulated with blue light using an optical fiber. A recording electrode (Rec.) was placed in the aPC to monitor single-unit activity and its modulation by photostimulation (Photostim.). Bottom, Example sagittal section taken from a SERT–Cre transgenic mouse infected previously with AAV2/1–Flex–ChR2–YFP. Only cells expressing the SERT also express yellow fluorescent protein (YFP) and are therefore fluorescent. B, Example of sponta-neous activity of an aPC unit and its response to DRN photostimulation. Top, Single-trial raw data aligned on photostimulation onset (blue horizontal bar, 5 mW, 10 ms pulses at 20 Hz, the stimulation lasted 3 s). Middle, Raster plot in which each tic is a single-unit spike and each row represents a single trial. Trials were interleaved randomly but are shown sorted here for display purposes. Blue ticks correspond to photostimulated trials and black to control. The red line marks photostimulation onset. PSTHs of control and photostimulated trials (smoothed using a Gaussian filter with 250 ms SD; bottom). C, Top, Heat map plot of the population PSTHs. The z-scored PSTH of each neuron is presented as a row (n⫽ 63 neurons) aligned on photostimulation onset. Neurons were sorted according to their modulation by photostimulation. Bottom, Grand average z-scored PSTH of all neurons during photostimulated trials (shaded patches around the mean represent ⫾SEM).Acrossthepopulationofneurons,photostimu-lation frequencies varied between 5 and 30 Hz, in cases in which a unit was stimulated with more than one frequency, the PSTH corresponding to the highest frequency is shown. D, ROC-based MIs for all recorded neurons (see Materials and Methods). Blue bars represent significantly inhibited units (Inh.), red significantly excited (Exc.), and gray not significantly modulated (n.s.; p⬍ 0.05, permutation test).
inhibitory effect on firing during odor presentation, but we
won-dered whether this effect was similar to that observed on
sponta-neous activity or not. If inhibition shows the same divisive effect
it showed on spontaneous firing, it should also cause a
propor-tional reduction in the odor-evoked component of the response.
Conversely, if 5-HT photostimulation affects spontaneous and
odor-evoked firing differently, this may not hold. In particular, if
spontaneous firing were affected selectively, the odor response
could be unaffected.
To reveal the effect of 5-HT photostimulation during odor
stimulation more precisely, we subtracted the average PSTH for
odor alone (Fig. 5
B1) from the average odor PSTH for odor with
photostimulation (Fig. 5
B2) to form a difference PSTH that
rep-resents the effect of photostimulation (Fig. 5
B3). We found a
striking similarity between the photostimulation effect measured
using this difference during odor stimulation (Fig. 5
B3) and that
measured during spontaneous activity (Fig. 1
C).
Across the population of units (n
⫽ 63), MI values in the
presence and absence of odors were very similar (Fig. 5
C), and the
sign of modulation of spontaneous activity and odor-evoked
ac-tivity was consistent for all neurons. Moreover, the magnitude of
modulation (measured as the absolute firing rate change relative
to the corresponding control, nonstimulated condition) induced
by photostimulation in the presence or absence of odors was
similar (fitted slope, 1.12; n
⫽ 63; slope different from 0, p ⬍
0.001;
Fig. 5
D). In summary, these analyses showed that the
amount of photostimulation effect on aPC firing does not
de-pend on the presence or absence of an odor stimulus.
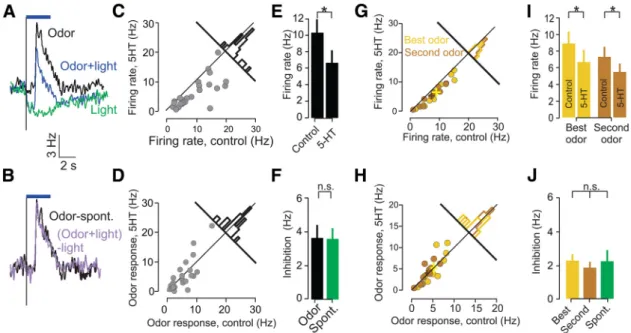
DRN 5-HT stimulation yields subtractive inhibition with
respect to odor-evoked firing
Because odor stimuli increased the firing rates but did not
in-crease inhibition, these data suggested that DRN 5-HT
modula-tion is not purely divisive in the presence of an odor. To verify
this, we next performed a similar subtractive analysis to reveal the
effect of photostimulation from the perspective of the odor
re-sponse itself. We restricted the analysis to those neurons that
were both excited by odors and inhibited by DRN
photostimula-tion (n
⫽ 25). To reveal the quantitative effect of 5-HT
photostimulation-mediated inhibition on the odor response, we
subtracted the average response PSTH for photostimulation
dur-ing spontaneous activity from the PSTH for photostimulation
during odor presentation (Fig. 6
A). The resulting difference
could then be compared with the odor-evoked response in the
absence of photostimulation. This analysis revealed that the
com-ponent of firing driven by the odor was unaltered by
photostimu-lation (Fig. 6
B). This result held true not only for the population
average odor-evoked PSTHs but also when comparing the
individual odor responses of each neuron with or without
pho-tostimulation (Fig. 6
C,D). In other words, although
photostimu-lation reduced firing rates during odor presentation (average
reduction in firing rates after photostimulation, 3.7
⫾ 0.78 Hz;
n
⫽ 25; p ⬍ 0.001, Wilcoxon’s sign-rank test;
Fig. 6
E), this effect
was entirely accounted for by the loss of spontaneous (baseline)
Figure 2. Dose-dependent suppression of aPC spontaneous activity. A, Relationship be-tween photostimulation frequency and modulation magnitude in one example unit. Top, Ras-ter plot of single-unit spikes with trials sorted by photostimulation frequency. The different colors represent different photostimulation frequencies, which are also indicated to the left of the plot. The red line marks photostimulation onset. PSTHs of 10 Hz (red) and 30 Hz (green) photostimulated trials (smoothed using a Gaussian filter with 250 ms SD; bottom). B, Relation-ship between photostimulation frequency and modulation magnitude in all significantly inhib-ited units (n⫽ 15). Top, Average normalized PSTHs (shaded patches represent mean ⫾ SEM). Bottom, Dose–response plot. Each bar corresponds to the normalized firing rates for the differ-ent photostimulation frequencies (same color scheme as in A and top panel). Error bars repre-sent SEM, and asterisks denote significant differences between pairs of photostimulation frequencies assessed using Tukey–Kramer post hoc comparisons after a Kruskal–Wallis test. C, Top, Relationship between photostimulation duration and modulation magnitude in one ex-ample unit. Raster plot of single-unit spikes with trials sorted according to photostimulation duration. The different colors represent different photostimulation durations, which are also indicated to the left of the plot. The red lines delineate photostimulation onset and offset.
4
Bottom, PSTHs of 2.1 s (red) and 7.0 s (green) photostimulation duration trials (smoothed using a Gaussian filter with 250 ms SD). D, Relationship between photostimulation duration and modulation magnitude in all significantly inhibited units (n⫽5).Top,Averagenormalized PSTHs (shaded patches represent mean⫾ SEM). Bottom, Dose–response curve. Normalized firing rate (fraction of control) is plotted as a function of the photostimulation duration. Error bars represent SEM. Black line is the regression line. The correlation coefficient and p value of the regression are indicated below.
spikes. Thus, as seen above (Fig. 5
D), the
amount of inhibition was not significantly
different between baseline and odor trials
(average difference in inhibition between
odor-evoked and baseline firing rates,
0.056
⫾ 0.64 Hz; n ⫽ 25; p ⬎ 0.5,
Wilco-xon’s sign-rank test;
Fig. 6
F ).
To exclude the possibility that the lack
of effect on odor responses is attributable
to saturation of responses to odors, we
ex-amined the effect of 5-HT
photostimula-tion on responses elicited by multiple
odorants. In neurons that responded to
more than one odor, the same result held
for both the odorant eliciting the largest
response (“best odor”) and for other
odorants eliciting weaker responses (Fig.
6
G,H ). Although both odor responses
were suppressed after photostimulation
(average reduction in best/second
odor-evoked firing, 2.25
⫾ 0.40 Hz/1.85 ⫾ 0.33;
n
⫽ 10; p ⬍ 0.01 for both, Wilcoxon’s
sign-rank test;
Fig. 6
I ), the amount of
in-hibition did not differ between the two
odors and baseline inhibition ( p
⬎ 0.8,
Kruskal–Wallis test; n
⫽ 10;
Fig. 6
J ).
Together, these results show that,
whereas DRN 5-HT stimulation effects on
spontaneous activity were always
propor-tional to the instantaneous spontaneous
firing rate, i.e., divisive, they were
inde-pendent of additional firing caused by
odor presentation, i.e., subtractive.
Divisive effect on baseline firing during
odor presentation
The divisive effect on spontaneous
ac-tivity and lack of effect on odor
re-sponses suggests that the net odor
response consists of two independent
components: a first component that is
continuously present and is divisively
inhibited by 5-HT and a second
compo-nent that is recruited by odor stimuli
and is independent of DRN activation.
If this dual-component model is
corr-ect and if trial-by-trial fluctuations
(“noise”) between these two
compo-nents are uncorrelated or weakly
corre-lated, then a trial-by-trial analysis ought
to reveal the divisive effect of 5-HT
stimulation relative to baseline activity
and an additive odor-evoked
compo-nent, unaffected by photostimulation
(Fig. 7). To test this hypothesis, we used
a regression analysis similar to the one
shown in
Figure 4, this time analyzing
the effect of photostimulation on
in-stantaneous firing rates by predicting,
for each unit– odor pair, its firing rates
immediately before photostimulation
onset to those immediately after odor
onset.
Figure 7
A shows an example
Figure 3. Suppression of average aPC spontaneous activity linearly scales with baseline firing rate. A, Scatter plot comparing firing rates under control and photostimulated trials for all significantly inhibited units (n⫽ 38). A linear regression fit is super-imposed. Two outlying points were excluded from the main plot for clarity purposes and are shown in the inset. The linear regression equations are shown next to the corresponding regression lines. B, Same as A for a subpopulation of neurons that were photostimulated with 1, 5, 10, and 30 Hz (n⫽ 15). Con., Control.
Figure 4. Suppression of instantaneous aPC spontaneous activity linearly scales with baseline firing rate. A, Raster plot and PSTH (smoothed using a Gaussian filter with 250 ms SD) of single-unit spikes with trials sorted according to photo-stimulation versus control and by baseline firing rate. Blue ticks belong to photostimulated trials and black to control, respectively. Blue horizontal line delineates photostimulation delivery. B, Scheme of the linear model used to predict, for each unit, its post firing rate as a function of pre firing rate and photostimulation condition. Div., Divisive; Sub., subtractive. C, Single-trial correlation between firing rates before and after photostimulation onset for the example unit shown in A (blue circles). A similar comparison was made for control, nonstimulated trials (gray circles). Solid lines indicate linear regression curves. Corresponding linear regression equations are shown as well. D, The vales of the average regression coefficients (n⫽ 14). Error bars represent SEM; *p ⬍ 0.05, Wilcoxon’s sign-rank test with Bonferroni’s correction for multiple comparisons.
odor-responsive unit. Both pre-photostimulation firing rates
and poststimulation responses, reflecting odor and
photo-stimulation contributions, fluctuated substantially from
trial-to-trial. We performed a linear fit to describe the relationship
between prestimulation and poststimulation firing rates
across trials (see Eq. 2;
Fig. 7
B, C). As predicted from the
two-component model, odor delivery had an additive effect
on firing, whereas photostimulation had a divisive effect.
Im-portantly, we did not find significant interactions between the
two components (fitted coefficients of both subtractive and
divisive odor-photostimulation interaction terms,
⫺0.02 and
0.01; 95% CIs,
⫺0.20 to 0.16 and ⫺0.53 to 0.55; values
corre-spond to

5and

6in Eq. 2, respectively; p
⬎ 0.05 for both).
Across the population of neuron– odor pairs, we found the
same result, namely that odors exerted an additive effect on
firing rates (fitted coefficient of additive term,
⫺0.29 ⫾ 0.06;
p
⬍ 0.001; fitted coefficient of multiplicative term, ⫺0.26 ⫾
0.09; p
⬎ 0.05, Wilcoxon’s sign-rank test with Bonferroni’s
correction for multiple comparisons; n
⫽ 14; values
corre-spond to

2and

4in Eq. 2;
Fig. 7
D), photostimulation
ex-erted a divisive effect (fitted coefficient of divisive term,
⫺0.63 ⫾ 0.05; p ⬍ 0.001; value corresponds to

3in Eq. 2;
Fig.
7
D), and neither of the interaction terms were significantly
different from 0 (fitted coefficients of subtractive and divisive
odor–photostimulation interaction terms,
⫺0.04 ⫾ 0.06, and
0.09
⫾ 0.11, respectively; p ⬎ 0.05 for both; values correspond
to

5and

6in Eq. 2;
Fig. 7
D).
DRN 5-HT stimulation preserves sniff phase coupling
aPC neurons show strong modulation of their firing rates by
the respiration (sniffing) cycle (Wilson, 1998;
Litaudon et al.,
2003), which may be important for odor coding (Kepecs et al.,
2006). Therefore, we examined the effect of DRN 5-HT
pho-tostimulation on odor-evoked responses analyzed with
re-spect to the sniff cycle.
Figure 8
A shows an example unit whose
firing was locked strongly to respiration under both
photo-stimulation and control conditions. Sniff-averaged firing rates
decreased monotonically with time after odor onset. We took
advantage of this drop in amplitude across sniffs to test
whether photostimulation has a divisive or subtractive effect
described across odors and neurons. We found that the effect
on firing rates across consecutive sniffs was subtractive, i.e.,
all were inhibited by a similar magnitude (Fig. 8
B), consistent
with the observations on odor responses in general (Figs. 5–7).
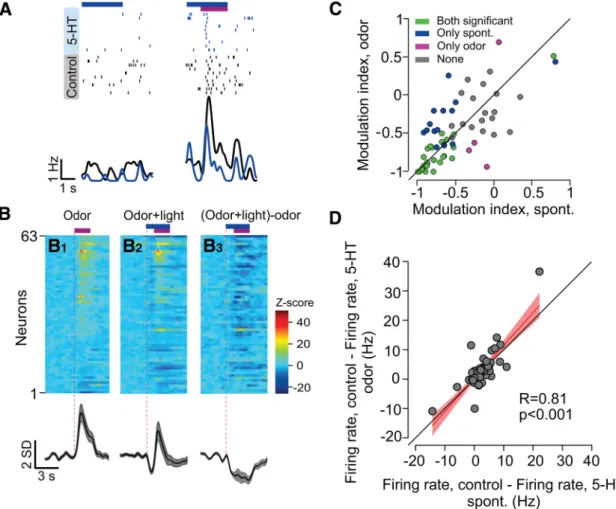
Figure 5. DRN 5-HT photostimulation inhibits aPC activity during odor presentation. A, Example raster plot (top) and PSTH (bottom) of a single aPC neuron in spontaneous trials (left) and in response to odor (right). Blue and magenta horizontal lines delineate photostimulation and odor delivery, respectively. PSTHs were smoothed using a Gaussian filter with 25 ms SD. B, Top, Heat maps of the population odor responses (n⫽63).EachrowisthenormalizedPSTHofoneunit.B1,Controltrials;B2,photostimulationtrials;B3,thedifferencebetweentheB1andB2plots.Bottom,The corresponding grand averages. C, Scatter plot of photostimulation MIs for spontaneous firing (blank stimulus) and during odor presentation. Green circles represent significantly inhibited units under both odor and spontaneous (blank) conditions, blue only spontaneous conditions, magenta only odor conditions, and black not significantly modulated ( p⬍0.05,permutationtest).D,Scatterplot and linear regression fit of the change in firing rate for spontaneous firing (blank stimulus) and during odor presentation. The change is measured as the difference between the average firing rate during the stimulus period and the corresponding nonstimulated control (see Materials and Methods). The correlation coefficient and p value of the regression are indicated below. Spont., Spontaneous.
We did not find an effect of photostimulation on sniff
fre-quency under baseline conditions (average difference in sniff
frequency between photostimulated and baseline conditions,
0.015
⫾ 0.02 Hz; n ⫽ 25; p ⬎ 0.05, Wilcoxon’s sign-rank test;
Fig. 8
D, E), and, although we did observe a modest increase in
sniff frequency after odor presentation (average difference in
sniff frequency between odor and baseline conditions, 0.071
⫾
0.02 Hz; n
⫽ 25; p ⬍ 0.05, Wilcoxon’s sign-rank test;
Fig.
8
F, G), this effect was comparable during control and
photo-stimulated trials (average difference in sniff frequency
be-tween photostimulated and control trials during odor
presentation, 0.0078
⫾ 0.045 Hz; n ⫽ 25; p ⬎ 0.05, Wilcoxon’s
sign-rank test). To test the effect of photostimulation on phase
coupling between neuronal firing and respiration, we
re-stricted our analysis to units inhibited significantly by light
that also responded to odor stimulation in a sniff-locked
manner in both control and photostimulated trials (n
⫽ 21
neuron– odor pairs). Despite the marked decrease in firing
rates, we found no effect of DRN photostimulation on the
preferred sniff phase of responses across the population
(av-erage difference in preferred sniff phase, 0.083
⫾ 0.12 radians;
n
⫽ 21; p ⬎ 0.5, Wilcoxon’s sign-rank test;
Fig. 8
H, I ).
Pho-tostimulation did cause a small but significant increase in the
strength of coupling between firing and respiration (average
magnitude of sniff coupling in control vs photostimulation
conditions, 0.33
⫾ 0.041 vs 0.39 ⫾ 0.045; n ⫽ 21; p ⬍ 0.05,
Wilcoxon’s sign-rank test;
Fig. 8
J, K ).
Discussion
The main finding of this study is that specific activation of 5-HT
neurons in vivo rapidly modulates the activity of olfactory cortex
(aPC) neurons by suppressing spontaneous firing while sparing
odor-evoked firing. The effects on spontaneous firing were
divisive with respect to moment-by-moment fluctuations in
spontaneous activity (Fig. 4), but because the odor-dependent
component was unaffected (Fig. 6), they were subtractive with
respect to the net odor response (Fig. 7). Respiration phase
cou-pling was enhanced but its phase was unaltered (Fig. 8). These
findings present novel evidence for the role of serotonergic
neu-romodulation in sensory processing and indicate that it acts on
fast timescales to alter the balance between different sources of
neural activity in sensory systems.
Functional implications: divisive inhibition of
spontaneous activity
Remarkably, the effects of DRN 5-HT neuron activation were
consistent with a simple dual-component model in which action
potentials in sensory cortex originate from two independent
sources: (1) a background or spontaneous source that fluctuates
independently of sensory input and is modulated by 5-HT; and
Figure 6. Baseline inhibition accounts for odor response inhibition. A, Mean PSTHs of all neurons showing significant odor responses and light modulations in the absence (black line) and presence (blue line) of DRN photostimulation (n⫽ 25). The green line represents the average PSTH after DRN photostimulation in the absence of odorant presentation. In cases in which a unit was stimulated with more than one odor, the PSTH corresponding to the strongest response is used (A–F). B, Mean PSTHs of all neurons showing significant odor responses and light modulations in the absence (black line) and presence (purple line) of DRN photostimulation after subtraction of the corresponding baselines (spontaneous PSTHs). C, Scatter plot comparing firing rates of activity during odor presentation in the absence and presence of photostimulation. Each point corresponds to a single unit (n⫽ 25). Bar histogram shows the distribution of differences between photostimulated and control firing rates across the population. The distribution is shifted away from the main diagonal toward the bottom right, indicating inhibition during photostimulation. D, Scatter plot comparing odor responses (difference between firing rates and baseline) in the absence and presence of photostimulation. Each point corresponds to a single unit (n⫽ 25). Bar histogram shows the distribution of differences between photostimulated and control firing rates across the population. The distribution is centered around the main diagonal, indicating no effect of photostimulation on odor responses after accounting for the effect of DRN activation alone. E, Bar graphs comparing firing rates in the presence and absence of photostimulation. Error bars represent SEM; *p⬍0.001, Wilcoxon’s sign-rank test. F, Bar graphs comparing photostimulation-evoked decrease in firing in the presence and absence of odor stimulation. Error bars represent SEM; p⬎ 0.5, Wilcoxon’s sign-rank test. G, Scatter plot comparing firing rates during odor presentation for odors evoking maximal responses (yellow) and a second odor (brown), in the absence and presence of photostimulation. Each point corresponds to a single neuron– odor pair (n⫽ 10 neurons). Bar histograms show the distribution of differences between photostimulated and control firing rates across the population. H, Scatter plot comparing firing rates of odor responses for odors evoking maximal responses (yellow) and a second odor (brown), in the absence and presence of photostimulation (n⫽ 10 neurons). Bar histograms as in G. I, Bar graphs comparing firing rates in the presence and absence of photostimulation for both best (yellow) and a second odor (brown). Error bars represent SEM; *p⬍ 0.001 for both odors, Wilcoxon’s sign-rank test. J, Bar graphs comparing photostimulation-evoked decrease in firing in the presence of the two odors and baseline conditions. Error bars represent SEM; p⬎ 0.8, Kruskal–Wallis test. Spont., Spontaneous.
(2) a stimulus-evoked source that is unaffected by 5-HT. The
effects of 5-HT on spontaneous activity were multiplicative or
divisive in nature. That is, they preserved the relative magnitude
of activity both across the population of neurons and across
in-dividual neurons in time. Thus, 5-HT preserved the information
content of spontaneous activity while changing only the gain.
Such divisive effects can be compared with divisive
normaliza-tion, a local operation thought to be a canonical neural
compu-tation (Carandini and Heeger, 2012).
The present study is one of the first
systematic studies of the detailed effects of
the activation of a neuromodulatory
sys-tem on spontaneous and sensory-evoked
single-unit activity in vivo. This was
achieved by optogenetic activation of
5-HT DRN neurons. Although this is not
exactly the same as endogenous activity,
DRN neurons, like other
neuromodula-tory neurons, do display highly
synchro-nous stimulus-locked firing in vivo (Ranade
and Mainen, 2009). Therefore, it is highly
relevant to understanding the endogenous
systems-wide effects of 5-HT on sensory
processing. Because the major
neuromodu-lators not only share postsynaptic
mecha-nisms but interact with one another at the
physiological level, the effects described here
are likely relevant to understanding the
gen-eral computational architecture of the
neu-romodulatory systems (Dayan, 2012).
The functional implication of the
divi-sive suppression of spontaneous activity
hinges on the interpretation of
spontane-ous firing. If spontanespontane-ous activity reflects
noise (Shadlen and Newsome, 1994), then
by decreasing it, DRN 5-HT activation
in-creases the signal-to-noise ratio, as has
been proposed for other
neuromodula-tors (Sara, 1985;
Servan-Schreiber et al.,
1990;
Hasselmo et al., 1997).
Alterna-tively, if spontaneous activity reflects
in-formation, such as an expectation or prior
(Fiser et al., 2010;
Berkes et al., 2011),
DRN 5-HT activation decreases the
rela-tive weight of such priors relarela-tive to
sen-sory data. In this context, it is significant
that DRN 5-HT effects were strictly
pro-portional (divisive) both across neurons
and within individual neurons, as would
be required to scale the information
car-ried by spontaneous activity without
cor-rupting it. Because the 5-HT system
projects widely throughout the brain, the
scaling of spontaneous versus evoked
ac-tivity might reflect a more general
func-tion of 5-HT in the regulafunc-tion of different
sources of information for behavioral
control (Yu and Dayan, 2002;
Daw et al.,
2005).
Mechanisms of DRN 5-HT effects
It will be interesting in future studies to
address the mechanisms underlying these
effects. When exogenously applied to cortical slices in vitro, 5-HT
can modulate synaptic transmission (Winterer et al., 2011),
de-polarize interneurons via 5-HT2a receptors leading to IPSPs in
pyramidal neurons (Gellman and Aghajanian, 1993,
1994;
Marek
and Aghajanian, 1994), depolarize or hyperpolarize pyramidal
neurons (Araneda and Andrade, 1991;
Avesar and Gulledge,
2012), and decrease firing frequency adaptation in pyramidal
neurons (Sheldon and Aghajanian, 1991). Optogenetic
stimula-tion of ChR2-expressing DRN axons in vitro can excite
hip-Figure 7. Modulation of instantaneous aPC odor responses linearly scales with baseline firing rate and is the sum of control odor responses and photostimulation-induced baseline suppression. A, Raster plot and PSTH of single-unit spikes with trials sorted according to photostimulation and odor conditions and further sorted by baseline firing rate. Blue ticks belong to photostimulated plus odor trials, green to photostimulated trials, black to odor trials, and gray to control trials. Blue and magenta horizontal lines delineate photostimulation and odor delivery, respectively. B, Scheme of the linear model used to predict, for eachunit,itspostfiring rate as a function of pre firing rate, odor condition, photostimulation condition, and their interactions. C, Single-trial correlation between firing rates before and after photostimulation and/or odor onset for the example unit shown in A. Solid lines indicate linear regression curves. The different colors represent different conditions as indicated in A. D, The values of average regression coefficients (n⫽14).Error bars represent SEM; *p⬍0.05,Wilcoxon’ssign-ranktestwithBonferroni’scorrectionformultiplecomparisons.
pocampal interneurons mediated by a mixed 5-HT
3/glutamatergic
mechanism, and this may lead to hyperpolarization of pyramidal
neurons (Varga et al., 2009). Each of these effects could in principle
contribute to our results. The selectivity of 5-HT photostimulation
for spontaneous firing could reflect the known division of aPC
in-puts into a feedforward component from mitral/tufted cells in the
OB via the LOT and a feedback component reflecting recurrent
in-puts from within the piriform cortex, as well as centrifugal inin-puts
from other brain structures. In this model, release of 5-HT from
DRN axons within the aPC would selectivity inhibit the recurrent
synapses. If spontaneous activity were generated selectively by this
recurrent input and odor-evoked selectively by LOT input, then
se-lective inhibition of recurrent input by 5-HT could explain our
re-sults comprehensibly. Indeed, the neuromodulators acetylcholine
and noradrenaline have been shown to differentially inhibit
feed-back versus LOT input (Hasselmo and Bower, 1992;
Hasselmo et al.,
1997).
However, despite the parsimony of this idea, for a number of
reasons, we believe it is more likely that the simplicity of the effects is
not purely the direct result of a singular underlying mechanism but
instead reflects a well orchestrated convergence of mechanisms. As a
first issue, it is thought that odor-evoked responses are dominated by
recurrent rather than feedforward inputs (Poo and Isaacson, 2011).
To selectively preserve odor-evoked spikes, 5-HT would have to
se-lectively suppress the recurrent circuitry responsible for
spontane-ous spikes while sparing the recurrent circuitry contributing to
odor-evoked activity. Interestingly, the somatostatin-expressing class of
interneurons has been shown recently to produce a form of
subtrac-tive inhibition (Sturgill and Isaacson, 2015), resembling the effect of
5-HT.
A second complexity is that DRN 5-HT photostimulation is
likely to affect circuits outside the aPC but that may indirectly
affect spiking in the aPC. First, there are prominent 5-HT
projec-tions to the OB, in which 5-HT can inhibit transmission in the
olfactory glomeruli through a 5-HT
2Creceptor-mediated
mech-anism (Petzold et al., 2009). However, because other neuron
types in the OB express 5-HT receptors (Tecott et al., 1993;
McLean et al., 1995;
Petzold et al., 2009), the overall effect of
Figure 8. DRN photostimulation boosts respiratory coupling without changing its phase. A, Left, Example raw data trials of neural activity and breathing for a stimulated (blue) and a nonstimulated (black) trial, respectively. Magenta bar indicates the odor stimulation, and blue line indicates photostimulation. Middle, Raster plot of the example data shown on the left; each row represents a single sniff sorted from the first sniff to the last (bottom to top, respectively). Blue ticks belong to photostimulated trials and black to control. The average respiration signal is shown below. Right, Sniff phase PSTH. Inset shows a polar plot of the average sniff phase of action potentials calculated from the PSTH (200 bins). B, Sniff-averaged firing rate for all odor–neuron pairs belonging to inhibited, odor-responsive units (n⫽37).C,Scatterplotcomparingsniff-averagedfiringratesinstimulatedandcontroltrials.Notetheconstant(subtractive)shiftinfiringacrosssniff cycles. D, Instantaneous sniff rate (1/sniff length) for all inhibited neurons aligned on photostimulation onset (n⫽38).Shadedpatchesaroundthemeanrepresent⫾SEM.E,Scatterplotcomparing sniff rates in the absence and presence of photostimulation (n⫽ 38). Bar histogram shows the distribution of differences between photostimulated and control firing rates across the population. F, Instantaneous sniff rate for all light-inhibited odor-responsive neurons aligned on odor onset (n⫽ 25). G, Scatter plot comparing sniff rates in the absence and presence of odor stimulation (n⫽ 25). Bar histogram shows the distribution of differences between photostimulated and control firing rates across the population. H, Sniff-averaged spike phase distribution during photo-stimulation trials relative to the peak phase of the corresponding control distribution for the population of sniff-locked inhibited neuron– odor pairs (n⫽21pairs).Datawerealignedtothepreferred phase for each neuron– odor pair and smoothed using a Gaussian filter with 0.08 radian SD. The horizontal red line marks chance. Shaded patches around the mean represent⫾SEM. I, Scatter plot comparing preferred phases in the absence and presence of photostimulation (n⫽ 21 neuron–odor pairs). Bar histogram shows the distribution of differences between photostimulated and control firing rates across the population. J, Sniff-averaged spike phase distributions across the population of sniff-locked inhibited neuron– odor pairs (n⫽ 21 pairs) for control (black line) and photostimulation (blue line) conditions. Data were aligned to the preferred phase for each neuron– odor pair and each condition and smoothed using a Gaussian filter with 0.08 radian SD. The horizontal red line marks chance. Shaded patches around the mean represent⫾SEM. K, Scatter plot showing the differences in phase coupling between photostimulated and control trials. Bar histogram shows the distribution of differences between photostimulated and control phase coupling across the population.
5-HT on OB output cannot readily be inferred from the effect at
the glomerular level and remains to be tested. The DRN also
projects to the locus ceruleus (Imai et al., 1986) and the basal
forebrain (Semba et al., 1988) in which it excites noradrenergic
(Szabo and Blier, 2001) and inhibits cholinergic (Bengtson et al.,
2004), neurons respectively. Thus, the observed sparing of
odor-evoked activity suggests that various mechanisms within the aPC
preserve odor-evoked responses, possibly even in the face of
changing the activity in other brain areas. The contributions of
these sources to the net effects on the aPC should also be
considered.
Endogenous control of DRN activity
We have demonstrated that 5-HT can effect sensory processing
on a rapid (
⬍200 ms) timescale. Therefore, the role of 5-HT in
sensory processing will also depend on the timing of DRN 5-HT
activation during behavior. Many DRN neurons respond rapidly
to sensory stimuli (Montagne-Clavel et al., 1995;
Waterhouse et
al., 2004;
Ranade and Mainen, 2009). One previous study
exam-ined the firing of DRN units during an odor discrimination task
(Ranade and Mainen, 2009). The firing of many DRN neurons
(of unrevealed neurochemical identity) was transiently
sup-pressed shortly before and during odor sampling (Ranade and
Mainen, 2009). This decrease would, interpreted in light of the
present findings, yield an increase in aPC spontaneous activity. If
this is the case for 5-HT neurons, this would be more consistent with
spontaneous activity as reflecting stimulus priors, which would be
most relevant during stimulus presentation, rather than noise, which
would be most disruptive during stimulus presentation.
DRN neurons also respond to broad range of motor and
reward-related events (Ranade and Mainen, 2009;
Liu et al., 2014;
Cohen et al., 2015;
Zhou et al., 2015), and longer-term 5-HT
effects are also to be expected. These will place sensory processing
in the olfactory system under the control of higher-order
behav-ioral states and conditions. The precise divisive effects on
spon-taneous activity reported here suggest that the modulatory effects
of this system are suitable to regulate the relative gain of different
information sources based on behavioral demands. Future
exper-iments in behaving animals will be important to reveal how DRN
5-HT activity affects perception and perceptual expectations.
References
Araneda R, Andrade R (1991) 5-Hydroxytryptamine2 and 5-hydroxytryptamine 1A receptors mediate opposing responses on membrane excitability in rat asso-ciation cortex. Neuroscience 40:399–412.CrossRef Medline
Avesar D, Gulledge AT (2012) Selective serotonergic excitation of callosal projection neurons. Front Neural Circuits 6:12.CrossRef Medline
Basseville M, Nikiforov IV (1993) Detection of abrupt changes: theory and application. Englewood Cliffs, NJ: Prentice-Hall.
Bengtson CP, Lee DJ, Osborne PB (2004) Opposing electrophysiological actions of 5-HT on noncholinergic and cholinergic neurons in the rat ventral pallidum in vitro. J Neurophysiol 92:433– 443.CrossRef Medline
Berkes P, Orba´n G, Lengyel M, Fiser J (2011) Spontaneous cortical activity reveals hallmarks of an optimal internal model of the environment. Sci-ence 331:83– 87.CrossRef Medline
Carandini M, Heeger DJ (2012) Normalization as a canonical neural com-putation. Nat Rev Neurosci 13:51– 62.CrossRef Medline
Cohen JY, Amoroso MW, Uchida N (2015) Serotonergic neurons signal reward and punishment on multiple timescales. eLife 4:e06346.CrossRef Medline
Cools R, Roberts AC, Robbins TW (2008) Serotoninergic regulation of emotional and behavioural control processes. Trends Cogn Sci 12:31– 40.
CrossRef Medline
Datiche F, Luppi PH, Cattarelli M (1995) Serotonergic and non-serotonergic projections from the raphe nuclei to the piriform cortex in the rat: a cholera toxin B subunit (CTb) and 5-HT immunohistochemical study. Brain Res 671:27–37.CrossRef Medline
Davis M, Strachan DI, Kass E (1980) Excitatory and inhibitory effects of serotonin on sensorimotor reactivity measured with acoustic startle. Sci-ence 209:521–523.CrossRef Medline
Daw ND, Niv Y, Dayan P (2005) Uncertainty-based competition between prefrontal and dorsolateral striatal systems for behavioral control. Nat Neurosci 8:1704 –1711.CrossRef Medline
Dayan P (2012) Twenty-five lessons from computational neuromodula-tion. Neuron 76:240 –256.CrossRef Medline
Dayan P, Huys QJ (2009) Serotonin in affective control. Annu Rev Neurosci 32:95–126.CrossRef Medline
Deemyad T, Metzen MG, Pan Y, Chacron MJ (2013) Serotonin selectively enhances perception and sensory neural responses to stimuli generated by same-sex conspecifics. Proc Natl Acad Sci USA 110:19609 –19614.
CrossRef Medline
De Olmos J, Heimer L (1980) Double and triple labeling of neurons with fluorescent substances; the study of collateral pathways in the ascending raphe system. Neurosci Lett 19:7–12.CrossRef Medline
Dugue´ GP, Lo¨rincz ML, Lottem E, Audero E, Matias S, Correia PA, Le´na C, Mainen ZF (2014) Optogenetic recruitment of dorsal raphe serotoner-gic neurons acutely decreases mechanosensory responsivity in behaving mice. PLoS One 9:e105941.CrossRef Medline
Fiser J, Berkes P, Orba´n G, Lengyel M (2010) Statistically optimal percep-tion and learning: from behavior to neural representapercep-tions. Trends Cogn Sci 14:119 –130.CrossRef Medline
Fonseca MS, Murakami M, Mainen ZF (2015) Activation of dorsal raphe serotonergic neurons promotes waiting but is not reinforcing. Curr Biol 25:306 –315.CrossRef Medline
Friston K (2010) Is the free-energy principle neurocentric? Nat Rev Neuro-sci 11:605.CrossRef Medline
Gautam SH, Verhagen JV (2012) Retronasal odor representations in the dorsal olfactory bulb of rats. J Neurosci 32:7949 –7959.CrossRef Medline
Gellman RL, Aghajanian GK (1993) Pyramidal cells in piriform cortex re-ceive a convergence of inputs from monoamine activated GABAergic interneurons. Brain Res 600:63–73.CrossRef Medline
Gellman RL, Aghajanian GK (1994) Serotonin2 receptor-mediated excita-tion of interneurons in piriform cortex: antagonism by atypical antipsy-chotic drugs. Neuroscience 58:515–525.CrossRef Medline
Haberly LB (1985) Neuronal circuitry in olfactory cortex: Anatomy and functional implications. Chem Senses 10:219 –238.CrossRef
Haberly LB (1998) Olfactory cortex. In: The synaptic organization of the brain (Shepherd GM, ed), pp 377– 416. New York: Oxford UP. Haberly LB (2001) Parallel-distributed processing in olfactory cortex: new
insights from morphological and physiological analysis of neuronal cir-cuitry. Chem Senses 26:551–576.CrossRef Medline
Hasselmo ME, Bower JM (1992) Cholinergic suppression specific to intrin-sic not afferent fiber synapses in rat piriform (olfactory) cortex. J Neuro-physiol 67:1222–1229.Medline
Hasselmo ME, Linster C, Patil M, Ma D, Cekic M (1997) Noradrenergic suppression of synaptic transmission may influence cortical signal-to-noise ratio. J Neurophysiol 77:3326 –3339.Medline
Imai H, Steindler DA, Kitai ST (1986) The organization of divergent axonal projections from the midbrain raphe nuclei in the rat. J Comp Neurol 243:363–380.CrossRef Medline
Isaacson JS (2010) Odor representations in mammalian cortical circuits. Curr Opin Neurobiol 20:328 –331.CrossRef Medline
Jacobs BL, Azmitia EC (1992) Structure and function of the brain serotonin system. Physiol Rev 72:165–229.Medline
Kepecs A, Uchida N, Mainen ZF (2006) The sniff as a unit of olfactory processing. Chem Senses 31:167–179.CrossRef Medline
Kersten D, Mamassian P, Yuille A (2004) Object perception as Bayesian inference. Annu Rev Psychol 55:271–304.CrossRef Medline
Knill DC, Pouget A (2004) The Bayesian brain: the role of uncertainty in neural coding and computation. Trends Neurosci 27:712–719.CrossRef Medline
Litaudon P, Amat C, Bertrand B, Vigouroux M, Buonviso N (2003) Piri-form cortex functional heterogeneity revealed by cellular responses to odours. Eur J Neurosci 17:2457–2461.CrossRef Medline
Liu S, Aungst JL, Puche AC, Shipley MT (2012) Serotonin modulates the population activity profile of olfactory bulb external tufted cells. J Neu-rophysiol 107:473– 483.CrossRef Medline
Liu Z, Zhou J, Li Y, Hu F, Lu Y, Ma M, Feng Q, Zhang JE, Wang D, Zeng J, Bao J, Kim JY, Chen ZF, El Mestikawy S, Luo M (2014) Dorsal raphe neurons