THIS REPORT WAS PREPARED EXCLUSIVELY FOR ACADEMIC PURPOSES BY [INSER STUDENT’S NAME], A MASTERS IN FINANCE STUDENT OF THE NOVA SCHOOL OF BUSINESS AND ECONOMICS.THE REPORT WAS SUPERVISED BY A NOVA SBE FACULTY MEMBER, ACTING IN
A MERE ACADEMIC CAPACITY, WHO REVIEWED THE VALUATION METHODOLOGY AND THE FINANCIAL MODEL.
M
ASTERS IN
M
ANAGEMENT
Our recommendation for Navigator`s stock performance is a BUY, with a price target of €5.56 for FY18, which represents a 18% upside potential, based on our valuation. Navigator`s solid
balance sheet, high operational efficiency and strong cash flow generation provide a potential attractive investment in the
stock market.
Pulp and paper industry is facing a full transformation.
New market and consumer needs, higher competition, and increase on regulatory policies, will significantly impact the industry in the nearly future. Consequently companies have to innovate
and embrace digitalization in order to remain competitive.
Navigator has been preparing the future by investing on
its production capacity and innovation of its paper and pulp
mills and therefore, the company has the most modern facilities within the industry, resulting in high efficiency levels.
Navigator has been also shifting its business portfolio
to other profitable segments, namely Tissue and Packaging, due
the deterioration of UWF paper market in the future.
Despite the impact from the forest fires occurred in Portugal during FY17, Navigator was capable to take advantage of
vertical integration align with its cost reduction measures, to
remain as one of the most efficient players in the market.
It is predictable a generous dividend pay-out for the next periods, supported by the mind-set from the principal shareholder and privileged positioning of the company on the pulp and paper market environment.
T
HE
N
AVIGATOR
C
OMPANY
,
S.A.
C
OMPANY
R
EPORT
P
ULP AND
P
APER
23
M
AY2018
STUDENT: BERNARDO BURNAY
[email protected]
Investing today to embrace the Future
Outstanding performance leads to success
Recommendation: BUYPrice Target FY18: 5.56 €
Price (as of 23-May-18) 4.97 €
Reuters: NVGR.LS, Bloomberg: NVG PL
52-week range (€) 3.55 - 4.97 Market Cap (€m) 3,228.7 Outstanding Shares (m) 717.5
Source: Thomson Reuters
80,0 100,0 120,0 140,0
Navigator Company SA Euronext Lisbon PSI 20 Index
Source: Thomson Reuters
(Values in € millions) 2017 2018E 2019F Revenues 1,637 1,695 1,731 EBITDA 404 418 418 Net Profit 208 187 190 EPS 0.29 0.26 0.26 P/E 14.7 25.6 26.0 EBITDA margin 24.7% 24.6% 24.2% ROE 16.8% 15,8% 16.0% ROA 8.6% 7.7% 7.8% Div Yield 6.1% 5.0% 4.0% Net Debt / EBITDA 1.9x 1.8x 1.7x EV / EBITDA 10.8x 11.5x 11.8x Source: Thomson Reuters and analyst estimates.
“THE NAVIGATOR COMPANY S.A.” COMPANY REPORT
Table of Contents
COMPANY OVERVIEW ... 4
COMPANY DESCRIPTION ... 4 SWOT ANALYSIS ... 5 SHAREHOLDER STRUCTURE... 5THE SECTOR ... 6
MACROECONOMIC OVERVIEW ... 6PULP AND PAPER ... 6
WOOD ... 8
FINANCIALS ...10
VALUATION ...14
BUSINESS PLAN ASSUMPTIONS ... 14
WACC AND TERMINAL VALUE ... 18
EQUITY VALUE ... 20 MULTIPLE VALUATION ... 20
OTHER PROJECTS ...22
INVESTMENT RISKS ...23
APPENDIX ...25
FINANCIAL STATEMENTS ...25
REPORT RECOMMENDATIONS ... 26“THE NAVIGATOR COMPANY S.A.” COMPANY REPORT
Executive summary
We initiate with a BUY recommendation for Navigator, reflecting a one year
target price of €5.56, with an upside potential of 18% when comparing with
€4.97 price as of 11th May 2018. The upside potential includes the capital gain
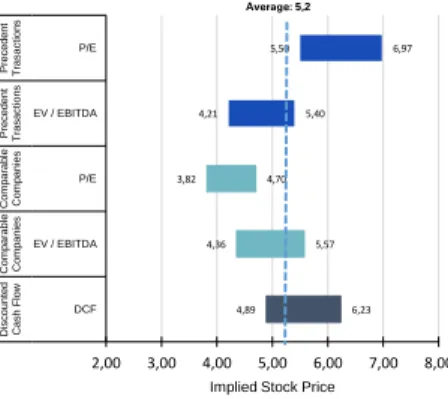
between target and actual price, plus the cash gain from 2018 announced dividends of €0.28 per share. Our valuation was based on a Free Cash Flow to Firm valuation model and was supported by a relative valuation throughout comparable companies and precedent transactions.
Navigator`s price target is greatly influenced by the expected stabilization of Pulp and Paper prices in the future, supported by Asian demand. The diversification and cost efficiency strategy align with focus on innovation, will allow the company to mitigate future threats related with environmental regulation and industry transformation.
Navigator`s sources of upside potential rely mainly on taking advantage of its vertical integration on the production process by providing high quality products more efficiently than its competition. Navigator is currently focused on the modernization of its production process and factories in order to become more efficient. The increase on the production capacity align with the diversification strategy will allow the company to become less depend on UWF sector and invest into other profitable segments, levered by the expected synergies of the existing business. This mind-set will permit the company to be ahead of its competitors and be well positioned for the upcoming industry challenges.
Pulp and paper prices are highly influenced by demand from emerging markets,
being Chinese economy the main pulp and paper consumption driver. China is expected to have a positive outlook in the medium / long term that would sustain the Pulp and Paper prices.
Pulp & Paper industry is facing a full transformation. New market and consumer needs, higher competition, and increase on regulatory policies, will impact the industry in the nearly future. Even so, the industry has continued to grow and has been consolidating, demonstrating a high degree of resilience. Portuguese government and regulatory entities have been imposed several
restrictions regarding eucalyptus plantations. If these restrictions escalate, it
could impact the company operational efficiency, resulting in higher costs with raw material importations. Even so, expected increases on supply from Asia and Latin America, would maintain wood prices at low levels. The Mozambique investment is a consequence of tighter regulation in Portugal, and can be a source of upside potential for Navigator.
More regulation can
negatively impact the industry Sources of upside potential:
—
High efficiency—
Diversification strategy—
Emerging markets—
Industry Consolidation—
ModernizationPulp & Paper prices are expected to remain stable in the future
Target price: €5.56 Upside potential: 18%
Navigator is one of the most efficient players in the market
Digitalization is the main driver for the industry transformation
“THE NAVIGATOR COMPANY S.A.” COMPANY REPORT
Company overview
The Navigator Company S.A. (former known as Portucel), is a Portuguese vertically integrated pulp and paper manufacturing company. The company carry out the production and sale of uncoated wood-free paper (UWF) and bleached eucalyptus kraft pulp (BEKP) as well as Tissue, Energy and Forest products. Currently being the Europe market leader in the UWF sector, the company is predominantly owned by Semapa (69.4%) and is listed on the Euronext Lisbon and is integrated on the Portuguese main stock index, PSI 20.
Company description
Navigator inception backs in 1953, with the beginning of its activity by the name of Companhia Portuguesa de Celulose in Cácia, led by Manuel Santos
Mendonça. Lately in the beginning of the XXI century, there was occurred a remarkable consolidation process with the acquisition of Inapa and Soporcel, giving origin to The Navigator Company (known as Portucel). In the meanwhile the company had been state owned (1976 to 1995), being the majority of the company capital acquired by Semapa during 2004.
Currently Navigator is positioned as the European leader on the production and sale of uncoated wood-free paper (UWF) and is among the top 10 producers worldwide. In Portugal the company has a considerable weight on the economy, being responsible for 3% of the country`s exportations and 1% of Portuguese GDP. Moreover, the company relevance on the country goes beyond the paper industry, as it is responsible for 5% of the country`s total energy produced and 50% of the energy generated through biomass.
The company position its products in a premium category, by selling high quality products worldwide. Around 95% of Navigator`s turnover relies to foreign countries – Europe (60%), Middle East (11%), U.S. (10%) and Africa (10%). The Navigator Company is responsible to manage four manufacture plants in Cácia, Figueira da Foz, Setúbal (headquarter) and Vila Velha de Rodão which allows the company to have a production capacity of 1.6 million tons of paper, 1.5 million tons of pulp, 0.6 million tons of Tissue and approximately 2.5 TWh energy generation capacity. A considerable part of pulp and energy produced by the company is integrated in the paper manufacturing process, positioning the company as a fully value chain integrated company that allow Navigator to be one of the most efficient players on the market. Additionally the company is also responsible for the sustainable management of 118 thousand ha of Portuguese eucalyptus forest that uses to supply part of its raw material needs (c.20%).
3.145 3.145 3.145 3.226 3.226 3.785 92% 94% 95% 94% 96% 87% 82% 84% 86% 88% 90% 92% 94% 96% 98% -500 1.000 1.500 2.000 2.500 3.000 3.500 4.000 2012 2013 2014 2015 2016 2017 Intalled capacity Utilizartion ratio
1.588 1.534
56 121 1.600 1.550
135
500
Paper Pulp Tissue Pellets
k
to
n
s
Production vs. Installed capacity
Production Installed acapcity
25% 21%
19% 17%
16% 15% 14%
Figure 1. Installed capacity (ktons)
Figure 2. Installed capacity per segment (ktons)
Source: Company data.
Figure 3. Revenues per business segment (`000)
Figure 4. Revenues by geography (`000)
Figure 5. EBITDA margin 2017
Source: Company data and Thomson Reuters. Source: Company data.
Source: Company data. Source: Company data.
“THE NAVIGATOR COMPANY S.A.” COMPANY REPORT
Since FY15, the company has been investing on its production capacity of existing products, as well as in new profitable markets such as Tissue and Pellets business segments, in order to diversify its portfolio. These investments forced the company to lever its capital structure, achieving a D/E ratio of 69% that is above the average industry (46%). Consequently, Navigator`s Net debt to Ebitda ratio also increased from 1.1x (FY14) to 1.9x (FY17).
SWOT analysis
Navigator`s main source of strengths and weakness, as well as the opportunities and threats that the company will face in the future are summarized below:
Strengths Weaknesses
Market leader postion Raw material scarcity and price volatility Operational eficiency (vertical integration) Dependency on UWF paper segment Manufactoring capabilities High labor costs
Focus on Research & Devolpment Dependency on European markets
Opportunities Threats
Explore other profitable business segments Industry capacity increases Explore other profitable geographies Protective trading policies Positive positionning for industry transformation Enviromental regulation Mozambique Project Currency risks
Shareholder structure
The major shareholder of Navigator is Semapa – Sociedade de Investimento e Gestão, SGPS, S.A. with 70% of the company shares. The other shareholders are BPI Pension Fund (4%), Zoom Investment (2%) and Norges Bank (2%) and the remaining capital (22%) is traded on the Euronext Lisbon. Moreover, disregarding Semapa, Portugal (38%), U.S. (23%) Norway (14%), UK (8%) and Germany (7%) are the main origins of Navigator`s capital.
The dominant position of Semapa in the Navigator`s capital should be further analysed since it can influence the company management decisions and capital distributions. One of the facts that should be taken into considerations relies on the high leveraged ratio of Semapa. Despite the debt reduction of c. €106 million during FY17, the company ended up the year with a Net Debt to EBITDA ratio of 3.3x. This scenario does not get better if we analysed the sources of revenues vs. debt. Semapa main sources of revenues come from Navigator (76%), Cecil (23%) and ETSA (1.3%), however in terms of Net Debt the scenario is different. Navigator accounts for 41% of Semapa`s net debt, while Secil accounts for 25% and the Holding itself for 33%. For Secil, this numbers represent a Net Debt to EBITDA ratio of 4.7x, worsening if we consider the exposure of the cement business to under developed countries. This could be a risk of contaminating Navigator, since Semapa can use the company strong cash flow generation capacity to reduce the Group`s debt, through dividend distribution, instead of
439 383 351 727 708 777 1,1x 1,1x 1,1x 1,9x 1,8x 1,9x 0,0x 0,2x 0,4x 0,6x 0,8x 1,0x 1,2x 1,4x 1,6x 1,8x 2,0x -100 200 300 400 500 600 700 800 900 1.000 2012 2013 2014 2015 2016 2017 U n it s
Net Debt Net debt to EBITDA
7,3% 3,8% 3,1% 2,9% 2,9% 2,7% 2,6% 2,4% 70% 22% 4% 2% 2%
Semapa Fleet float BPI Norges Bank Zoo Investment
1.453 1.285 1.111 1.803 1.780 1.674 2,9x 3,1x 2,7x 3,8x 3,6x 3,3x 0,0x 0,5x 1,0x 1,5x 2,0x 2,5x 3,0x 3,5x 4,0x -500 1.000 1.500 2.000 2.500 2012 2013 2014 2015 2016 2017 Debt Debt to ebitda
Figure 6. Net Debt (€`000)
Figure 7. Navigator shareholder structure 2016
Figure 8. Semapa`s Debt (€`000)
Figure 10. Dividend Yield 2017
Source: Company data.
Source: Company data and Thomson Reuters. Source: Company data.
Source: Company data and analyst estimates. Source: Company data.
“THE NAVIGATOR COMPANY S.A.” COMPANY REPORT
invest in the future performance of Navigator itself. Comparing with the industry, Navigator`s dividend yield is quite above its peers, suggesting that the company may be pressured to maintain a high yield in the future.
The Sector
Macroeconomic overview
According to IMF, the world economy have registered a growth of 3.7% (FY16: 3.2%), representing one of the highest values since FY10.
In Europe, the economy has grown by 2.4%, representing a notable increase when compared with FY16 (1.8%). The positive economic activity of Euro zone is a consequence of the development measures adopted, namely on the
improvement of financial conditions and the on recovery of the labour market. The lower prices of Brent also had a positive impact on the European economy. The Portuguese economy followed the same pace. Since FY14, Portugal has been recovering from debt crisis at a solid pace, posting a GDP real growth rate of 2.7% in FY17. In the next 3 years, it is expected a slight growth deceleration, stabilizing between 1.4% and 1.6% from FY20 onwards. The evolution of the real economy has been key to unemployment reduction, which is expected to reduce further until c. 6% in FY21. Inflation rate is expected to stand at 0.8% in FY18, increasing towards 2% until FY21. Regarding interest rates, 3-month Euribor shall keep negative until FY19, increasing afterwards up to 0.8% in FY22. Regarding the North American economy, it was registered an increase of 2.3% (FY16: 1.5%) with very low levels of unemployment. Moreover, it was been approved a new fiscal plan that would enhanced the development of the North American companies as well as the internal consumption.
China registered a notable GDP growth of 6.9% (FY16: 6.7%) and is expected to remain stable during the following years, stabilizing on 5.5% on 2023. The inflation would be around 2.8% for the projection period with low levels of unemployment (c.4%).
Pulp and Paper
Pulp (BEKP) and Paper (UWF) industry remain the principal source of revenues of Navigator, accounting for c. 10% and 74%, respectively, of the total turnover. The pulp and paper industry is facing a full transformation. New market and consumer needs, higher competition, and increase on regulatory policies, will significantly impact the industry in the nearly future. Digitalization is the main driver for the industry transformation, and is originating smarter and more
0,221 0,280 0,281 0,614 0,237 0,348 0,279 2012 2013 2014 2015 2016 2017 2018 44.389 44.231 42.785 41.413 40.778 40.805 41.693 2010H 2011H 2012H 2013H 2014H 2015H 2016H
Figure 9. Dividend per share (€)
Figure 11. Worldwide macroeconomic data
Figure 12. Europe macroeconomic data
Figure 13. Portugal macroeconomic data
Figure 14. China macroeconomic data
Figure 15. European Pulp capacity (ktons) Source: CEPI. Source: IMF. Source: IMF. Source: IMF. Source: IMF.
“THE NAVIGATOR COMPANY S.A.” COMPANY REPORT
integrated factories within the production process. Nowadays, modern mills have smart equipment that interact in real time with an integrated environment in order to increase efficiency and meet customer needs faster.
However, digitalization represents a huge challenge to the pulp and paper industry and has been affecting consumption and prices in the last years, being traditional paper replaced by digital alternatives. In Europe the pulp and paper capacity accounted in FY16 to 41.7 million tons and 100.3 million tons,
respectively, as a result of a downward trend on both pulp and paper production capacity with CAGR of -1% and -0.8% respectively, since FY10.
The deterioration of the production capacity is also been reflected in lower levels of production for pulp and paper manufacturers. Since FY10 the pulp sector has been facing a decline of 4.1% (c. -1.6 million tons) that escalate to 6.8% (c. -2.7 million tons) if we compare to 2000. Nonetheless, it should be noted that FY16 seems to stand as a shift in this negative trend with an increase on production of 2.7%. The recent positive trend is corroborated in pulp price indexes, with deep price upswings during FY17 (BHKP USD: +51%; BHKP Eur: +33%), achieving to an average price for the year of €725 /ton (FY16: €625 /ton). FY18 is following the growth tendency with the major players of the sector, including Navigator, announcing new price increases. The current momentum lived in the pulp industry is mainly boosted by the recovery of the Asian market reflected in the increase of importations. Furthermore, for FY18/9 it is expectable a stabilization on pulp prices with slight corrections for lower prices, as a result of the
adjustments between demand and supply, as a result of the increases on the industry installed capacity, mainly from China (+1.2 Mton) and UAE (300 kton). In terms of geography, according to the latest data from CEPI (FY16), Asia leads the worldwide pulp consumption (178.8 million tons) with 34%, followed by North America and Europe. In terms of pulp production (179.4 million tons), North America (36%), Europe (25%) and Asia (22%) are the main producers, however, Latin America with 15% is gaining weight along the years. In order to fulfil the gap between pulp`s consumption and production in Europe, historically, both Latin and North America are the main pulp suppliers, representing together c.96% of Europe imports during FY16. On the other hand, c. 89% of total exportations went to Asia, representing an evident dependency of Europe from this geography In what concerns paper UWF market, we have been facing a decrease on the European installed capacity (c. 100.4 million tons) of c. 4.8% (c. -5.0 million tons) between FY10 and FY16. This negative trend is also followed by a decline on the paper production (c. 90.9 million tons) of 5.9% (c. -5.7 million tons). The higher variation on the production vs capacity represents a decrease on the paper operating rate of 1.2% reflecting a negative variation of paper demand. However,
105.414105.119 102.196 100.766 101.468 99.832 100.374 2010H 2011H 2012H 2013H 2014H 2015H 2016H 34% 27% 30% 6%3% Asia Europe North America Latin America Rest of the World
1.595 2.236 2.874 2.746 2.232 2.156 2.604 253 228 281 289 261 315 333 2010 2011 2012 2013 2014 2015 2016 Asia Others 4.879 4.999 5.029 4.983 5.373 5.657 5.762 2.317 2.214 2.040 1.971 1.569 1.415 1.348 217 261 128 145 182 355 302 2010 2011 2012 2013 2014 2015 2016 Latin America North America Others
-200 400 600 800 1.000 1.200
BHKPUSD INDEX FOEXBHKP Index
Figure 16. European Paper capacity (ktons)
Figure 17. BHKP Index (€)
Figure 18. World Pulp Consumption 2016
178.8 million
tons
Figure 19. European Pulp Exportations (ktons)
Figure 20. European Pulp Importations (ktons) Source: CEPI. Source: CEPI. Source: CEPI. Source: Bloomberg. Source: CEPI.
“THE NAVIGATOR COMPANY S.A.” COMPANY REPORT
as aforementioned on pulp performance, FY16 seems to invert the past years negative trend, suggesting a recovery on the paper industry. From FY15 to FY16 the installed capacity has increased by 0.5% while the consumption has been relatively stable with a slight decrease of 0.1%. According to Navigator, during FY17 the demand for UWF has increased by 0.1%, influenced by a positive performance from Asian markets, corroborating the inversion trend. In terms of price performance, the paper UWF main index (A4 B-COPY Index), has been reflecting a downward trend since FY13. However, during FY17 this index had a positive performance with an average price of €815 /ton, still, slightly below the FY16 average of €824 /ton. This trend should be maintained during FY18 with paper producers seeing its margins shrink due to raw material cost increases, namely on pulp and wood. Asia is leading by far the global paper production (c. €407.6 million tons) and consumption (c. €410.7 million tons) with 46% and 47% market share, respectively. Europe stands right after Asia, with 26% and 24% of worldwide production and consumption, followed by North America with 20% and 19%, respectively. Regarding international trading, the European major
importations come largely from North America (57%), followed by Asia (23%) and Latin America (12%). On the exportations side, European companies are very dependent on Asia (42%) namely on China, being the remaining weight split between North America (19%), Latin America (12%) and Others (26%). Furthermore, in Europe the industry is facing a considerable reduction of the number of companies during the last years (-52 since 2010) accounting to around 623 firms, suggesting an advanced stage of consolidation of the industry.
Moreover, we have also been facing a reduction on the number of pulp and paper mills in the last few years. It should be noted that the gap between pulp and paper prices was never lower than now, which represent a great pressure to non-integrated companies, giving room to a reduction on number of factories (meaning less installed capacity) and benefiting vertically integrated companies, such as Navigator.
For the Tissue sub-segment it was observed an increase on consumption,
mainly driven by Eastern Europe countries. Even so, the economic recovery, boosted by the Tourism sector, in Portugal and Spain also had a positive impact on Tissue demand. The low weight of Tissue products result on high
transportation costs by m3 and therefore it cannot be exported efficiently. This could be an issue for Navigator to fulfil high potential emerging markets, such as China and India and could lead to inorganic growth throughout acquisitions.
Wood
47% 24% 19% 7%3% Asia Europe North America Latin America Rest of the World5.117 5.475 5.472 5.289 5.174 4.980 4.983 2.064 1.954 1.983 2.083 1.943 2.069 2.251 1.884 1.796 1.899 1.879 1.765 1.794 1.568 2.789 2.738 3.249 3.098 3.064 3.063 3.060
2010 2011 2012 2013 2014 2015 2016
Asia North America Latin America Rest of th World
626 522 456 536 590 581 659 1.831 1.758 1.585 1.439 1.504 1.608 1.656 499 477 423 386 360 363 346 308 546 383 270 310 270 247 2010 2011 2012 2013 2014 2015 2016
Asia North America Latin America Others
833 821
791 777 761 763 750
174 172 171 164 158 155 153
2010H 2011H 2012H 2013H 2014H 2015H 2016H
Paper Mills Pulp Mills
700 720 740 760 780 800 820 840 860 880 900
Figure 21. A4 B-COPY Index (€)
Figure 22. World Paper consumption by region 2016
411 million
tons
Figure 23. European Paper exportations (ktons)
Figure 24. European Paper importations (ktons)
Figure 25. Nr. of Pulp and Paper mills
Figure 26. European Tissue consumption
Source: CEPI Source: CEPI Source: CEPI Source: CEPI Source: CEPI Source: Bloomberg.
“THE NAVIGATOR COMPANY S.A.” COMPANY REPORT 0 20 40 60 80 100 120 140 160 180 BHKP BSKP
Wood plays a core feature on the pulp and paper manufacturing process, being the main raw material and the principal source of cost for the industry. As a raw material, wood can be split between hardwood and softwood. Softwood is mainly produced in North America and Scandinavia from pines and firs. Softwood is perceived to have higher quality, mainly due to its softness and longer fibres and therefore is expensive than hardwood. Hardwood is the main material used by Navigator, to produce printing and writing fine paper and contrary to softwood, is mainly produced in the southern hemisphere, namely Latin America, Asia and Iberian Peninsula. Navigator main source of wood are eucalyptus allowing the company to provide distinguished products with high quality and uniqueness. In Europe, wood removals increased by 1.2% in FY16, achieving 392 million m3, and it is expectable to maintain the same trend, but at a slower pace (0.4%) during FY17. In terms of consumption it also registered a growth of 1.5%, from 401 million m3 to 407 million m3, mainly supported by countries such as Finland, Portugal, Romania, Poland and Turkey. In terms of international trade, Europe registered during FY16 an amount of roundwood imports of 55 million m3 demonstrating an increase of 2.3% from FY15. This growth was driven from increases of 3.5% on softwood (36.1 million m3), rather than hardwood that stayed flat regarding FY15 (18.7 million m3).
Regarding the consumption of wood fibre by the pulp and paper industry, it accounted for the highest level in five years, arising to 147 million m3 in FY16. This amount represents an increase of almost 2% from FY15, mainly motivated by countries like Finland, Austria, Norway, Poland and Spain. Moreover, it was also visible a shift from hardwood (-1.8%) to softwood (+1.4%) consumption, suggesting an increase on the demand for tissue and packaging instead of printing paper. Moreover, this trend results from a decrease on the softwood prices, that is gaining attractiveness against hardwood. If this trend stands in the future, hardwood paper producers could lose competitiveness in the market. In Portugal, the consumption was higher than the increase on the eucalypt area and therefore it is expectable an increase of wood prices. Prices will also be affected by forest fires occurred in Portugal that could lead to raw material shortage. Portuguese government and regulatory entities have been imposed several restrictions regarding eucalyptus plantations. Recently, following the forest fires occurred during the summer of FY17, it was approved in Portugal a new legislation that forbid the plantation of new areas of eucalyptus. The responsible entities argue that this measure will contribute for a better balance between different forest species and at the same time ensure biodiversity and the activity of all forest industries. On the other side, the government allowed the transference of eucalyptus plantations from the interior to the coast, where pulp
37% 36% 13% 9% 6% Spruce Pine Birch Eucalyptus Other 108.004 107.378 105.538 104.028 106.925 39.277 38.912 40.533 40.428 40.410 2012 2013 2014 2015 2016 Softwood Hardwood 300,0 350,0 400,0 450,0 500,0 550,0 2012 2013 2014 2015 2016 Europe North America
26% 23% 23% 11% 17% Eucalyptus Cork Oak Pine Holm Oak Other
Figure 27. European wood consumption by specie
147 million
tons
Figure 28. Industrial roundwood consumption
Figure 29. European wood consumption for Pulp&Paper industry
Figure 30. Hardwood (BHKP) vs. Softwood (BSKP) Indexes
Figure 31. Portuguese Forest by specie 2016
100%
Source: Instituto de Floresta Nacional. Source: Thomson Reuters. Source: CEPI.
Source: FAO (UNECE). Source: CEPI
“THE NAVIGATOR COMPANY S.A.” COMPANY REPORT 1.193 1.218 1.247 1.239 1.210 1.203 122 153 129 122 138 164 59 67 74 167 171 175 178 181 184 7 12 24 10 14 28 2012 2013 2014 2015 2016 2017 U n it s
Paper Pulp Tissue Energy Others
manufactures could take higher productivity ratios while exploring the wood. The company, in the voice of its CEO, has been showing its disappointment to the applicable legislation, arguing that it could compromise the company
competitiveness, due to lack of raw material that would lead to an increase on importations. Furthermore, it is also enhanced the weight of Navigator within the Portuguese economy and the negative impact of the new legislation that could lead to the outflow of currencies, to the destruction of direct employment and the abandon of interior areas. With these arguments, the company is committed to struggle against the new legislation imposed by the government. Regarding wood importations, the main supplier come from the neighbour, Spain, however the supply was not enough and the company had to import wood from Latin America, namely Brazil and Uruguay. Besides the expectable increase on the integrated paper production capacity, on these countries, that could compromise supply, there is a damaged risk associated with the maritime transport, since the origin to Navigator`s factories. For that matter, Navigator tries to mitigate this risk for Latin America suppliers’ trough an insurance contract covering any damage during the transport.
Financials
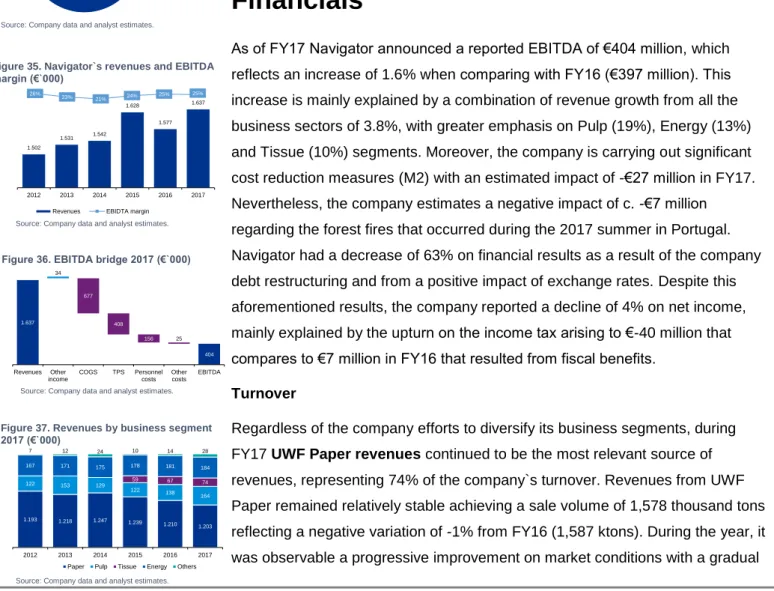
As of FY17 Navigator announced a reported EBITDA of €404 million, which reflects an increase of 1.6% when comparing with FY16 (€397 million). This increase is mainly explained by a combination of revenue growth from all the business sectors of 3.8%, with greater emphasis on Pulp (19%), Energy (13%) and Tissue (10%) segments. Moreover, the company is carrying out significant cost reduction measures (M2) with an estimated impact of -€27 million in FY17. Nevertheless, the company estimates a negative impact of c. -€7 million regarding the forest fires that occurred during the 2017 summer in Portugal. Navigator had a decrease of 63% on financial results as a result of the company debt restructuring and from a positive impact of exchange rates. Despite this aforementioned results, the company reported a decline of 4% on net income, mainly explained by the upturn on the income tax arising to €-40 million that compares to €7 million in FY16 that resulted from fiscal benefits.
Turnover
Regardless of the company efforts to diversify its business segments, during FY17 UWF Paper revenues continued to be the most relevant source of revenues, representing 74% of the company`s turnover. Revenues from UWF Paper remained relatively stable achieving a sale volume of 1,578 thousand tons reflecting a negative variation of -1% from FY16 (1,587 ktons). During the year, it was observable a progressive improvement on market conditions with a gradual
74% 26% Private Public 24% 76% Imported Produced 72% 14% 14% Portugal Spain Latin America 1.502 1.531 1.542 1.628 1.577 1.637 26% 23% 21% 24% 25% 25% (50%) (40%) (30%) (20%) (10%) 0% 10% 20% 30% 1.400 1.450 1.500 1.550 1.600 1.650 1.700 2012 2013 2014 2015 2016 2017 Revenues EBIDTA margin
1.637 1.670 993 585 429 404 404 34 677 408 156 25 Revenues Other income COGS TPS Personnel costs Other costs EBITDA
Figure 32. Portuguese wood consumption by source 2016
Figure 33. Portuguese Eucalyptus area 2016 8.5 million m3 812 million ha
Figure 34. Navigator`s wood importations 2016
100%
Figure 35. Navigator`s revenues and EBITDA margin (€`000)
Figure 36. EBITDA bridge 2017 (€`000)
Figure 37. Revenues by business segment 2017 (€`000)
Source: Company data and analyst estimates. Source: Company data and analyst estimates. Source: Company data and analyst estimates. Source: Company data and analyst estimates. Source: INE.
“THE NAVIGATOR COMPANY S.A.” COMPANY REPORT 500 540 500 484 473 527 7,9% (7,3%) (3,3%) (2,2%) 11,4% (0) (0) -0 0 0 440 460 480 500 520 540 560 2012 2013 2014 2015 2016 2017 Price (€ / ton) Growth %
increase of exportations by the company to Europe and overseas. The worldwide demand for UWF Paper have marginally increased by 0.2% during the year, mainly supported by China improvements. Europe faced a decrease of 0.7% on paper consumption. In terms of price, the UWF price index (PIX A4), had a favourable performance during FY17 achieving €815 /ton, however it remains below of 2016 prices (€824 /ton). In line with the market, Navigator had several price improvements during the year, but still, UWF prices stayed similar to FY16 due to exchange devaluation from both dollar and liber against euro, as well as a poor market mix performance.
Regarding Navigator`s BEKP Pulp sales it was a positive year for the company, reaching €164 million in sales, an increase of 19% when compared with the previous year. The company took advantage of the good performance of the market in terms of demand and price increases, both in Europe and China. On one hand, the company registered an increase of 7% in sold tons, on the other hand the pulp price increased by 11.4%. The price growth reflected a rise on the pulp main index – PIX BHKP – of 15% from €628 /ton to €725 /ton.
Tissue segment has been one of the major commitments of the company in
order to diversify its business portfolio, since UWF paper market has been deteriorating over time. In this regard, the revenue amount from this source increased by 10% when compared with FY16, characterized by an expansion on the production capacity and an improvement on the product mix, by selling more finished products rather than reels. Furthermore, the company was also been able to benefit from the macroeconomic positive outlook, in Portugal and Spain, namely boosted by the tourism sector that allowed the company to increase its prices, partially offsetting the increase on production price as a result of the previously mentioned price escalations on Pulp.
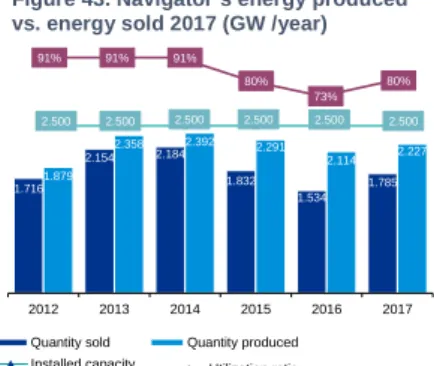
Navigator`s energy revenues represent c. 10% of the company total turnover. The company uses part of the energy produced on its production process of pulp and paper, only selling the surplus. Still, in Portugal the company is the largest biomass power producer with c. 50% of total biomass production in the country and has an energy generation capacity of 2.5 TWh, contributing for c.4% of the total energy produced in Portugal. The energy is produced mainly from four natural gas and biomass cogeneration stations and two biomass thermoelectric plants. During FY17 the company accounted for an increase of 13% on its energy sold, mainly due to non-recurrent events occurred during FY16 that negatively impacted the energy sales. Furthermore, part of this segment increase is a result of an increase on the efficiency of energy generation assets and the growth of Brent prices that influence directly the energy price. In terms of energy produced it should be noticed that FY17 was the first year of full operation from the
1.532 1.521 1.559 1.571 1.587 1.578 1.600 1.600 1.600 1.600 1.600 1.600 96% 95% 97% 98% 99% 99,3% -90% -70% -50% -30% -10% 10% 30% 50% 70% 90% 110% 1.480 1.500 1.520 1.540 1.560 1.580 1.600 1.620 2012 2013 2014 2015 2016 2017 Quantity sold Installed capacity % installed capacity
779 801 800 788 763 763 2,8% (0,1%) (1,4%) (3,3%) 0,0% -4% -3% -2% -1% 0% 1% 2% 3% 4% 740 750 760 770 780 790 800 810 2012 2013 2014 2015 2016 2017 Price (€ / ton) Growth %
243 284 257 253 291 311 1.500 1.500 1.500 1.500 1.500 1.550 18% 20% 18% 18% 20% 20% -90% -70% -50% -30% -10% 10% 30% -200 400 600 800 1.000 1.200 1.400 1.600 1.800 2012 2013 2014 2015 2016 2017 Quantity sold Installed capacity % installed capacity
39 51 55 126 126 135 31,3% 40,2% 41,0% (1) (1) (1) (0) (0) 0 0 1 -20 40 60 80 100 120 140 160 2012 2013 2014 2015 2016 2017 Quantity sold Installed capacity % installed capacity 1.496 1.330 1.343 -200 400 600 800 1.000 1.200 1.400 1.600 Price (€ / ton)
Figure 38. Navigator`s Paper Installed capacity and quantity sold 2017 (ktons)
Figure 39. Navigator`s Paper historic price and growth 2017 (€)
Figure 40. Navigator`s Pulp Installed capacity and quantity sold 2017 (ktons)
Figure 41. Navigator`s Pulp historic price and growth 2017 (€)
Figure 42. Navigator`s Tissue historic installed capacity, quantity sold and price 2017 (ktons)
“THE NAVIGATOR COMPANY S.A.” COMPANY REPORT 2,4% 1,7% 4,4% 6,9% 2,9% 0,9% 1,0% 0,3% 0,3% 0,2% (0,2%) (0,3%) (0,4%) (0,2%) 0,0% 0,2% 0,4% 0,6% 0,8% 1,0% 1,2% 0,0% 1,0% 2,0% 3,0% 4,0% 5,0% 6,0% 7,0% 8,0% 2012 2013 2014 2015 2016 2017 Implicit interest rate Euribor 6m
photovoltaic central in Setúbal paper mill in self-consumption system. Moreover part of the energy sold is co-generated during the manufacturing process and therefore is reported on the pulp and paper segments. Due to the lack of historic information available, we have considered the FY16 weight on energy produced in paper and pulp factories for FY15.
FY17 was also characterized by the beginning of the Pellets business in the U.S.A. accounting for €15 million in sales with the sale of 121 thousand tons. However, it was not a good start for Navigator on this business, since several problems on the production and sale process had arisen alongside with the deterioration of the international pellets market, reflecting a negative impact of €16 million on the company EBITDA.
OPEX: As previously mentioned, Navigator has a very efficient cost structure,
positioning the company with a comfortable EBITDA margin of 24.7%. This margin was mainly achieved by continuous cost restructuring measures (M2 programme) held by the company that comprised c. 126 new internal actions during FY17. These measures had most of its impact on Navigator`s variable costs, namely on wood and chemical costs integrated on the production process of pulp and paper, and on energy and product packaging. Regarding fixed costs, in FY17 the company faced an increase on personnel costs mainly due to the increment of the number of employees related with the Tissue and Pellets businesses. It should be noticed that the company had incurred in non-recurrent costs and profits during FY17, such as (1) costs related with forest fires that have occurred in Portugal during the summer months arising to €7.0 million and (2) the indemnities received regarding the facility fires in Vila Velha de Ródão and Setúbal, impacting positively the EBITDA in €6.5 million.
Overall, for the period 2012 – 2017, Navigator`s EBITDA has been shown to be robust and relatively stable, ranging between [21.4% - 25.7%] by virtue of the company vertical integration and outstanding performance, and constant cost efficiency measures implemented by the management.
Financial costs: Concerning financial expenses, Navigator faced a rising trend
until FY15 with a decrease on FY16 and FY17. The company has been restructuring its debt, by contracting new financing lines and replacing the
existing ones. Despite the increase on the debt amount, this restructuring allowed the company to reduce its debt by c. €5 million during FY17. Furthermore, the devaluation of the dollar align with the company positive hedging activity provided a total decrease on financial costs of €13 million.
Net income: Despite the Group good operational efficiency and the cost
reduction on the financial expenses during FY17, Navigator`s net income
1.716 2.154 2.184 1.832 1.534 1.785 1.879 2.358 2.392 2.291 2.114 2.227 2.500 2.500 2.500 2.500 2.500 2.500 (1) 499 999 1.499 1.999 2.499 2.999 -500 1.000 1.500 2.000 2.500 3.000 2012 2013 2014 2015 2016 2017 Quantity sold Quantity produced
Installed capacity 91% 91% 91% 80% 73% 80% Utilization ratio 399 414 451 383 410 458 393 415 423 422 404 408 125 114 121 155 145 156 15 13 15 22 17 25 2012 2013 2014 2015 2016 2017 COGS TPS Personnel costs Other costs
385 350 328 390 397 404 26% 23% 21% 24% 25% 25% 0% 5% 10% 15% 20% 25% 30% -100 200 300 400 500 600 2012 2013 2014 2015 2016 2017 U n it s
EBIDTA EBIDTA margin
Figure 43. Navigator`s energy produced vs. energy sold 2017 (GW /year)
Figure 44. Operational expenditures (€000)
Figure 45. Navigator`s wood and energy costs (€000) 247 231 232 206 245 214 175 138 39% 36% 34% 29% 2014 2015 2016 2017 Wood Energy Revenues %
Figure 46. Navigator`s EBITDA (€000)
Figure 47. Navigator`s implicit interest rate vs Euribor rate
Source: Company data Thomson Reuters and analyst estimates.
Source: Company data and analyst estimates. Source: Company data and analyst estimates. Source: Company data and analyst estimates.
“THE NAVIGATOR COMPANY S.A.” COMPANY REPORT 211 210 181 196 218 208 (21,9%) (4,3%) (1,4%) (15,4%) 3,5% (16,0%) (23,0%) (3,0%) 17,0% 37,0% 57,0% 77,0% -50 100 150 200 250 300 2012 2013 2014 2015 2016 2017 Net income Implicit tax rate
206 219 212 256 225 283 14% 14% 14% 16% 14% 17% 2012 2013 2014 2015 2016 2017 Working Capital % revenues
suffered decrease of c. 4.2% comparing to FY16. This decline is explained by the increase on the income tax accounted by the company, arising to c. - €40 million in FY17 that compared to +€7 million in FY16 as a result of tax benefits. During the last few years, the company has been taking advantage from several tax benefits mainly due to the increase on the utilization of renewable energy on its production process. However this benefit should not hold in future as we already seen during FY17 with a considerable increase on the corporate income taxes.
Fixed assets & Capex: Navigator had several investments during the period
2013 – 2017 in order to renovate and expand its production capacity, namely on the pulp (BEKP) and paper (UWF) business, but also to enter in new business segments such as Tissue and Pellets sectors. Since FY13 the company had already made c. €513 million in CAPEX which can be highlighted the Pellet`s mill construction on the U.S. (c. €115 million), the acquisition and development of the AMS for the Tissue segment (c. € 80 million), renovation and expansion of Cácia mill (c. €86 million), the development of the Mozambique project (c. €52 million) and renovation and expansion of Figueira da Foz mill (c. €40 million).
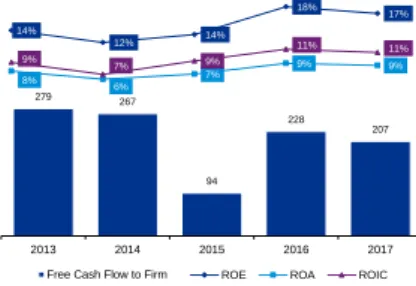
Furthermore, the invested capital was translated in higher returns, with the Return On Invested Capital ratio evolving positively since FY15.
Net Working Capital: For the period 2013 – 2017 the company working capital
has been relatively stable, evolving in line with the company business operations (CAGR 6.6%). During FY17, despite de decrease on c. €20 million on inventories as a result of the fire on the Rodão mill and the turbulent beginning at the Pellets business in the U.S., Navigator showed an increase in working capital. The WC growth was mainly motivated by the increase of receivables related with the anti-dumping tax imposed by the U.S. Government to Navigator imports, that the company does not agree. Furthermore, the reduction of state and other public entities of €43 million also contributed to the WC increase.
Net Debt: The group made a successful debt restructure during the last few
years allowing Navigator to reduce its cost of debt, delay its debt maturity and diversify its counterparties. Since 2015 the company has been increasing its net debt in order to meet its capital requirements from organic and inorganic growth. As of FY17 Navigator`s net debt accounts for €777 million, representing an increase of c. €69 million. This variation is mainly justified by the considerable amount of Capex incurred during FY17, as well as, the €250 million paid in dividendsto its shareholders. The ratio Net debt to EBITDA is 1.9x and Net debt to Equity is 66% as of FY17 and should be lowered in the future, based on the company`s peers levered ratios.
30% 26% 24%
60% 57% 66% 63%
Net Debt / Equity
439 383 351 727 708 777 1,1x 1,1x 1,1x 1,9x 1,8x 1,9x -2,0x -1,5x -1,0x -0,5x 0,0x 0,5x 1,0x 1,5x 2,0x -100 200 300 400 500 600 700 800 900 1.000 2012 2013 2014 2015 2016 2017
Net debt Net Debt/ EBITDA
87% 69% 60% 49% 46% 37% 15% 14% 46%
Figure 47. Navigator`s net income vs. effective tax rate (€000)
Figure 49. Navigator`s Working Capital (€000)
Figure 48. Navigator`s Capex and ROIC (€000) 19 46 194 140 115 1% 3% 13% 9% 7% 0% 2% 4% 6% 8% 10% 12% 14% 2013 2014 2015 2016 2017 Capex % revenues 9% 7% 9% 11% 11% ROIC
Figure 50. Navigator`s Net Debt (€000)
Figure 51. Industry`s D/E ratio 2017
Source: Company data, and analyst estimates.
Source: Company data, Thomson Reuters and analyst estimates.
Source: Company data and analyst estimates. Source: Company data and analyst estimates. Source: Company data and analyst estimates.
“THE NAVIGATOR COMPANY S.A.” COMPANY REPORT 1.588 1.600 1.600 1.600 1.600 1.600 1.600 1.600 99% 100% 100% 100% 100% 100% 100% 100% (90%) (70%) (50%) (30%) (10%) 10% 30% 50% 70% 90% 110% -500 1.000 1.500 2.000 2018 2019 2020 2021 2022 2023 2024 2025 Quantity sold Utilization ratio
4% 0% 0% 0% 0% 2% 2% 2% Price Growth % 318 318 318 318 318 318 318 318 1.570 1.570 1.570 1.570 1.570 1.570 1.570 1.570 20% 20% 20% 20% 20% 20% 20% 20% (90%) (70%) (50%) (30%) (10%) 10% -500 1.000 1.500 2.000 2018 2019 2020 2021 2022 2023 2024 2025 Quantity sold Installed capacity Utilization ratio 2%
(1%) (1%) (1%) 0%
2% 2% 2%
Price Growth %
To sum up, the company has been performing well during the period under analysis with a strong performance and a solid balance sheet. Despite the increase on debt position, the company return ratios have been improved with the capex expansions. As of FY17 the company free cash flow ascended to c. €207 million.
Valuation
Discounted Cash Flow valuation approaches regards to the present value of
future cash flows that the company will generate in the future, discounted to a cost of capital that better reflects the non-diversifiable risk of the company. We belief that discounted cash flow method are the most reliable to estimate the company`s fair value.
Business Plan assumptions
Regarding Turnover, it was assumed a CAGR of 2.4% detailed as:
UWF Paper: sales are projected at a CAGR of 1.4% for the projected period,
assuming that the company will work in full capacity at FY19 (1.6 million tons). For FY18 it was considered an increase of 3.6% on prices, following an
announcement from the company regarding an increase on European prices for UWF within a range of 6%– 8%, in order to compensate the increases on wood and pulp, and to follow the A4 B-COPY Index trend. For the period 2019 – 2025 it was expected a stabilization of the market, by a reduction on European installed capacity from non-integrated companies, with the Asian market offsetting the decrease on European demand. The quantity sold was kept stable along the forecasted period, as well as prices, evolving at inflation since FY23.
BEKP Pulp: The company already announced new installed capacity for FY18,
namely on the Figueira da Foz factory arising to 1.6 million tons. Based on historical data, an assumption was been made regarding the amount of pulp sold to the market (rather than the one integrated in the production process),
amounting to 20% of total pulp production. Concerning pulp sales prices, FY17 were very positive year, with several price increases during the year. Since the supply is expected to remain stable, there is a positive outlook for the prices to remain stable with slight corrections for lower prices, in the projection period.
Tissue: The Tissue segment is one of the most recent bets from Navigator in
order to diversify its business portfolio. The segment started in FY15 with the investment on AMS and since then the revenues increased 26% between FY15 and FY17. Currently the company is selling both finished goods and reels but it is expectable an improvement on the product mix, by selling more finished goods
358 315 200 207 207 44 115 7 Cash from
operations NWC Capex Change in otherAssets Free Cash Flowto Firm
14% 12% 14% 18% 17% 8% 6% 7% 9% 9% 9% 7% 9% 11% 11%
ROE ROA ROIC
279 267
94 228
207
2013 2014 2015 2016 2017
Free Cash Flow to Firm
Figure 55. Navigator`s BEKP Pulp projections (ktons)
Figure 52. Navigator`s Free Cash Flow to Firm bridge 2017 (€000)
Figure 53. Navigator`s historic Free Cash Flow to Firm and return ratios 2017 (€000)
Figure 54. Navigator`s UWF Paper projections (ktons)
Source: Company data, and analyst estimates.
Source: Company data, and analyst estimates.
Source: Company data, and analyst estimates.
“THE NAVIGATOR COMPANY S.A.” COMPANY REPORT 1.255 1.264 1.264 1.264 1.264 1.290 1.316 1.343 17187 170110 169217 168222 168227 172232 175237 179241 171 175 178 181 184 188 192 196 12 12 12 12 12 12 12 12 1.695 1.731 1.840 1.848 1.856 1.894 1.932 1.972 2018 2019 2020 2021 2022 2023 2024 2025 Paper Pulp Tissue Energy Others
38% 40% 41% 42% 43% 44% 45% 46% 22% 22% 23% 23% 23% 24% 24% 25% 12% 12% 13% 13% 13% 13% 13% 13% 11% 11% 12% 12% 12% 12% 13% 13% 24% 24% 26% 26% 26% 26% 27% 27% 2018 2019 2020 2021 2022 2023 2024 2025 Wood / Biomass Chemicals Packing Storage Materials Other
42% 43% 42% 42% 42% 42% 42% 43%
Gross margin
with the announced developments on Tissue factories. In terms of production capacity the company has already capacity to produce c. 106 thousand tons and it was already announced an increase of 9 thousand tons on AMS + 70 thousand tons on Cácia mill. These improvements are expected to occur during FY18, 9 thousand tons in the beginning and 70 thousand tons during the second semester. The tissue mills are expected to be fully operating during FY20. Concerning tissue prices, the recovery on demand settled by the Portuguese (and Spanish) economic recovery allowed the company to increase its prices during FY17. However, the prices are evolving at inflation during the projected period, since we are not expecting further price increases.
Energy: The energy produced allow the company to fulfil the pulp and paper
manufacturing process and sell the surplus to the market. It was made an assumption, considering that the company level of energy produced will change in the same percentage of production increases on paper, due to cogeneration in the pulp and paper production process. Considering this assumption, we have included in the energy segment the sales of energy produced from biomass thermoelectric pants and from pulp and paper segments. Taking this into consideration, the sales of energy amounted to 167 million Euros in FY17 (1.8 GWh) with a production capacity of 2.5 million GWh. Moreover, energy sales were projected to stay relatively stable with a CAGR of 2% from FY18 to FY25. The level of energy sold per energy produced was remain stable along the projection period (80%), based on historic periods adjusted from non-recurrent events. Non-recurrent events relates to the (i) photovoltaic plant from Setubal mill, operating in auto consumption during FY17 and should continue in the future; (ii) the natural gas cogeneration from Figueira da Foz plant also started to work in auto consumption mode and (iii) the maintenance and repair occurred during FY16 and FY17 on Navigator`s energy plants. All in all, it is expected that energy sales accounts for c. 10% of Navigator`s total sales during the projection period.
COGS are mainly comprised by wood (31%), chemicals (22%), packing (11%)
and storage materials (11%). The COGS for the projection period have increased by a CAGR of 3.2%, manly motivated by the increase on costs with the main raw material (wood). Regarding wood cost projections, it was considered that the internal wood supply (it is not accounted on COGS) will remain stable on 20%, according to new legislation from the Portuguese government that does not allowed new eucalyptus areas in Portugal. Therefore it was been split the wood cost between Portuguese supply and external supply (Spain + Latin America). Concerning PT supplies, according to historical data, it was considered a total eucalypt forest of 811 thousand ha, of which Navigator`s market share is c.50%
63 79 153 154 155 155 155 155 144 214 214 214 214 214 214 214 44% 37% 72% 72% 72% 72% 72% 72% (90%) (70%) (50%) (30%) (10%) 10% 30% 50% 70% 90% -50 100 150 200 250 300 350 2018 2019 2020 2021 2022 2023 2024 2025 Quantity sold Installed capacity Utilization ratio 2% 2% 2% 2% 2% 2% 2% 2% 0% 1% 1% 2% 2% 3% Price Growth % 1.796 1.810 1.810 1.810 1.810 1.810 1.810 1.810 2.241 2.258 2.258 2.258 2.258 2.258 2.258 2.258 2.500 2.500 2.500 2.500 2.500 2.500 2.500 2.500 -500 1.000 1.500 2.000 2.500 -500 1.000 1.500 2.000 2.500 3.000 2018 2019 2020 2021 2022 2023 2024 2025 Quantity sold Quantity produced Installed capacity
80% 80% 80% 80% 80% 80% 80% 80%
Utilization ratio
Figure 59. Cost of Goods Sold projections Figure 58. Navigator`s Turnover projections (€000)
Figure 56. Navigator`s Tissue projections (ktons)
Figure 57. Navigator`s Energy projections (GW/year)
Source: Company data, and analyst estimates. Source: Company data, and analyst estimates. Source: Company data, and analyst estimates.
“THE NAVIGATOR COMPANY S.A.” COMPANY REPORT 40 50 55 55 56 57 58 60 61 60 61 63 65 66 68 70 72 74 76 90 92 95 98 100 103 106 109 2017 2018 2019 2020 2021 2022 2023 2024 2025 Portugal Spain Latin America
(406 thousand ha). The company`s market share resulted from an assumption of a productivity index of 8 m3 / ha of forest, in line with market practices in
Portugal, and then converted into tonnes (0.9 m3 / ton). In this sense, in FY17 the company consumed 2,920 tons of wood from the Portuguese Forest. In terms of price, per ton it was considered 40 Eur / ton, in line with market practices. For the projections, the PT wood costs will increase by a CAGR of 5.2% mainly driven by (i) the increase on costs of wood, as a result of the forest fires in Portugal, that should arise to 50 eur /ton in FY18 and 55 eur /ton FY19 and should stabilize on 55 eur /ton in FY20, upgraded to inflation. According to Celpa (Associação da Indústria Papeleira) a productivity efficiency is expected to occur in Portugal from c. 8 m3 /ha to 10 m3/ha. We have considered as an upside to our valuation. Regarding wood importations it was considered two regions according to the current importation mix. On one hand, the company`s first wood supply option, rather than Portugal, is the neighbour Spain. However, Spain also has its eucalyptus supply restrictions and therefore it was considered a weight on imports of 14% (FY16 data), that should remain stable in the projection period. In terms of price, we assumed a premium of 20 eur /ton from Portuguese wood, amounting to 60 eur /ton and evolving at inflation. As a result, the costs with wood from Spain achieved 35.5 million Euros during FY17, with a CAGR of 3.0% until FY25. In what concerns extra-Iberia wood imports, it was considered the current sources of supply, namely Brazil and Uruguay with a CAGR of 6.2% during the projection period. Navigator only rely to this markets after fulfil the Portuguese and Spanish supply due to the increase on prices, namely on transportation and due to increase on damage` risks. Bearing this in mind, in FY17 according to company`s information, it was used these markets for 14% of wood consumption, resulting on 715 thousand tons, for a total cost of 54 million Euros, resulting on an implicit price of 76 eur /ton. For the projection period, it was considered a price of 90 eur/ton, upgraded at Latin American inflation rate and quantities resulting from the company needs, after fulfil the Iberian wood market. For the remaining COGS, it was assumed that they evolve in percentage of the Group turnover in the same weight of the previous two years.
Third party supplies: TPS estimated CAGR between 2018 and 2025 is 2.1%
and were split between variable and fixed costs. The increase was mainly driven by the growth on variable costs (2.2%), namely transport expenses. Transport costs were projected to be 8.3% of sales according to historic data, and should increase 0.5% during FY20, FY21 due to the increase on the transport of goods, as a result of the increase of wood importations from Latin America. Moreover, it was also purged the non-recurrent costs, such as the increase on specialized 57% 60% 61% 61% 60% 60% 60% 60% 60%
17% 15% 15% 15% 15% 15% 15% 15% 15% 26% 25% 24% 25% 25% 25% 25% 25% 25%
2017 2018 2019 2020 2021 2022 2023 2024 2025
Portugal Spain Latin America
8m3 / ha 10m3 / ha Actual Target 367 371 398 409 411 419 428 436 41 41 42 43 44 45 46 47 24% 24% 24% 24% 24% 24% 24% 24% 0% 5% 10% 15% 20% 25% -100 200 300 400 500 600 2018 2019 2020 2021 2022 2023 2024 2025 Variable Fixed Revenues %
Figure 63. Navigator`s Third Party Supplies projections (€000)
Figure 62. Navigator`s wood cost per ton Figure 61. Wood productivity efficiency ratio
Figure 60. Navigator`s wood importations projections
Source: Company data, EFIi-GTM and analyst estimates. Source: Company data, CELPA and analyst estimates.
Source: Company data, and analyst estimates. Source: Company data, and analyst estimates.
“THE NAVIGATOR COMPANY S.A.” COMPANY REPORT 157 162 166 168 171 175 178 182 3.164 3.214 3.214 3.214 3.214 3.214 3.214 3.214 2.500 2.600 2.700 2.800 2.900 3.000 3.100 3.200 100 120 140 160 180 200 2018 2019 2020 2021 2022 2023 2024 2025 Personnel costs Nr of employees
30 30 26
22 23 23 24 24
2018 2019 2020 2021 2022 2023 2024 2025
works during FY16 and FY17 related with the Pellets business. The fixed costs were forecasted to remain stable in line with historical data.
Personnel costs: were divided between statutory bodies, Employees, Social
expenses and other personnel costs. From FY18 and FY25 the costs with remunerations are expected to grow at a CAGR of 1.2%. Overall, the costs were estimated based on historic data, removing non recurrent costs associated with the U.S. factory, resulting on a decrease on the number of employees. However it was also been take into considerations, an increase on the number of
employees to respond to the capacity increase projected for the company, mainly on the Tissue sector. The net effect of these two events result on a decrease on the number of employees of -50, remaining stable in the projections
Other costs and losses: are mainly comprised by losses in inventories (7 million
Euros), Shipment costs and CO2 emissions related costs. These costs were projected as a percentage of the company turnover, based on historic data. However, it should be noted that FY17 had several non-recurrent costs related with a fire in Rodão factory and losses in inventories driven from the Pellets business that were not projected for the future.
Group share of (loss) / gains of associated includes the accounting gain of
15.8 million regarding the Pellets business sale during FY18.
Financial results: are forecasted based on the company’s debt amount.
Although, during FY17 the company had accounted significant decrease on financial interests as a result of different factors, it is expectable a 3.8% cost of debt for the company in the future.
Taxes: Even considering that historically, the company has been taking
advantage of tax benefits, (mainly related with renewable energies), this event should not be preserved in the future. Therefore, the Income tax was projected based on Navigator`s Nominal tax (CIT: 21%) and Municipal surtax (1.5%) plus a State surtax based on the company results (0% - 7%).
Capex and Depreciation: For 2018 the company is also committed to a
significant amount of CAPEX, namely the continuing expansion of Cácia (c. €90 million) and Figueira da Foz mill (c. €45 million). Navigator is currently focused on the modernization of its production process and paper mills in order to became more and more efficient. The company is also diversifying its business segments, in order to became less depend on the UWF sector and invest into other
profitable segments. This mind-set will allow the company to be ahead of its competitors and be well positioned for the upcoming industry challenges. Bearing this in mind, although the company does not have any capex commitments apart from the ones aforementioned, it was been considered a high level of capex for
30%
20% 18% 13%
19% Shipment costs Cost with CO2 emissions Other operating costs Losses on inventories Other 11% 10% 10% 12% 12% 12% 13% 13% ROIC 176 132 131 105 99 93 93 93 11% 8% 8% 6% 5% 5% 5% 5% 0% 2% 4% 6% 8% 10% 12% 2018 2019 2020 2021 2022 2023 2024 2025 Capex % revenues
Figure 67. Navigator`s Capex and ROIC projected (€000)
Figure 66. Navigator`s Financial costs projections
Figure 65. Navigator`s Other costs and losses breakdown 2016
Figure 64. Navigator`s Personnel costs projections (€000)
17 million
Euros
Source: Company data and analyst estimates. Source: Company data and analyst estimates.
Source: Company data and analyst estimates.
“THE NAVIGATOR COMPANY S.A.” COMPANY REPORT 302 314 316 262 298 341 349 356 18% 19% 19% 15% 18% 20% 21% 21% 2018 2019 2020 2021 2022 2023 2024 2025 Working Capital % revenues
87% 69% 60% 49% 46% 37% 15% 14% 46%
the projection period. The level of capex was computed based on the company depreciations, from 110% (FY19) to 100% (FY21), in order to support the business activity and maintain Navigator as one of the most modern playersin the industry.
Working capital projections were made based on historical data reported by the
company, namely based on (i) the days of receivables or payables for clients, other receivables and suppliers, (ii) Days inventory held for Inventories, (iii) historic percentage of capex for investment suppliers, net of non-recurrent events (Pellets business) and (iv) as a percentage of the company`s revenues for the remaining balance sheet items, including operational cash. As a result, the projected working capital reflects an annual investment of 2.1% in order to support the growth on business operations.
WACC and Terminal Value
The Discounted Cash Flow approach used to accesses the Navigator`s fair value implies the calculation of the Weighted Average Cost of Capital (WACC. It was computed a WACC of 6.8% being our estimates were based on:
Capital Structure
:
The target capital structure for Navigator has to be consistentwith the company`s long term strategy. Since there are no company specific guidance regarding the future capital structure, it was analysed the Navigator`s peers capital structure in order to define a long term target capitalization. Based on this approach, it was computed a D/E ratio of 46%.
Cost of equity represents the required return that an equity investor is willing to
receive in order to invest in a certain company. Since the cost of equity of a company cannot be observable in the market, it was applied the CAPM. a) Risk free rate is the expected rate of return for an equity investor for a
riskless asset. It was been used the Yield of a 30 year zero coupon German bond, that is the best proxy for a riskless security traded in Europe.
b) Levered Beta is the measure of covariance or systematic risk between the
company`s returns and the return of a certain market. Our approach was to extract the unlevered betas form Navigator`s peers from Thomson Reuters and then re-levered the median of peer`s betas according to Navigator`s target capital structure.
c) Market Risk Premium describes the return demanded by an investor above
the risk free rate for holding a market portfolio containing risk securities. Our approach was based on the market risk premium computed by Aswath
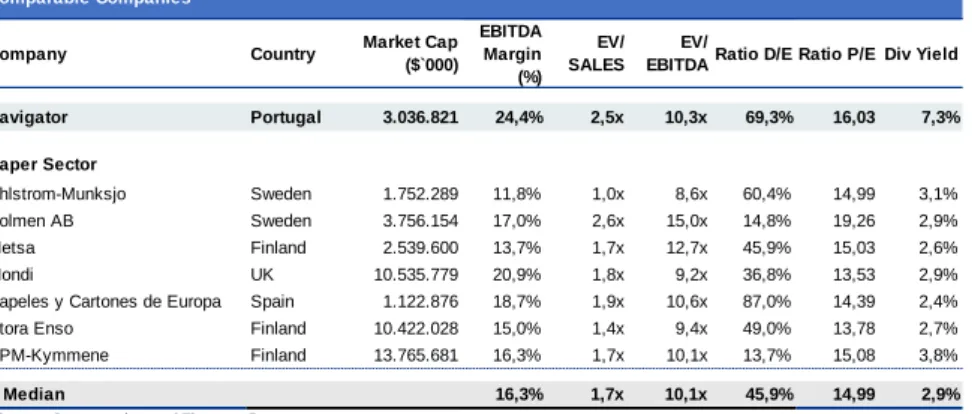
Comparable Companies
Company Country Unlevered
beta Navigator Portugal 0,60 Paper Sector Ahlstrom-Munksjo Sweden 0,39 Holmen AB Sweden 0,84 Metsa Finland 1,10 Mondi UK n.a
Papeles y Cartones de Europa Spain 0,45
Stora Enso Finland n.a
UPM-Kymmene Finland 1,48
Median 0,84
Pulp Sector
Altri SGPS SA Portugal 1,09
Ence Energia y Celulosa SA Spain 0,48
Rottneros AB Sweden 1,22
Statistics Pulp and Paper
Median 0,97
Figure 68. Navigator`s Working Capital projected (€000)
Figure 69. Navigator`s peers Capital Structure
Table 1. Navigator`s comparable companies for beta purposes
Source: Company data Thomson Reuters. Source: Company data Thomson Reuters. Source: Company data and analyst estimates.
“THE NAVIGATOR COMPANY S.A.” COMPANY REPORT
Damodaran published in January FY18 based on the average historical monthly risk premiums.
Cost of debt reflects the price paid by the company to issue debt at the optimal
cost structure. At the target capital structure, the cost of debt could be obtained through the yield to maturity on the company current outstanding debt, namely on the public traded debt, such as bonds. However, as stated before, we assumed that currently the company is not on its optimal cost structure and therefore the cost of debt should be obtained from Navigator`s peers. However there is no available information in the market and therefore it was considered the risk free plus the spread associated with companies, with Navigator`s credit rating. (Moody`s Ba2 spread).
Terminal Value: As previously mentioned, the DCF valuation method is based
on the future cash flows generated by the company, however given the technical impossibility of calculating the company`s cash flows indefinitely, it was
necessary to compute the terminal value to quantify the company`s cash flow after the projection period. It is expectable that terminal value represents a considerable amount of the company`s valuation on a DCF approach, and so it is crucial to ensure that the terminal year (final year of projection) represents a steady and mature state of the company`s performance. In our valuation the terminal growth was computed based on perpetuity growth method, assuming the last projected year as a perpetuity growing at a settled date. Regarding the terminal growth rate, we have assumed a growth of 2% considering that: (i) on one hand the UWF market is already in a high stage of consolidation and there are no growth expectations, and the impact of digitalization would reduce future prospects. On the other hand, the company has been demonstrating quite resilient and is committed to explore the market with greater efficiency and higher degree of innovation than its peers. Moreover, the diversification strategy and the company efforts to explore further opportunities in other profitable markets and segments, would bring a future growth perspectives. Consequently, it was projected a perpetuity growth rate of 2%, in line with the long term inflation expected for Europe.
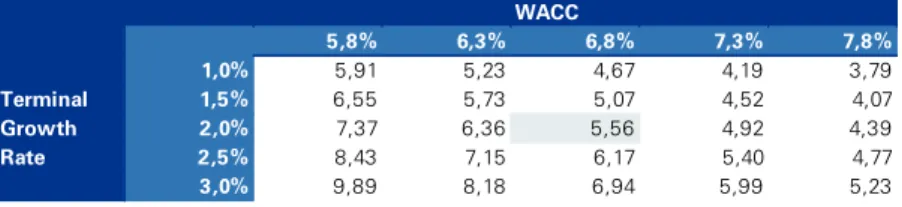
Regarding the high degree of volatility that can be assumed on the definition of WACC and growth rate on perpetuity (g) on the Enterprise Value, a sensitivity analyses was made:
WACC 5,5617446 5,8% 6,3% 6,8% 7,3% 7,8% 1,0% 5,91 5,23 4,67 4,19 3,79 Terminal 1,5% 6,55 5,73 5,07 4,52 4,07 Growth 2,0% 7,37 6,36 5,56 4,92 4,39 Rate 2,5% 8,43 7,15 6,17 5,40 4,77 3,0% 9,89 8,18 6,94 5,99 5,23 WACC Risk free 1,4% Gearing [D/(D+E)] 31,5% D/E 46%
Beta unlevered (ßu) 0,97 Beta levered (ßl) 1,41 Market Risk Premium 5,1% Tax rate 22,5%
Cost of equity 8,5%
Risk free 1,4%
Spread 2,4%
Custo da Dívida (Pre-tax) 3,8%
Cost of debt 2,9%
WACC 6,8%
Table 2. Navigator`s Weighted Average Cost of Capital
Table 3. WACC and Terminal Growth rate sensibility analysis
Source: Company data and analyst estimates. Source: Company data Thomson Reuters and analyst