UNIVERSIDADE DE LISBOA FACULDADE DE FARMÁCIA
DEPARTAMENTO DE FARMÁCIA GALÉNICA E TECNOLOGIA FARMACÊUTICA
Pharmaceutical topical dosage forms as carriers
for glucocorticoids
Sara Sofia Caliço Raposo
Doutoramento em Farmácia
(Tecnologia Farmacêutica)
UNIVERSIDADE DE LISBOA FACULDADE DE FARMÁCIA
DEPARTAMENTO DE FARMÁCIA GALÉNICA E TECNOLOGIA FARMACÊUTICA
Pharmaceutical topical dosage forms as carriers
for glucocorticoids
Sara Sofia Caliço Raposo
Tese Orientada por:
Professora Doutora Helena Margarida Ribeiro
Dra. Manuela Maria Urbano
Doutoramento em Farmácia
(Tecnologia Farmacêutica)
Aos meus pais e avós
Ao Ludo
Pelo amor e perseverança
intelectuais e pessoais que só foram possíveis de ultrapassar com a entreajuda de todos aqueles que contribuíram para este longo caminho.
À Professora Doutora Helena Margarida Ribeiro, quero exprimir os meus agradecimentos, pela orientação exemplar desta tese. Vejo na expressão de James Clerk Maxwell a melhor forma de expressar os meus agradecimentos: “As pessoas, de início, não seguem causas dignas. Seguem líderes dignos que promovem causas dignas”. O seu contributo para este longo caminho é incontestável. Quero destacar a sua visão crítica e motivada que sempre, objetiva e oportunamente, dedicou à prossecução e aperfeiçoamento constante da presente tese.
À Dra. Maria Manuela Urbano, minha co-orientadora científica, quero manifestar o meu agradecimento, realçando a excelência do seu desempenho, enquanto orientadora industrial desta tese. Agradeço o apoio e as circunstâncias que me proporcionaram realizar este trabalho, bem como as discussões científicas que me ajudaram a orientar esta tese para necessidades reais da indústria farmacêutica Portuguesa.
Ao Laboratório Edol, Produtos Farmacêuticos S.A., ao Senhor Engenheiro Carlos Setra, Dra. Marina Terceiro e à Fundação para a Ciência e tecnologia, agradeço as condições económicas que me proporcionaram realizar esta tese bem como todo o apoio dispensado.
Ao Professor António José Almeida, porque me quis honrar com o seu apoio, quero agradecer a sua visão critica e construtiva em momentos decisivos que me ajudaram a atingir os objetivos propostos. O meu reconhecimento para toda a vida.
À Professora Doutora Gillian Eccleston, expresso os meus agradecimentos pela disponibilidade, diligência e partilha de conhecimentos relativamente à análise estrutural dos sistemas emulsionados. As discussões científicas críticas contribuíram inquestionavelmente para o aperfeiçoamento da minha forma de trabalhar e pensar.
À Doutora Lídia Gonçalves, Doutora Sandra Simões e Doutor Pedro Pinto agradeço a colaboração pronta e rigorosa que me dispensaram na execução de alguns trabalhos laboratoriais, bem como o apoio e amizade demostrados.
Aos colaboradores do Laboratório Edol, Produtos Farmacêuticos S.A, Dra. Isabel Lemos, Rui Vilas Boas, Rita Carneiro, Daniel Arranca, André Loureiro, Gonçalo Pimpão, Diogo Manata e Carina Marques reconheço o papel importante na resolução de algumas questões científicas e práticas.
Ao Dr. Pequito Cravo agradeço o apoio prestado e discussões científicas relativas ao processo de patente.
À empresa DS Produtos Químicos Lda., ao Senhor Óscar Brás, pela disponibilização de várias matérias-primas e ajuda em algumas questões científicas.
Ao Departamento de Microbiologia da Faculdade de Farmácia, em especial à Professora Aida Duarte, Dra. Alexandra Silva e Paula Machado por me proporcionarem condições para o desenvolvimento das análises microbiológicas.
À D. Fernanda Carvalho, D. Henriqueta Pinto e D. Fernanda Oliveira, agradeço o bom acolhimento e disponibilidade continuada, que concederam às minhas múltiplas solicitações.
À Dra. Inês Casais pelo design gráfico da imagem referente à estrutura da emulsão.
Ao espírito de grupo, amizade e sentido de entreajuda de todos os colegas da Tecnologia Farmacêutica, e de um modo especial à Joana Marto, Gonçalo Oliveira, Rui Lopes, Giuliana Mancini e Andreia Ascenso pelo contínuo apoio que me ajudaram a ultrapassar as fases mais difíceis.
A toda a minha família, que me encorajaram na decisão de encetar, prosseguir e concluir este projeto. Um especial obrigado aos meus pais e ao Ludo pela compreensão, apoio e força incansáveis ao longo destes anos.
Resumo……….….… i Abstract……….. v Résumé……….….… vii List of Publications……… ix List of Abbreviations……….………... xi List of Figures……… xv
List of Tables………. xix
I. Outline 1. Introduction……….…. 3
2. Motivation……… 3
3. Aims of the research project……….…… 5
4. Structure of the thesis……….………... 6
II. Introduction 1. The epidermal barrier………...……… 9
2. Topic corticosteroids classification and relevance………..…. 12
3. Mechanism of action of topical glucocorticoids………...… 14
4. Topical delivery systems………..……….... 15
4.1. Conventional delivery systems for topical glucocorticoids delivery………. 16
4.1.1. Gels………...… 20
4.1.2. Emulsions and microemulsions………..………...… 22
4.1.2.1. Emulsions………..………. 22
4.1.2.2. Microemulsions………..…… 24
4.1.3. Foams as delivery systems for topical glucocorticoids……….…… 25
4.2. Nanoparticulate delivery systems………...… 26
4.2.1. Solid lipid nanoparticles and nanostructure lipid carriers for topical glucocorticoids deliver………..… 27
4.2.2. Polymeric nanoparticles intended for topical glucocorticoids delivery.... 33
4.2.3. Liposomes and other vesicles……….………...……… 34
5. Conclusion………..……….. 37
References………...………..…….. 39
III. Pharmaceutical development 1. Introduction………...………..…. 51
2. Materials and methods……….. 52
2.1. Materials………..………...… 52
2.2.2.2.1. Solubility studies……….………...… 54
2.2.2.2.2. Microscopy analysis………...… 54
2.2.2.2.3. Stability of mometasone furoate in the selected glycols…… 54
2.2.2.3. Data analysis………...………...…. 55
2.2.2.4. Selection of cetrimide concentration………..………..….. 55
2.2.3. Formulations development………...………... 55
2.2.3.1. Required HLB of oil mixture………..……… 55
2.2.3.2. Physical and chemical characterization of emulsions……….…….... 56
2.2.3.2.1. Appearance and chemical stability……….……... 56
2.2.3.2.2. Determination of the pH values………. 56
2.2.3.2.3. Assay of mometasone furoate……….... 56
2.2.3.2.4. Analytical centrifugation of emulsions………...………...… 56
2.2.4. Preparation of the final emulsions……….… 57
3. Components of the drug product………...…………... 58
3.1. Drug substance………..……….... 58
3.2. Excipients………... 59
4. Drug product………...………..… 61
4.1. Manufacturing process………...……….... 61
4.2. Pre-formulation studies………..… 64
4.2.1. Selection of cellulose polymers………..…….. 64
4.2.2. Selection of the glycols………...………..…… 65
4.2.2.1. Solubility studies………..…. 65
4.2.2.2. Microscopy analysis………...……….... 68
4.2.2.3. Stability of mometasone furoate in the selected glycols………. 68
4.3. Formulation development……….. 70
4.3.1. Required HLB of oil mixture……….. . 70
4.3.2. Development of the laboratory batches……….……….... 71
4.3.3. Selection of cetrimide concentration………….……….... 84
5. Discussion………..………...…… 86
6. Rational on pharmaceutical development………..………...… 87
References………... 89
IV. Structure analysis 1. Introduction………...… 95
2. Materials and methods………..… 96
2.1. Materials………..…………...… 96
2.2. Methods……….. 96
2.2.1. Preparation of the formulations……….….... 96
2.2.2. Influence of the inclusion of PVM/MA on the microstructure of HPMC gel……….………. 96
2.2.2.1. Viscoelastic measurements of gels………..……... 96
2.2.3. Droplet size analysis……….…...….. 97
3. Results………..………. 98
3.1. Influence of the inclusion of PVM/MA in the microstructure of HPMC gel….... 98
3.1.1. Viscoelastic measurements of gels……… 98
3.2. Droplet size analysis………...………… 99
3.3. Structure analysis of emulsions………..… 100
3.3.1. Flow curves……….... 100
3.3.2. Viscoelastic experiments………...… 102
3.3.3. Thermoanalytical measurements and hot stage microscopy………….… 104
3.3.4. Microscopy analysis………..……….…...… 106
4. Discussion………..………...… 108
5. Conclusions………...… 110
References……….………...… 111
V. In vitro and in vivo studies 1. Introduction………..……….……... 115
2. Materials and methods……….…… 116
2.1. Materials………... 116
2.2. Methods………...……….…… 116
2.2.1. Preparation of the formulations……….….…. 116
2.2.2. HPLC method for the determination of mometasone furoate……….…. 116
2.2.3. In vitro permeation of mometasone furoate from HPMC and HPC gels……… ……….… 117
2.2.4. In vitro release of mometasone furoate from A, B, C and D emulsions……….…… 117
2.2.5. In vitro permeation of mometasone furoate from A, B, C and D emulsions and commercial cream……….……….………….. 118
2.2.5.1. Comparison between the permeation profile of emulsion A and commercial cream………..…… 119
2.2.6. Skin permeation parameters……….…… 119
2.2.7. In vitro tape stripping of emulsion A………,..……… 120
2.2.8. In vivo anti-inflammatory activity studies………...……….…… 120
2.2.9. Mouse ear histology………..…….….. 121
2.2.10. In vitro cytotoxicity……….…. 121
2.2.11. Data analysis……….… 122
3. Results……….……….… 122
3.1. In vitro permeation of mometasone furoate from HPMC and HPC gels…...…... 122
3.2. In vitro release and permeation of mometasone furoate from the emulsions.….. 124
3.3. In vitro tape stripping of emulsion A………..……. 128
3.4. In vivo anti-inflammatory activity studies……….…... 128
3.5. Mouse ear histology………..……….…….. 129
3.6. In vitro cytotoxicity……….……. 130
4. Discussion………..….…... 131
2. Materials and methods………... 144
2.1. Materials………..………... 144
2.2. Methods………... 144
2.2.1. Production of three batches of emulsion A for stability assessment….… 144 2.2.2. Physical and chemical stability of emulsion A……….………….… 144
2.2.2.1. Microbiological stability of emulsion A………...………….. 145
2.2.2.2. Droplet size analysis……….………... 145
2.2.2.3. HPLC conditions for the assessment of mometasone furoate stability……… 145
2.2.3. Production of one batch of placebo A………... 145
2.2.4. Physical and microbiological stability of placebo A………..… 146
2.2.4.1. Droplet size analysis of the placebo A…….……….….. 146
2.2.4.2. Cetrimide assay……….………... 146
3. Results………..………..… 147
3.1. Physical, chemical and microbiological stability of emulsion A……….………... 147
3.2. Physical and microbiological stability of placebo A ………...……... 154
3.2.1. Cetrimide assay……….. 157
4. Discussion………..……….... 158
5. Conclusion………..……….……….. 159
References……….………..……. 160
VII. Safety assessment and biological effects of placebo A 1. Introduction………..…….………. 163
2. Materials and methods………... 164
2.1. Materials………..……… 164
2.2. Methods………... 164
2.2.1. Preparation of placebo A……… 164
2.2.2. Safety assessment of placebo A………...……….. 164
2.2.2.1. Hazard identification………...… 165
2.2.2.2. Exposure assessment……….………...… 165
2.2.2.3. Dose-response assessment………... 165
2.2.2.4. Risk characterization………... 166
2.2.3. EpiSkinTM assay……….…….…………..…. 166
2.2.4. Human repeat insult patch test………..…. 167
2.2.5. Biological effects of placebo A………..………….…………..…. 167
2.2.6. Data analysis……….………..… 168
3. Results and discussion……….….………..… 169
3.1. Safety assessment of placebo A………..… 169
3.1.1. Hazard identification………...…………..…. 169
3.1.2. Exposure assessment…………...………... 173
3.1.3. Dose-response assessment………..……….... 174
3.1.4. Risk characterization………..……….... 174
3.2. EpiSkinTM assay………..……….…... 175
VIII. Preliminary studies on the scale up of the placebo A
1. Introduction……….... 187
2. Materials and methods………... 187
2.1. Materials………...………... 187
2.2. Methods………..……. 188
2.2.1. Lab-scale………..………...… 188
2.2.2. Pilot lab-scale production………..…. 188
2.2.3. Pilot industrial-scale production………..………….………..… 188
2.2.4. In-process tests in pilot industrial-scale production ………..… 189
2.2.5. Droplet size analysis……….……. 189
2.2.6. Flow curves………..………..…… 189
2.2.7. Comparison between cold and hot process concerning production costs……….……...… 189
3. Results………..….. 190
3.1. In-process tests in pilot industrial-scale production……….... 190
3.2. Droplet size analysis………..………..… 190
3.3. Flow curves……….…… 191
3.4. Comparison between cold and hot process concerning production costs…...…… 192
4. Discussion……….…. 193
5. Conclusion………... 195
References……….…………..…. 196
IX. Highlights and main conclusions 1. Conclusions……….………...… 199 Annex I. Analytical validation report for the analysis of mometasone furoate in
farmacêuticos para a veiculação tópica de fármacos.
Para terem atividade terapêutica, os fármacos têm que penetrar na pele, o que consiste no transporte de uma substância para uma determinada camada da pele. A maior parte dos fármacos não consegue permear a pele, pelo que é necessário um veículo para os transportar ou para aumentar a libertação no local de ação.
Os glucocorticóides tópicos (GT) são os fármacos mais frequentemente prescritos por dermatologistas. A sua eficácia clínica no tratamento da psoríase e de dermatites está relacionada com os seus efeitos vasoconstrictores, anti-inflamatórios, imuno supressores e antiprofliferativos. As células alvo para os GT são principalmente os queratinócitos (maioritariamente localizados na epiderme) e os fibroblastos (maioritarimanete localizados na derme). Os efeitos adversos observados para os GT são devidos à ação destes nos fibroblastos. Assim, se a permeação for direcionada para as camadas mais superficiais da pele em detrimento das camadas mais profundas, os efeitos colaterais podem ser diminuídos. O furoato de mometasona é um corticóide sintético, lipofílico e classificado como “potente”. Estudos in vitro demostraram que o furoato de mometasona está entre os mais potentes GT na inibição da produçaõ de citoquinas, libertação de histamina e de eosinófilos. Por outro lado a biodisponibilidade deste farmaco é muito baixa havendo assim uma minimização dos efeitos adversos.
Ao longo dos últimos anos vários grupos científicos têm tentado optimizar a potência dos corticóides e minimizar os seus efeitos secundários. Várias tentativas têm sido feitas de forma a aumentar a segurança e eficácia dos GT, nomeadamente na aplicação de novos regimes de aplicação, o desenvolvimento de veículos baseados em nanotecnologias e na síntese de novos fármacos.
Nesta dissertação foram revistas e avaliadas as estratégias mais recentes para a veiculação de GT aumentando a sua permeação e acumulação. Os veículos mais recentes incluem, partículas lipídicas, lipossomas, transferosomas, partículas poliméricas entre outros. Estas formulações são relativamente recentes e a indústria farmacêutica ainda não possui as metodologias adequadas para a sua produção. Para além disto, diversos desafios como armazenamento, manipulação e fabrico emergem aquando da avaliação da estabilidade, compatibilidade e transposição de escala destas novas tecnologias.
ii
No nosso entender, um desenvolvimento farmacêutico racional, que integre formulações simples e facilmente traspostas de escala para a indústria farmacêutica, irá ajudar no desenvolvimento de veículos adequados.
As emulsões convencionais são preparadas aquecendo as fases aquosa e oleosa à mesma temperatura. Posteriormente estas fases são misturadas e homogeneizadas até atingirem a temperatura ambiente. Actualmente, os pocessos de fabrico têm ser optimizados e os custos reduzidos. O método a quente apresenta a desvantagem, quando comparado com o processo a frio, de apresentar mais custos. As vantagens da emulsificação a frio não estão limitadas à diminuição dos custos de produção, mas também são mais fáceis de processar, diminuindo o tempo de produção e consequentemente aumentando a capacidade de produção. Não é necessário tempo de aquecimento e consequentemente não é necessário o passo de arrefecimento pelo que a estrutura das emulsões é mais facilmente previsível. No entanto, as emulsões preparadas pelo processo a frio são mais difíceis de estabilizar e de obter cremes com uma cosmeticidade adequada, principalmente devido a limitação dos excipientes que podem ser usados (apenas excipientes líquidos ou solúveis numa das fases). Estes problemas aumentam quando fármacos como os GT são incorporados, maioritariamente devido a problemas de solubilidade. Os GT são insolúveis em água e apresentam uma baixa solubilidade nos solventes mais utilizados em preparações tópicas.
Este projeto teve como principais pressupostos o desenvolvimento e caracterização de emulsões para uso dermatológico, de valor acrescentado para a empresa financiadora. Os principais objetivos desta dissertação foram o desenvolvimento de formulações tópicas, contendo furoato de mometasona (0.1 % m/m) estáveis a pH ácido, contendo o menor número possível de excipientes e usando a menor energia possível durante o seu fabrico. Após desenvolvidas e caracterizadas, o objetivo foi estudar os perfis de libertação e permeação através de membranas sintéticas e pele humana, e realizar estudos in vivo da ação anti inflamatória comparando os resultados obtidos com a formulação de referência no mercado.
Seguidamente, a estabilidade física, química e microbiológica da formulação final, de acordo com as guidelines farmacêuticas, foi avaliada. Finalmente, os efeitos biológicos
Várias formulações foram desenvolvidas e analisadas, quatro emulsões foram seleccionadas por apresentarem uma estabilidade química e física adequada. Estas quatro emulsões diferiram no co tensioactivo (PEG-20 glyceryl laurate ou polyglyceryl-4-isostearate) utilizado e no glicol (2- methyl-2,-4 pentanediol ou etoxydiglycol). A utilização de métodos reológicos, calorimetria de varrimento diferencial, análise microscópica e determinação do tamanho da gotícula permitiram seleccionar as emulsões mais estruturadas, ou seja com uma estabilidade física mais promissora (emulsões contendo PEG-20 glyceryl laurate).
Estudos de libertação e permeação in vitro demostraram que o glicol utilizado tem pouca influencia na permeação do furoato de mometasona. Estes resultados estão de acordo com os resultados de solubilidade do fármaco em ambos os glicóis. Foi demostrado que o co - tensioactivo influenciou a permeação do furoato de mometasona, sendo a permeação mais elevada para o co - tensioactivo mais hidrófilico devido a uma menor afinidade do fármaco para este. Foi demostrado um aumento do coeficiente de permeabilidade entre 2.7 a 7.8 vezes, comparando o valor experimental com o valor teórico esperado para este fármaco. Este aumento foi atribuído aos excipientes presentes na emulsão que funcionaram como promotores cutâneos.
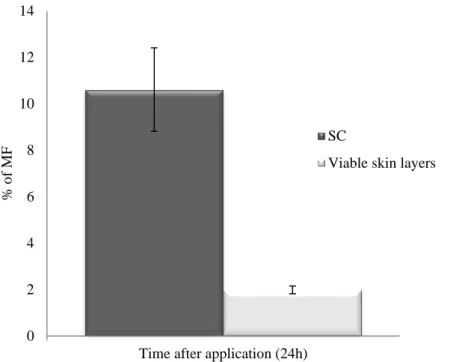
Os resultados obtidos no ensaio de tape stripping em pele humana, demostraram que a quantidade de furoato de mometasona que atingiu as camadas viáveis da pele é baixa (1.99 %), ficando parte do fármaco retido no estrato córneo (10.61 %). Apesar disto, os estudos in vivo demostraram que as formulações desenvolvidas diminuíram o edema e o eritema na orelha do rato em mais de 90 %. Adicionalmente, foi demostrado que a eficácia das formulações é semelhante à da formulação comercial relativamente aos estudos anti inflamatórios.
A formulação selecionada tendo em conta a análise estrutural e os ensaios in vitro e in vivo foi a emulsão contendo PEG-20 glyceryl laurate e 2- methyl-2,-4 pentanediol. Os estudos de estabilidade física, química e microbiológica demostraram que esta formulação é estável, pelo menos, durante 12 meses nas presentes condições experimentais.
Relativamente aos estudos dos efeitos biológicos (perda de água trans epidérmica, corneometria e sebometria) do placebo, foi possível observar que este contribuiu para
iv
Finalmente, os estudos preliminares de transposição de escala para o placebo, demostraram que o perfil reológico não sofreu alterações significativas e a distribuição do tamanho das gotículas foi monomodal, no placebo produzido na escala piloto industrial e, bimodal nas escalas laboratoriais, indicando um possível aumento da estabilidade física para o primeiro. Conclui-se que os riscos associados à transposição de escala não foram elevados podendo-se assim prosseguir para a validação do processo à escala industrial. Foi ainda observado que o processo a frio utilizado diminuiu os custos totais de produção em mais de 17 % quando comparado com um processo a quente.
De uma forma geral pode concluir-se que o desenvolvimento de uma emulsão produzida a frio foi conseguido com um perfil de estabilidade adequado à sua comercialização. Os resultados obtidos indicam que o ratio benefício risco poderá ser melhorado, e que a emulsão desenvolvida apresenta a mesma eficácia quando comparada com o produto de referência em termos de atividade anti inflamatória.
A produção industrial desta emulsão irá reduzir substancialmente os custos associados à produção.
Palavras-Chave: emulsificação a frio, furoato de mometasona, mico estrutura, custos de produção.
systems have emerged for topical glucocorticoids delivery. Despite being a mature class of drugs, they are still the most frequently prescribed drugs by dermatologists, explaining the interest on this field.
Over the years, research has focused on strategies to optimize the potency of steroids while minimizing adverse effects. Mometasone furoate (MF) is a synthetic, lipophilic, 16 alpha methyl analogue of beclomethasone, classified as class III (European Classification).
The development of simple formulations for MF delivery, easily scaled-up to industry, produced by methods that can allow the decrease of production costs, will be the rational beyond this project.
Emulsions suitable for cold process emulsification were developed and optimized. Four formulations were created differing on the co-emulsifier used (PEG-20 glyceryl laurate and polyglyceryl-4-isostearate) and the glycol (2-methyl-2,4-pentanediol and ethoxydiglycol). Formulation design coupled with structure analysis allowed the selection of the most stable emulsions, emulsions containing PEG-20 glyceryl laurate. In vitro permeation studies demonstrated that these emulsions, containing MF (0.1 % w/w), were responsible for a increased on the permeability coefficients of MF. The in vivo studies showed that, the topical application of the formulation would assure, at least, the same efficacy compared with the commercial cream.
Additionally, it was demonstrated that the selected emulsion (PEG-20 glyceryl laurate with 2-methyl-2,4-pentanediol) is physical, chemical and microbiological stable during 12 months.
In vitro and in vivo studies showed that the placebo (emulsion without MF) was not skin-irritant and it was demonstrated to contribute to restore the skin barrier by increasing the amount of lipids within the skin.
Finally, the cold process allowed a total production savings of more than 17% when compared to the traditional hot process and preliminary scale-up studies suggest that the risk associated to the scale-up is minor.
Keywords: cold process emulsion; mometasone furoate; microstructure; production costs.
vii biotechnologie, des nouveaux systèmes ont émergé pour l’administration de glucocorticoïdes topiques.
Bien qu’étant une classe de médicaments matures, ce sont toujours les médicaments les plus prescrits par les dermatologistes, ce qui explique l’intérêt porté à ce domaine. Pendant des années, les recherches se sont concentrées sur les stratégies visant à optimiser la puissance des stéroïdes en minimisant les effets indésirables. Le furoate de mometasone (FM) est un 16 alpha méthyle analogue du beclomethasone, synthétique et lipophile, classe class III (Classification européenne).
Le développement de formules simple pour l’administration du MF, facilement applicable à un accroissement d’échelle pour l’industrie et produit par des méthodes qui peuvent permettre la réduction des coûts de production, sera le rationnel au-delà de ce projet.
Des émulsions, adaptées aux émulsions à processus à froid, ont été développées et optimisées.
Quatre formulations ont été créées, se différenciant par le co-tensioactif utilisé (PEG-20 glyceryl laurate et polyglyceryl-4-isostearate) et le glycol (2-methyl-2,4-pentanediol et ethoxydiglycol).
La conception de la formulation associée à l’analyse de la structure, à permis la sélection des émulsions les plus stables, émulsions contenant du PEG-20 glyceryl laurate.
Des études in vitro de permeation ont montre que ces émulsions, contenant du FM (0,1% m/m), sont responsables d’une augmentation des coefficients de perméabilité du FM. Les études in vivo ont montré que l’application topique de la formulation assurerait, au minimum, la même efficacité par rapport à la crème commerciale.
De plus, il a été démontré que l’émulsion sélectionnée (PEG-20 glyceryl laurate avec du 2-methyl-2,4-pentanediol) est stable physiquement, chimiquement et microbiologiquement pendant 12 mois.
Les études in vitro et in vivo ont montré que le placebo (émulsion sans médicament), n’irritait pas la peau et contribue à restaurer l’épiderme, en augmentant la quantité de lipides dans la peau.
Mots clés: émulsion processus à froid ; furoate de mometasone, microstructure, coût production.
ix Portuguese Patent nº105982 M: submitted at 3rd November 2011 – Cold Process Emulsion as Vehicle for Anti-Inflammatory Drugs: Composition and Preparation Method. Helena Margarida Ribeiro and Sara Raposo; Faculty of Pharmacy University of Lisbon and Laboratório Edol Produtos Farmacêuticos S.A.
Papers
Carneiro R, Salgado A, Raposo S, Marto J, Simões S, Urbano M, Ribeiro MH, Topical emulsions containing ceramides: effects on the skin barrier function and anti-inflammatory properties, Eur J Lipid Sci Tech, (2011) 113(8):961-966.
Ribeiro H, Marto J, Raposo S, et al. From Coffee Industry Waste Materials to Skin-Friendly Products with improved skin fat levels, Eur J Lipid Sci Tech (2013) 115(3):330-336
Raposo S, Simões S, Almeida AJ, Ribeiro HM. Advanced systems for glucocorticoids dermal delivery, Expert Opin Drug Deliv. (2013). doi 10.1517/17425247.2013.778824.
Raposo S, Salgado AC, Eccleston G, Urbano M, Ribeiro HM. Cold Processed Oil-in-Water Emulsions for dermatological purpose: Formulation Design and Structure Analysis, J Pharm Dev Technol (2013). doi:10.3109/10837450.2013.788516
Raposo S, Tavares R, Gonçalves L, Simões S, Urbano M, Ribeiro HM. Mometasone-furoate – loaded cold processed oil-in-water emulsions for epidermal targeting: in vitro and in vivo studies. Submitted to Eur J Pharm Biopharm (2013).
Raposo S, Salgado A, Gonçalves L, Pinto CP, Urbano M, Ribeiro HM. Safety Assessment and Efficacy Aspects of a New Cold Processed SilEmulsion as a vehicle for glucocorticoids. Submitted to BioMed Research International (2013).
xi ANOVA - Analysis of variance
ATR - Attenuated total reflectance infrared BD - Betamethasone dipropionate
BMV - Betamethasone-17-valerate COX-2 - Cyclooxygenase-2
CP - Clobetasol-17-propionate DMSO - Dimethyl sulfoxide
DSC - Differential scanning calorimetry
EMEA - European Agency for the Evaluation of Medicinal Products f2 - similarity factor
FDA - Food and Drug Administration
FTIR - Fourier transform infrared spectroscopy G’ - Storage modulus
G´´ - Loss modulus
HA - Hydrocortisone acetate HC - Hydrocortisone
H&E - Hematoxylin and eosin
HLB - Hydrophilic lipophilic balance
HPA - Hypothalamic pituitary adrenal
HPLC - High-performance liquid chromatography HPMC - Hydroxypropylmethylcellulose
HRIPT - Human repeated insult patch test IC50 - Half maximal inhibitory concentration
IPM - Isopropyl myristate J - Flux
Kp - Permeability coefficient Log P - Partition coefficient MC - Methylcellulose ME - Microemulsions MF - Mometasone furoate
MIA - Market introduction authorization MoS - Margin of safety
MTT - 3-[4,5-dimethylthiazol-2-yl]-2, 5-diphenyltetrazolium bromide Na-DOC - Sodium-deoxycholate
NLC - Nanostructured lipid carriers NMR - Nuclear magnetic resonance
NOAEL - No observed (adverse) effect level PBS - Phosphate buffer saline
PC - Prednicarbate
PEG - Polyethylene glycol PGA- Poly glutamic acid PLA - Poly lactic acid
PLGA - Poly (lactide-co-glycolide) acid PLP - Prednisolone phosphate
PPG - Polypropylene glycol PS - Parelectric spectroscopy
xiii RH - Relative humidity
RP - Reversed phase RT - Room temperature SC - Stratum corneum
SDS - Sodium dodecyl sulfate SED - systemic exposure dose SLN - Solid lipid nanoparticles SLS - Sodium lauryl sulfate TCA - Triamcinolone acetonide
TEM - Transmission electron microscopy TEWL - Trans epidermal water loss TG - Topical glucocorticoids tanδ = G´´/G´ - Loss factor η’ - Dynamic viscosity γc – Critical strain
Fig. 2.1. SC model scheme (“brick-and-mortar”) with the lipidic intercellular matrix and the possible penetration pathways (intercellular: dashed arrow; transcellular: black arrow); annexial route is also represented. Substances permeate mainly along the tortuous pathway in the intercellular lamellar regions which are oriented parallel to the corneocyte surface. Hydrophobic permeants diffuse through the SC intercellular bilayers – lipid route; Polar route could be a domain for hydrophilic molecules to penetrate the SC………..…………... 10 Fig. 3.1. Chemical structure of MF... 58 Fig. 3.2. Flow chart of the preparation of the final emulsions………... 63 Fig. 3.3. Photomicrographs of HPC gel (a) and HPMC gel (b) after 15 days of
preparation (magnification of 400x)……… 65 Fig. 3.4. Co-solvent solubility plot of MF in pentanediol - water mixtures (a);
ethoxydiglycol - water mixtures (b) and pentanediol/caprylocaproyl - water mixtures (c) at 22ºC. Measurements were performed at least
in duplicate, (mean ± SD)……… 66
Fig. 3.5. MF in ethoxydiglycol (a); pentanediol (b) and pentanediol / caprylocaproyl (c), 5 days after preparation and stored at 22 ºC.
Magnification of 200x……….…. 68
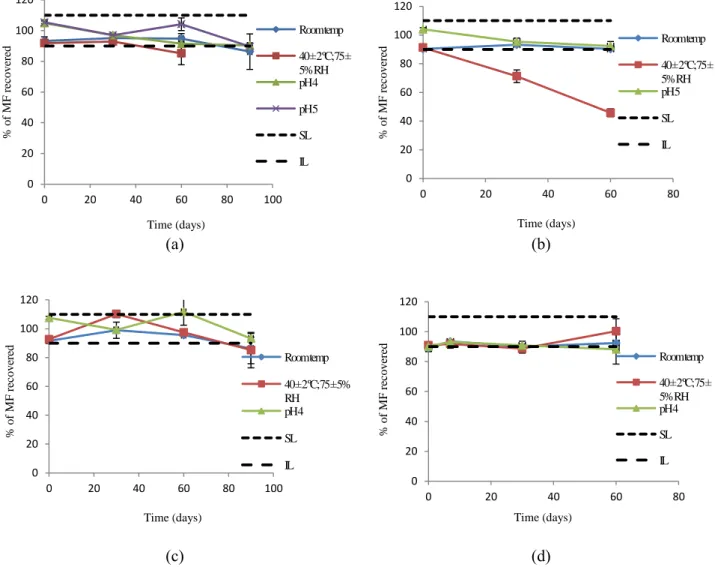
Fig. 3.6. Percentage of MF recovered as function of time in different conditions: RT, accelerated stability (40 ± 2 ºC; 75 ± 5 % relative humidity) and different pH values. The superior (SL) and inferior (IL) limits were established at 100 ± 10 %. Ethoxydiglycol (a), PEG 400 (b), pentanediol (c), pentanediol / caprylocaproyl (d), (n= 3;
mean ± SD)……….. 69
Fig.3.7. Transmission profiles of emulsion 9A (a); 9B (b) and 9C (c)………. 80 Fig. 3.8. Transmission profiles of emulsion 10A (a); 10B (b) and 10C (c)…... 80 Fig. 3.9. Transmission profiles of emulsion 11A (a) and 11B (b)……….……. 83 Fig. 3.10. Transmission profiles of emulsion 12A (a) and 12B (b)……….……. 83 Fig. 4.1. Influence of 0.3% (w/w) of PVM/MA on the storage modulus-G’ of
xvi
(b); n=2……….… 101
Fig. 4.4. Tan δ as function of frequency for A (■), B (□), C (▲) and D (◊), at
25 °C……….…… 103
Fig. 4.5. Influence of the co-emulsifier and the type of glycol on the G’ (a) and on η’ (b) in A (■), B (□), C (▲) and D (◊); n=2………... 103 Fig. 4.6. Thermogram of emulsion A. With photomicrographs of emulsion A
during a heating program with 10°C/min between 25°C and 260°C. At 25 ºC (a) and at 112 ºC (b), (magnification 100×)……….. 105 Fig. 4.7. Photomicrographs of A (a) and C (b) after 1 month of preparation
(magnification 250x)……….………... 107
Fig. 4.8. Possible schematic representation for the structure of the cold process o/w silicone based emulsion. a) General representation of an o/w emulsion containing swollen microgels in the water phase; b) schematic representation of an oil droplet; c) schematic representation of the molecules involved in the interfacial phenomenon, polymer modified silicone surfactant (1); cetrimide
(2); PGL (3)……….……. 110
Fig. 5.1. Permeation profile of MF from the HPMC and HPC gels through silicone membrane, (mean ± SD, n=6)……….……… 123 Fig. 5.2. Permeation profile of MF from HPMC and HPC gels through human
skin (mean ± SD, n=6)………. 123
Fig. 5.3. Release profile of MF from A, B, C and D emulsions through Tuffryn® membrane, (mean ± SD, n=6)……….……. 124 Fig. 5.4. Permeation profile of MF from A, B, C and D through silicone
membrane, (mean ± SD, n=6)……….. 126
Fig. 5.5. Permeation profile of MF from A and commercial cream through silicone membrane, (mean ± SD, n=6)……….…… 126 Fig. 5.6. Permeation profile of MF from A and B through human skin, (mean
of inhibition of the edema on a mouse ear, challenged with croton
oil, (mean ± SD, n=3)……….….. 129
Fig. 5.9. Effect of MF on croton oil-induced inflammatory cell infiltration of mouse ear. H&E-stained histological sections were prepared from ears resected 16 h after challenge: (a) unchallenged ear; (b) ear from mouse challenged with croton-oil in the absence of any treatment; (c) ear from mouse challenged with croton-oil post-treated with PT emulsion; (d) ear from mouse challenged with croton-oil post-treated with commercial cream. Magnification: 400x………. 130 Fig 6.1. Percentage of MF recovered in batch 1, 2 and 3 stored at 25°C ±
2°C/60% RH ± 5% RH over 12 months, (mean ± SD,
n=3)……….………. 149
Fig 6.2. Percentage of MF recovered in batch 1, 2 and 3 stored at 30°C ± 2°C/65% RH ± 5% RH over 12 months, (mean ± SD,
n=3)……….………. 149
Fig 6.3. Percentage of MF recovered in batch 1, 2 and 3 stored at 40°C ± 2°C/75% RH ± 5% RH over 12 months, (mean ± SD,
n=3)……….……….. 150
Fig 6.4. Percentage of MF recovered in batch 1, 2 and 3 stored at 25°C ± 2°C/60% RH ± 5% RH over 12 months considering t0 as 100%,
(mean ± SD, n=3)………...……….. 150
Fig 6.5. Percentage of MF recovered in batch 1, 2 and 3 stored at 30°C ± 2°C/65% RH ± 5% RH over 12 months considering t0 as 100%,
(mean ± SD, n=3)...……….. 151
Fig 6.6. Percentage of MF recovered in batch 1, 2 and 3 stored at 40°C ± 2°C/75% RH ± 5% RH over 12 months, considering t0 as 100%,
(mean ± SD, n=3)………..………... 151
Fig 6.7. Droplet size distribution of the batch 1 stored at 25 ºC, 0 (red line), 1 (green line), 3 (blue line), 6 (black line), 9 (violet line) and 12 (orange line) months after the preparation………. 152
xviii
Fig 6.9. Droplet size distribution of the batch 1 stored at 40 ºC, 0 (red line), 1 (green line), 3 (blue line), 6 (black line), 9 (violet line) and 12 (orange line) months after the preparation………..………. 153 Fig 6.10. Droplet size distribution of the placebo stored at 25 ºC, 0 (red line),
1 (green line), 3 (blue line), 6 (black line) and 12 (violet line) months after production……….………... 156 Fig 6.11. Droplet size distribution of the placebo stored at 30 ºC, 0 (red line),
1 (green line), 3 (blue line), 6 (grew line) and 12 (violet line) months
after production……….………... 156
Fig 6.12. Droplet size distribution of the placebo stored at 40 ºC, 0 (red line), 1 (green line), 3 (blue line), 6 (black line) and 12 (violet line) months after production………..………...…... 156 Fig. 7.1. Comparison of TEWL during 21 days between placebo A (black
bars) and control (grey bars), (mean ± SD, n = 10)………. 176 Fig. 7.2. Comparison of skin hydration values in terms of capacitance during
21 days between Placebo A (black bars) and control (grey bars),
(mean ± SD, n = 10)……….…… 176
Fig. 7.3. Effect of the application of placebo A on the skin surface lipids. placebo A (black bars) and control (grey bars), (mean ± SD, n =
10)……….……… 177
Fig. 8.1. Flow chat of placebo A industrial scale production……….… 188 Fig. 8.2. Droplet size distribution of lab-scale (red line), pilot lab-scale (green
line) and industrial pilot-scale (blue line) batches, stored at 25 ºC, 1
month after production……… 191
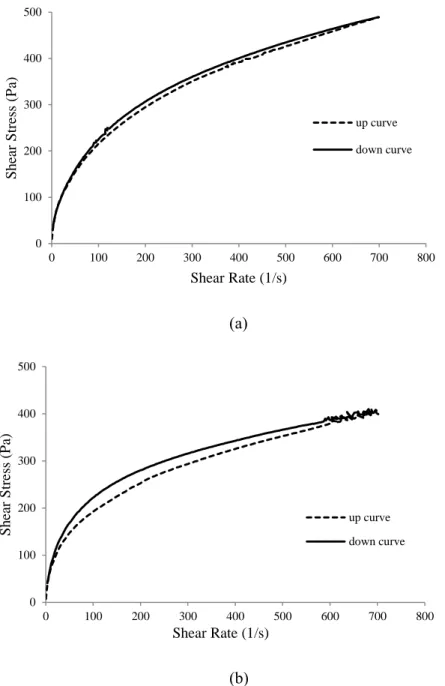
Fig. 8.3. Flow curves. Shear stress as function of shear rate of lab-scale (grey line), pilot lab-scale (dashed line) and pilot industrial-scale (black
Table 2.1. Beneficial effects of the most important functional groups of topical
corticoid molecules……….………. 12
Table 2.2. Conventional delivery systems for glucocorticoid delivery……... 17 Table 2.3. Glucocorticoid drug molecules incorporated in SLN and NLC……. 31 Table 3.1. Chemical and physical properties of MF……… 59 Table 3.2. Excipients used in the final emulsions with their chemical
structure………... 59
Table 3.3. MF solubility in different glycols, (n=3; mean ± SD)………. 66 Table 3.4. Solubility of MF in 10% (w/w) glycol in water mixtures (n=2; mean
± SD)... 68 Table 3.5. Physical stability of alkyl benzoate emulsions prepared with
Span®80 / Tween®80 combinations……….. 71
Table 3.6. Qualitative and quantitative composition (%, w/w) of preliminary emulsions (a)………... 72 Table 3.7. Qualitative and quantitative composition (%, w/w) of preliminary
emulsions (b)………... 73 Table 3.8. MF solubility in co-stabilizers, (n=3; mean ± SD)……….. 73 Table 3.9. Qualitative and quantitative composition (%, w/w) of preliminary
emulsions (c)………... 74 Table 3.10. Qualitative and quantitative composition (%, w/w) of preliminary
emulsions (d)………... 74 Table 3.11. Qualitative and quantitative composition (%, w/w) of preliminary
emulsions (e)………... 74 Table 3.12. Qualitative and quantitative composition (%, w/w) of preliminary
emulsions (f)………... 75
Table 3.13. Qualitative and quantitative composition (%, w/w) of preliminary emulsions (g)………... 76 Table 3.14. Qualitative and quantitative composition (%, w/w) of preliminary
xx
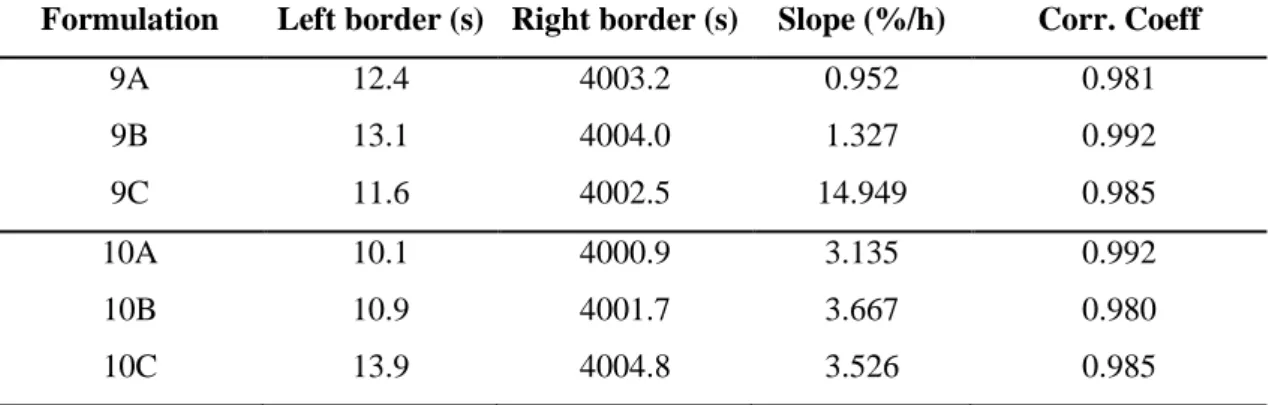
Table 3.16. Analytical parameters obtained after the analytical centrifugation for emulsions of the series 9 and 10……… 81 Table 3.17. Recover of MF (%) from formulations 9A, 9B and 9C9 during 60
days at room temperature and under stress conditions, (n=3; mean ±
SD)……….………. 81
Table 3.18. Recover of MF (%) from formulations 10A, 10B and 10C during 7 days at room temperature and under stress conditions, (n=3; mean ±
SD)………..………. 81
Table 3.19. Qualitative and quantitative composition (%, w/w) of the
preliminary emulsions (j)……… 82
Table 3.20. pH values for the emulsions during 60 days storage at 22 ºC, (n=3;
mean ± SD)……….… 84
Table 3.21. Recover of MF (%) of formulations 11A, 11B, 12A and 12B during 60 days at 22 ºC and under stress conditions, (n=3; mean ± SD)……... 84 Table 3.22. Antimicrobial activity of placebos (PA and PB) and 11A and 11B at
two different concentrations of cetrimide (0.075 and 0.600 %
w/w)……….…… 85
Table 4.1. Apparent viscosity values calculated at the apex of the loops (698 s
-1
)………...……… 102
Table 4.2. Calorimetric parameters of emulsions……….……… 106 Table 5.1. Flux and permeability coefficient (Kp) of MF through skin
membrane, (mean ± SD; n= 6)……… 124 Table 5.2. Kinetic parameters obtained after fitting the release data from the
formulations to different release models, where K is the release rate constant, b is the intercept and R2 the coefficient of
determination………... 125
Table 5.3. Flux, Kp and lag time of MF through skin membrane, (mean ± SD, n= 6) for A and B formulations………...…… 127 Table 5.4. Cell viability in NIH 3T3 and HaCaT cell lines after 72h of
and 40 ºC, (n=3; mean ± SD)………..… 147 Table 6.3. Stability test results for batch 2 during 12 months at 25 ºC, 30 ºC
and 40 ºC, (n=3; mean ± SD)……….. 148
Table 6.4. Stability test results for batch 3 during 12 months at 25 ºC, 30 ºC
and 40 ºC, (n=3; mean ± SD)……….. 148
Table 6.5. Microbiological stability of batch 1………..….. 152 Table 6.6. Droplet size distribution of emulsion A (batch 1) immediately after
preparation and after 1, 3, 6, 9 and 12 months of storage at 25 ºC,
(n=5, mean ± SD)……… 153
Table 6.7. Droplet size distribution of emulsion A (batch 1) immediately after preparation and after 1, 3, 6, 9 and 12 months of storage at 30 ºC,
(n=5, mean ± SD)……… 154
Table 6.8. Droplet size distribution of emulsion A (batch 1) immediately after preparation and after 1, 3, 6, 9 and 12 months of storage at 40 ºC,
(n=5, mean ± SD)……… 154
Table 6.9. Stability test results of placebo A stored for 12 months at 25 ºC, 30
ºC and 40 ºC………. 155
Table 6.10. Microbiological stability of the placebo A……….. 155 Table 6.11. Droplet size distribution of placebo A immediately after preparation
and after 1, 3, 6 and 12 months of storage at 25 ºC, (n=5, mean ±
SD)………... 157
Table 6.12. Droplet size distribution of placebo A immediately after preparation and after 1, 3, 6 and 12 months of storage at 30 ºC, (n=5, mean ±
SD)………... 157
Table 6.13. Droplet size distribution of placebo A immediately after preparation and after 1, 3, 6 and 12 months of storage at 40 ºC, (n=5, mean ±
SD)………... 157
Table 7.1. Chemical properties of the ingredients presented in the placebo
A……….. 170
xxii
Table 8.2. Apparent viscosity values calculated at the apex of the loops (24.47
s-1)……… 192
Table 8.3. Comparison between cold process and hot processes in terms of production costs for placebo A……… 193
1. Introduction
All the aims, objectives, theoretical background, materials, methodologies, findings, discussions and conclusions of my PhD research project are presented in this thesis. The research project, which began lst May 2009, integrated the development of innovative topical systems for the delivery of corticoids and was especially oriented to meet the industrial needs of a pharmaceutical Portuguese company, yet it has had a science based approach.
All the research and scientific work, results from a joint partnership between a Portuguese pharmaceutical company – Laboratório Edol, Produtos Farmacêuticos S.A (www.edol.pt) – and the Faculty of Pharmacy of the University of Lisbon, Portugal (www.ff.ul.pt).
The financial support of the entire research project, including the PhD grant, was equally shared by Laboratório Edol, Produtos Farmacêuticos S.A and by Portuguese Foundation for Science and Technology (grant number: SFRH/BDE/33550/2009), between May 2009 and May 2013.
The experimental work that supports this thesis was performed at the Departamento de Farmácia Galénica e Tecnologia Farmacêutica of the Faculty of Pharmacy of the University of Lisbon, with the exception of the structural analysis of the emulsions that was performed at the University of Strathclyde in Glasgow (United Kingdom), and both the validation of the high-performance liquid chromatography (HPLC) methods and the development of the scale-up process, which were respectively conducted at the Department of Quality Control and the Department of Production of Laboratório Edol Produtos Farmacêuticos S.A.
2. Motivation
Considering the increase of the complexity and competitiveness of the pharmaceutical market, it is of high importance for all pharmaceutical companies to pursuit the development of innovative pharmaceutical forms and products, in order to guarantee the quality of the products and, consequently, to strengthen the position of the companies in the market. In this sense, Laboratório Edol Produtos Farmacêuticos S.A needs to be constantly watchful to the feedback from consumers, as well as to the market
4
developments in order to detect gaps, new opportunities and/or possible ways of improving their products. Thus, it is very important for Laboratório Edol Produtos Farmacêuticos S.A to improve their products, as well as to develop new pharmaceutical dosage forms or products.
To better address this need, the know-how transfer from the university to the company is crucial to improve the performance of the company. In the last years, the marketing of new products was achieved by purchasing technical dossiers that include a complete set of data and supportive information, which allowed a quick introduction of new products on the market. However, this easy solution represents also a drawback to the development of the company.
The cooperation activities between the Departamento de Farmácia Galénica e Tecnologia Farmacêutica of the Faculty of Pharmacy of the University of Lisbon and Laboratório Edol Produtos Farmacêuticos S.A., for the development of new products and for the improvement of the quality and performance of the existing ones, for dermatologic and cosmetic purposes, started in 2005. This research project follows on the established cooperation partnership and aims to respond more effectively to the increasing demands of Laboratório Edol Produtos Farmacêuticos S.A.
Laboratório Edol Produtos Farmacêuticos S.A decided to develop a new area: unlike in the USA or in the rest of Europe, the cream and lotion compositions for the topical application of mometasone furoate (MF) marketed in Portugal are not protected. MF had its first market introduction authorization in Portugal on 22/08/91 as an ointment and cutaneous solution, having been protected by a Portuguese patent (PT 74357) that only protected the "process for preparing aromatic heterocyclic esters of steroids", which has lapsed on 29/01/2002. Nowadays, MF is marketed as powder and suspension for inhalation, cutaneous solution, cream and ointment.
Following this opportunity, our research project also aims to explore and develop possibilities of using drugs with unprotected patents and/or market introduction authorizations expired, but with an improved therapeutic activity.
3. Aims of the research project
The emphasis of this project relayed on the development and evaluation of emulsions for dermatologic applications. Also, the project activities were directed for achieving a main and final goal of creating added value for the company.
The aim of the present work was to develop pharmaceutical emulsion(s) for dermatologic use that are physically stable at acidic pH and including the minimum number of excipients, and requiring as little energy as possible during their preparation, i.e. by using a new and more economical method of emulsification: a cold process. During the formulation development, the aim was also to investigate the influence of the type of co-emulsifier and the type of glycol on the microstructure of the emulsions by rheological, thermal and microscopic techniques.
For this research thesis, we elected the dermatologic delivery of topical glucocorticoids, such as MF, as the main therapeutic application. The delivery of such drugs is challenging due to their chemical characteristics, namely their poor solubility in water and their stability in acidic conditions, which is often poorly compatible with emulsion stability.
Secondly, the final emulsions were studied using in vitro release and permeation tests and also in vivo studies, comparing the results to the performances of other benchmark products.
Finally, one of the studied emulsions was selected and a complete physical, chemical and microbiological stability assessment was conducted, according to the international pharmaceutical guidelines and standards. Additionally, the safety and biological effects of the placebo (product without drug) was assessed by using both in vitro and in vivo studies, as an adequate equilibrium between the safety and efficacy effects is of high importance.
6
4. Structure of the thesis
The thesis is divided in nine chapters:
- Chapter II consists on a literature review about the main functions of the skin, a detailed description about the physiology and anatomy of the main barrier for the percutaneous absorption – the stratum corneum (SC), as well as the main diffusion routes through the skin. This chapter also includes a literature review on the topical vehicles for dermal delivery of corticoids.
- Chapter III describes the pharmaceutical development according to the guideline ICH Q8 (R2). Throughout the formulation pharmaceutical development, four emulsions were selected.
- Chapter IV describes the structural analysis of these four emulsions, comprising all the data and information that allowed the selection of the best two of them.
- Chapter V presents the in vitro release and permeation studies as well as the in vitro cytotoxicity and the in vivo anti-inflammatory studies. At this stage, only one of the tested emulsions was selected to the complete physical, chemical and microbiological stability studies.
- Chapter VI describes the physical, chemical and microbiological stability studies according to the guideline ICH Q1A (R2).
- Chapter VII describes the safety assessment of the placebo (emulsion without drug) as well as its biological effects on human volunteers as the emulsion has also potential for being marketed as a cosmetic product.
- Chapter VIII addresses the first scale-up studies of the placebo.
- Chapter IX summarizes the highlights of the thesis regarding the experimental results and the impact of the work in the industrial field.
Finally, the annex I describes the validation procedures of the high-performance liquid chromatography (HPLC) method for the assay of MF in the final emulsion.
1. The Epidermal barrier
The main barrier to the percutaneous absorption of topically applied drugs is the SC. The structure of the SC can be described by a multilayer matrix of hydrophobic and hydrophilic components [1], which form a barrier to penetration of irritants, allergens and pathogenic microorganisms through skin.
The structural integrity of the SC is maintained by the presence of modified desmosomes, called corneodesmosomes, which lock the corneocytes together and provide tensile strength for the SC to resist to shearing forces [2]. Elias [3] visualized the SC as being similar to a brick wall, with the corneocytes analogous to bricks, and the lipid lamellae acting as mortar.
The barrier nature of the SC depends critically on its unique constituents; unlike the typical biological membranes mainly composed by phospholipids, the hydrophobic lipids present in the intercellular spaces of the SC are ceramides (45–50% consist of a sphingosine or a phytosphingosine base to which a non-hydroxy fatty acid or an alpha-hydroxy fatty acid is chemically linked), cholesterol (25%), long-chain free fatty acids mostly with chain lengths C22 and C24 (15%, highly enriched in linoleic acid), and 5% other lipids, the most important being cholesterol sulfate, cholesterol esters, and glucosylceramides [4]. These lipids, which are organized in multilamellar bilayers, regulate the passive flux of water through the SC and are considered to be very important for skin barrier function [5].
Due to the barrier nature of the SC, topically applied compounds may accumulate, that is. the SC may serve as a reservoir from which substances can be subsequently absorbed over long periods of time [1]. The reservoir function of SC was first reported by Vickers in 1963 [6], who demonstrated that topically applied corticosteroid forced into SC by occlusion remained there for 7-14 days, as observed by the development of a physiological marker, the vasoconstriction.
Almost since the introduction of the modern scientific study of percutaneous absorption, authors have debated the relative importance of three potential routes of entry from the surface of the skin into the sub-epidermal tissue (Fig. 2.1). Hence, the absorption of drugs through the skin can occur through intact epidermis – transepidermal route and/or skin appendages – transappendageal route [8]. Since skin appendages occupy less than 0.1% of the total human skin surface, the transappendageal route has generally been
10
considered to contribute minimally to the overall permeation [9]. However, these calculations did not take into the account that the hair follicles represent invaginations, which extend deep into the dermis with a significant increase in the actual surface area available for penetration.
Fig. 2.1. SC model scheme (“brick-and-mortar”) with the lipidic intercellular matrix and the possible penetration pathways (intercellular: dashed arrow; transcellular: black arrow); annexial route is also represented. Substances permeate mainly along the tortuous pathway in the intercellular lamellar regions which are oriented parallel to the corneocyte surface. Hydrophobic permeants diffuse through the SC intercellular bilayers – lipid route; Polar route could be a domain for hydrophilic molecules to penetrate the SC (adapted from [7]).
Transport across the SC is largely due to passive diffusion [10] and depends on a number of physicochemical properties of the vehicle, the skin and the permeant. Four physicochemical parameters pertaining to the drug were identified: the molar mass which determines the diffusion coefficient, the number of hydrogen-bond donors and the number of hydrogen-bond acceptors that control the interactions with the surface of corneocytes, and the octanol–water partition coefficient (logP) that represents the SC– water partition [11, 12].
On the other hand, recent advances in this area have demonstrated the important role of hair follicles as penetration pathways and reservoir structures for topically applied
compounds. Furthermore, it has been demonstrated that the penetration depth of the particles can be influenced by their size resulting in the possibility of a differentiated targeting of specific follicular structures. Thus, the selective delivery of topically applied substances to the contemplated target sites offers a diversity of therapeutic options [13-15].
There has been much debate over the past decades on the route of penetration but experimental evidence suggests that, under normal circumstances, the predominant route is through the intercellular spaces (transepidermal route). The diffusion path length is therefore much longer than the simple thickness of the SC (20 µm) and has been estimated as long as 500 µm. Importantly, the intercellular spaces contain structured lipids and a diffusing molecule has to cross a variety of lipophilic and hydrophilic domains before it reaches the junction between the SC and the viable epidermis. The nature of the barrier is thus very heterogeneous and it is perhaps surprising that diffusion through the skin can be described by simple solutions to Fick’s laws of diffusion [16, 17].
Many experimental methods for assessing percutaneous absorption are available now; this has largely been brought about by the development of sophisticated biophysical techniques and increased computing powers. The advanced technology has clearly provided indications, at a molecular level, about routes of permeation and how the barrier function can be modulated by excipients with which actives are formulated. Techniques such as attenuated total reflectance infrared (ATR) spectroscopy and fourier transform infrared spectroscopy (FTIR) [18, 19], nuclear magnetic resonance (NMR) [20] and transmission electron microscopy (TEM) [21] have been crucial to understand the routes of topical permeation. Barry et al. [22] explored a novel technique employing two human skin membranes to differentiate shunt route delivery from bulk transepidermal input. The method monitors penetration through epidermal membranes and compares it with delivery through a sandwich of SC and epidermis, with the SC forming a top membrane. The approach was particularly valuable for shunt route analysis, being also useful for passive diffusion and iontophoretic drug delivery.
12
2. Topic corticosteroid classification and relevance
The development of topical products for dermatological diseases represents an untapped opportunity for clinical pharmacology since they represent the most widely used preparations in dermatology [5].
The introduction of topical hydrocortisone (HC) by Sulzberger and Witten in 1952 [23] provided a major pharmacologic breakthrough for dermato-therapy, since the “compound F”, as they described HC, was for the first time, topically effective.
Chemical substitution at certain key positions is able to modify the potency of corticosteroids. For example, halogenation at the 9-α position enhances the potency by improving activity within the target cell and decreasing breakdown into inactive metabolites. Along the same lines, masking or removing the hydrophilic 17-dihydroxyacetone side-chain or the 16-α-hydroxy group will increase the molecule’s lipophilicity [24], thus enhancing penetration through the SC. The most important group’s modifications are described in Table 2.1.
Table 2.1. Beneficial effects of the most important functional groups of topical corticoid molecules (adapted from Katz and Gans [24]).
C – 11 β Converting = O to –βOH provided topical activity C - 9 Fluorine increased potency
C - 6 Fluorine increased potency
C - 9 and C - 6 Fluorines at both positions further increased potency as compared to only one fluorine.
C – 16, 17 The acetonide group provided increased penetrability and enhanced percutaneous absorption (e.g., acetonide was 10 times more active than parent topically but equal systemically).
C – 1, 2 The formation of a double bond between carbons 1 and 2 increased activity.
C - 21 Esterification with an acetate resulted in increased resistance to metabolic breakdown. This enhancement of lipophilicity resulted in optimization of percutaneous absorption.
Although many topical corticoids have been used for numerous skin disorders, their only “approved usage” remains for atopic dermatitis and psoriasis.
The acute and chonic dermatoses in which corticosteroids are the most effective treatment are seborrheic dermatitis, atopic dermatitis, localized neurodermatitis, anogenital pruritus, psoriasis (particularly of the face and between skinfolds), inflammatory phase of xerosis, and late phase of allergic contact dermatitis or irritant dermatitis.
Early in the era of topical corticoid, the U.S. Food and Drug Administration (FDA) developed a regulatory appeal system now almost universally accepted, whereby sponsors need only to demonstrate activity via parallel placebo-comparison studies in atopic dermatitis and psoriasis to obtain “class” labeling [25]. In fact, the only acceptable methods to assess bioavailability and bioequivalence of topically applied drug formulations are clinical trials between generic and original products and pharmacodynamic response studies, measured by the vasoconstrictor assay. A search in the clinicaltrials.gov [26] database showed that the main clinical trials in this area are focused on application regimens, dosage schedule, combine therapies, efficacy and safety assessment, or other therapeutic uses such as sun protection. Furthermore, all of these studies are being carried out with conventional formulations, i.e., creams, ointments and sprays, with no evidence for the use of advanced systems, such as nanoparticulate carriers, in glucocorticoid topical delivery.
Although clinical trials are considered the ‘gold standard’, these studies are relatively insensitive, costly, time-consuming and require large numbers of subjects. In contrast, pharmacodynamic response studies are relatively easy to perform and allow obtaining relevant information. Montenegro et al. [27] studied the effect of application time on skin blanching response and SC concentration after topical application of 0.1% betamethasone-17-valerate (BMV) cream on healthy volunteers.
The importance of corticoid therapy in skin diseases is associated to their long history of safety and effectiveness for certain conditions. This approach remains one of the most useful and widely prescribed treatments in day-to-day dermatologic practice, nearly 1.7 million prescriptions are dispensed each year for treatment of dermatological conditions [28]. It is, thus, not surprising that the global corticosteroid market grew by 9.7% over the period 2006–2007, accounting for $1.4bn in sales. Topical dermatological products with one or more corticosteroids and no other active
14
ingredients form the major share of the market at 75.5%. This class of corticosteroids also grew at a higher rate of 11%, compared to the second class of corticosteroids, which has an anti-infective agent in combination. The latter class recorded a growth of 6.1% over its 2006 sales of $336m. Increased safety concerns will restrict future growth for topical drugs that could be a suitable alternative to topical corticoids. As immunosuppressants these products have a declining market presence due to the FDA’s black box label warning in 2005 for potential cancer risk, which emphasises the important role of corticoids in the present and future economic trends [29].
3. Mechanism of action of topical glucocorticoids
The target cells for TG are, not only the keratinocytes and fibroblasts, but also immune cells (Tcells, monocytes, macrophages, langerhans cells), within the viable epidermis and dermis, where the glucocorticoid receptors are located [5, 30]. The transport across the cell membrane of TG is a non-mediated, passive diffusion process related to drug lipophilicity. Within the cytoplasm, the steroid molecule binds to the glucocorticoid receptor, forming a complex that is rapidly transported to the nucleus [5, 31]. Briefly, TG-receptor binding causes a conformational change of the receptor with consequent shedding of the binding domain capping protein, hsp90. Exposure of the DNA-binding site allows DNA-binding of the glucocorticoid-receptor complex to the glucocorticoid responsive element.
This interaction stimulates alterations in transcription, either positively or negatively, and thereby translation of proteins [32].
In addition to this direct regulatory effect on gene transcription, TG are also able to indirectly regulate transcription by blocking the effects of other transcription factors as nuclear factor-κB. TG may inhibit the transcription of proinflammatory cytokine genes (including the interleukins IL-1, IL-2, IL-6, interferon γ, and tumour necrosis factor-α genes), T-cell proliferation and T-cell dependent immunity. In fibroblasts, IL-1α is responsible for proliferation, collagenase induction, and IL-6 synthesis, which control skin thickness. The inhibition of IL-1α in keratinocytes has anti-inflammatory effects, whereas the same inhibition in fibroblasts has anti-proliferative and atrophogenic effects [5, 32, 33].