Influence of feeding graded levels of canned sardines on the inflammatory
markers and tissue fatty acid composition of Wistar rats
Pedro O. Rodrigues
1, Susana V. Martins
2, Paula A. Lopes
2, Cristina Ramos
3, Samuel Migue´is
3,
Cristina M. Alfaia
2, Rui M. A. Pinto
4, Eva A. Rolo
2, Paulo Bispo
1, Irineu Batista
3, Narcisa M. Bandarra
3and Jose´ A. M. Prates
2*
1CEDOC, Faculdade de Cieˆncias Me´dicas, Universidade Nova de Lisboa, Campo dos Ma´rtires da Pa´tria 130, 1169-056 Lisbon, Portugal
2CIISA, Faculdade de Medicina Veterina´ria, Universidade de Lisboa, Avenida da Universidade Te´cnica, Po´lo Universita´rio do Alto da Ajuda, 1300-477 Lisbon, Portugal
3DIVAV, Instituto Portugueˆs do Mar e da Atmosfera, Avenida de Brası´lia, 1449-006 Lisbon, Portugal
4iMed.UL, Faculdade de Farma´cia, Universidade de Lisboa, Avenida Professor Gama Pinto, 1649-003 Lisbon, Portugal
(Submitted 17 December 2013 – Final revision received 10 March 2014 – Accepted 18 March 2014 – First published online 29 April 2014)
Abstract
Canned sardines are a ready-to-use fish product with excellent nutritional properties owing to its high n-3 long-chain PUFA content, mainly EPA (20 : 5n-3) and DHA (22 : 6n-3). The present study aimed to assess the effect of two dosages of canned sardines, recommended for the primary and secondary prevention of human CVD, on the inflammatory marker concentrations and fatty acid composition of erythrocytes and key metabolic tissues (liver, muscle, adipose tissue and brain) in the rat model. Wistar rats were fed a diet containing 11 % (w/w) of canned sardines (low-sardine (LS) diet) and a diet containing 22 % (w/w) of canned sardines (high-sardine (HS) diet) for 10 weeks. Daily food intake, weight gain, and organ and final body weights were not affected by the dietary treatments. The concentrations of total cholesterol, HDL-cholesterol and LDL-cholesterol decreased in both the LS and HS groups, while those of alanine aminotransferase and adiponectin increased. The concentrations of IL-1b increased only with the highest dosage of sardine. The dose-dependent influence of the graded levels of EPAþ DHA was tissue specific. Compared with that of other tissues and erythrocytes, the fatty acid composition of the brain was less affected by the canned sardine-supplemented diets. In contrast, the retroperitoneal adipose tissue was highly responsive. The deposition ratios of EPA and DHA indicated that the LS diet was optimal for DHA deposition across the tissues, except in the retro-peritoneal adipose tissue. Taken together, our findings indicate that a LS diet positively affects plasma lipid profiles and inflammatory mediators, whereas a HS diet has contradictory effects on IL-1b, which, in turn, is not associated with variations in the concentrations of other pro-inflammatory cytokines. This finding requires further investigation and pathophysiological understanding.
Key words:Canned sardines: EPA: DHA: Fatty acid profiles: Cytokines: Wistar rats Exposure to a typical Western diet increases the risk of
metabolic disorders throughout the course of one’s life, creat-ing an intergenerational cycle of metabolic disease. In Western countries, this epidemic has coincided with a marked increase in the intake of n-6 PUFA, leading to suggestions that the two may be causally related(1). In contrast, diets rich in n-3 PUFA reduce the rates of all-cause mortality, in particular, cardiac arrest, sudden death or stroke, due to their positive effects on cholesterol, fasting insulin and TAG contents(2,3). Evidence from several studies supports the premise that increasing the intake of n-3 long-chain (. C18, LC) PUFA from fish oil affects tissue lipid composition, in particular, cell membrane fatty acids, and derived lipid mediator production, resulting
in clinical benefits(4). Such mediators derived from EPA
(20 : 5n-3) and DHA (22 : 6n-3) are anti-inflammatory, while those derived from the most prevalent n-6 LC-PUFA, arachi-donic acid (AA, 20 : 4n-6), are, in general, pro-inflammatory or exhibit other pathophysiological effects(5). Contrarily to the well-known inflammatory diseases, only more recently has chronic low-grade inflammation been recognised to be involved in obesity, type 2 diabetes mellitus, the metabolic syndrome and CVD(4), with the concentrations of systemic inflammatory markers, namely leptin, TNF-a, IL-1b and IL-6, being increased. In contrast, adiponectin exerts anti-inflammatory and insulin-sensitising effects with beneficial outcomes on cardiovascular and metabolic disorders(6 – 8).
* Corresponding author: J. A. M. Prates, fax þ 351 213652895, email [email protected]
Abbreviations: AA, arachidonic acid; ALT, alanine aminotransferase; AST, aspartate aminotransferase; FAME, fatty acid methyl esters; HOMA-IR, homeostasis model assessment of insulin resistance index; HS, high sardine; LA, linoleic acid; LC-PUFA, long-chain PUFA; LD, longissimus dorsi; LS, low sardine.
qThe Authors 2014
British
Journal
of
Sardine is a pelagic species and one of the main halieutic resources of the Portuguese coast with regard to the total annual catch(9). This species is an excellent source of n-3 LC-PUFA, in particular, EPA and DHA(10). In addition, canned products are convenient and ready-to-use food products that are a good source of digestible protein with a high content of LC-PUFA(11). The current nutritional recommendations for
EPAþ DHA intake are based on a clear inverse relationship between EPAþ DHA intake and the risk of fatal and non-fatal CVD. Due to the low efficiency of the conversion of a-linolenic acid into EPA and DHA in certain tissues, their maximum beneficial effect can only be achieved by direct dietary intake(12). For individuals with asymptomatic heart diseases,
the American Heart Association recommends for primary prevention the consumption of at least two fishmeals per week (preferably oily fish), which would provide an average of 500 mg/d of EPAþ DHA. For secondary prevention, aiming to reduce the risk of death from CVD, the American Heart Association recommends about 1000 mg/d of EPAþ DHA(13).
The present study aimed to determine which dosage of canned sardines, 11 and 22 % (w/w), is best to achieve a pre-ventive effect on CVD by means of beneficially influencing inflammatory markers in the Wistar rat model. An additional goal of the present study was to explore in which way these sardine dosages modulate the fatty acid profiles of key meta-bolic tissues (liver, muscle, adipose tissue and brain) and affect erythrocyte fatty acid composition and, therefore, the omega-3 index, a recognised marker for the evaluation of cardiovascular risk.
Experimental methods Experimental diets
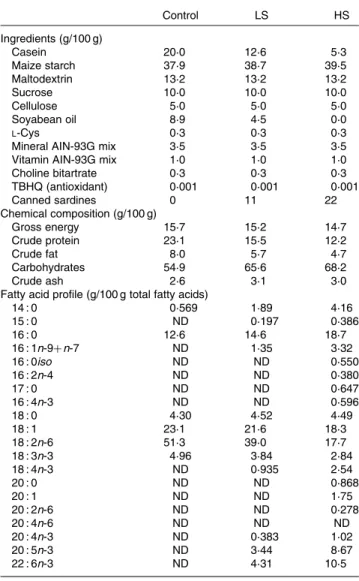
Canned sardines from the same lot were purchased from COFACO/CORESA (Lisbon, Portugal), and the experimental diets were manufactured by Sparos, Lda (Faro, Portugal). The composition of the granules was based on the commercial formula of the AIN-93G diet and lipid and protein levels were adjusted to obtain isoenergetic diets. After disposing the oil from cans, sardines were minced and mixed with other food ingredients to obtain a maximum incorporation of 22 g of sardines per 100 g of diet. In addition to the high-sar-dine (HS) diet (22 %, w/w), another diet with half the amount of sardines, 11 % (w/w) (low sardine; LS), was prepared. The proportion of EPAþ DHA in the three experimental diets was as follows: 0 % in the control diet; 7·7 % in the LS diet; 19·2 % in the HS diet. The proximate chemical composition of the diets was determined according to the AOAC(14), and the fatty acid composition was assessed as described by Ban-darra et al.(15)(Table 1).
Animals and sample collection
A total of twenty-seven male Wistar rats (Harlan Interfauna Iberica SL), aged 28 d, were housed individually under a 12 h light – 12 h dark cycle and at a temperature of 22 – 258C. After an adaptation period of 1 week, the rats were fed one
of the three experimental diets (nine animals per group). Body weight and feed intake were recorded twice a week. At the end of 10 weeks, the rats were fasted for 12 h and killed by decapitation, under light isoflurane anaesthesia. The trunk blood was collected in lithium heparin tubes and was left to stand for 30 min. Plasma was obtained after centrifugation at 1500 g for 10 min. Erythrocytes were obtained after washing the pellet twice with 0·9 % NaCl and centrifuging at 1500 g for 15 min. Erythrocyte aliquots were flash-frozen in liquid N2and stored at 2 808C for further
anal-ysis. After the collection of blood samples, liver, longissimus dorsi (LD) muscle, retroperitoneal adipose tissue and brain were removed, weighed and stored at 2 808C for fatty acid determination.
The experimental procedure was reviewed by the Ethics Commission of CIISA/FMV and approved by the Animal Care Committee of the National Veterinary Authority (Direcc¸a˜o-Geral de Veterina´ria, Portugal), following the appropriate European Union guidelines (2010/63/EU Directive).
Table 1. Chemical and fatty acid composition of the experimental diets
Control LS HS Ingredients (g/100 g) Casein 20·0 12·6 5·3 Maize starch 37·9 38·7 39·5 Maltodextrin 13·2 13·2 13·2 Sucrose 10·0 10·0 10·0 Cellulose 5·0 5·0 5·0 Soyabean oil 8·9 4·5 0·0 L-Cys 0·3 0·3 0·3
Mineral AIN-93G mix 3·5 3·5 3·5
Vitamin AIN-93G mix 1·0 1·0 1·0
Choline bitartrate 0·3 0·3 0·3 TBHQ (antioxidant) 0·001 0·001 0·001 Canned sardines 0 11 22 Chemical composition (g/100 g) Gross energy 15·7 15·2 14·7 Crude protein 23·1 15·5 12·2 Crude fat 8·0 5·7 4·7 Carbohydrates 54·9 65·6 68·2 Crude ash 2·6 3·1 3·0
Fatty acid profile (g/100 g total fatty acids)
14 : 0 0·569 1·89 4·16 15 : 0 ND 0·197 0·386 16 : 0 12·6 14·6 18·7 16 : 1n-9þ n-7 ND 1·35 3·32 16 : 0iso ND ND 0·550 16 : 2n-4 ND ND 0·380 17 : 0 ND ND 0·647 16 : 4n-3 ND ND 0·596 18 : 0 4·30 4·52 4·49 18 : 1 23·1 21·6 18·3 18 : 2n-6 51·3 39·0 17·7 18 : 3n-3 4·96 3·84 2·84 18 : 4n-3 ND 0·935 2·54 20 : 0 ND ND 0·868 20 : 1 ND ND 1·75 20 : 2n-6 ND ND 0·278 20 : 4n-6 ND ND ND 20 : 4n-3 ND 0·383 1·02 20 : 5n-3 ND 3·44 8·67 22 : 6n-3 ND 4·31 10·5
Control, 0 % (w/w) of canned sardines in the diet; LS, low sardine, 11 % (w/w) of canned sardines in the diet; HS, high sardine, 22 % (w/w) of canned sardines in the diet; TBHQ, tertiary butyl hydroquinone; ND, not detected.
British
Journal
of
Plasma biochemical assays
The plasma concentrations of total cholesterol, HDL-cholesterol, LDL-HDL-cholesterol, TAG, glucose, creatinine, urea, aspartate aminotransferase (AST) and alanine aminotransferase (ALT) were determined using standard diagnostic test kits obtained from Roche Diagnostics (Mannheim, Germany) in the Modular Hitachi Analytical System (Roche Diagnostics). The concentrations of VLDL-cholesterol and total lipids were calculated according to the Friedewald et al.(16) and Covaci
et al.(17) formulas, respectively. The serum/plasma concen-trations of adipokines were determined using a LINCOplex kit (RADPK-81K; Linco Research) with the Luminex xMAP technology (Lincoplex 200; Linco Research), which allowed the simultaneous determination of the concentrations of insulin, leptin, IL-1b, IL-6, TNF-a, monocyte chemoattractant protein-1 and plasminogen activator inhibitor-1. The concentrations of adiponectin were measured using a commercial ELISA kit (EZRADP-62K; Linco Research). The degree of insulin resist-ance was calculated by the homeostasis model assessment using the insulin resistance index (HOMA-IR)(18):
Fasting serum glucose ðmmol=lÞ £ fasting serum insulin ðmU=lÞ=22·5:
Analysis of fatty acid composition of erythrocytes and tissues
The fatty acid composition of the erythrocytes, liver, LD muscle, retroperitoneal adipose tissue and brain was analysed. Fatty acid methyl esters (FAME) were prepared according to the method of Bandarra et al.(10). The samples were lyophilised (2 608C and 2·0 hPa) to a constant weight. FAME were obtained through the addition of 1 ml of anhydrous methanol and 0·5 ml of sodium methoxide (1 mol/l in methanol), swirling for 5 min and 1 h reaction in the dark under the conditions described by Christie(19). Layer separation was improved by placing the con-tents in an ultrasonic bath for 10 min and centrifuging at 1500 g for 5 min. The n-hexane layer was collected and the aqueous phase re-extracted with 2·5 ml of n-hexane and centrifuged again. FAME were concentrated to a final volume of 25 ml in n-heptane, and 2 ml of the sample were injected on a capillary DB-Wax capillary column (30 m, 0·25 mm internal diameter and 0·25 mm film thickness; J&W Scientific/Agilent) in a Varian CP-3800 gas chromatograph equipped with a flame ionisation detector (Varian). The temperature of the injector and detector was set at 2508C. The adequate separation of FAME was achieved over a 40 min period, with 5 min at 1808C, followed by an increase of 48C/min until 2208C, and keeping the sample at this temperature for 25 min. The quantification of total fatty acids was based on the internal standard technique, using the heneicosanoic acid (21 : 0). Total fatty acids and individual fatty acids are expressed as a percentage of tissue dry weight and a percentage of total fatty acids, respectively.
Calculation of the tissue contents and deposition ratios of EPA and DHA
The contents of EPA and DHA in the tissues were calculated as mg/g of dry weight. The deposition ratios of the same fatty
acids were calculated by dividing the percentage of each fatty acid by the percentage in the feed as described by Berge et al.(20). A deposition ratio of 1 corresponds to a fatty acid being deposited in tissue lipids at the same rate as the fatty acid supplied in the lipids of the feed. A value , 1 corre-sponds to a relative depletion of the fatty acid and a value . 1 corresponds to a relative synthesis of the fatty acid.
Statistical analysis
Statistical analysis was carried out using the Statistical Analysis Systems (SAS) software package, version 9.1 (SAS Institute). All data were checked for normal distribution and variance homogeneity and reported as means with their standard errors. The generalised linear model procedure was used to carry out variance analysis and differences between the groups were calculated using Tukey’s post hoc test at P, 0·05.
Results
Animal body composition
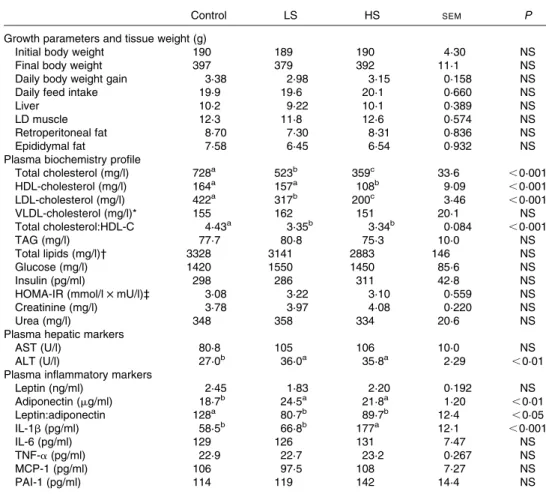
As shown in Table 2, the consumption of the LS and HS diets did not affect the daily feed intake, growth parameters or final body and tissue (liver, muscle, and epididymal and retroperitoneal fats) weights of the rats (P. 0·05).
Plasma metabolite profiles
The plasma metabolite values of each dietary treatment group are also given in Table 2. Rats fed the canned sardine-supplemented diets had consistently lower concentrations of total cholesterol and LDL-cholesterol (P, 0·001). The HS group had the lowest concentration of HDL-cholesterol than the other two experimental groups (P, 0·001). However, these changes resulted in a lower total cholesterol:HDL-cholesterol ratio in the LS and HS groups in relation to the control group (P, 0·05). Moreover, the dietary treatments did not induce any significant change in TAG, total lipid, glucose, insulin, creatinine, and urea concentrations and HOMA-IR values (P. 0·05). Higher concentrations of circu-lating ALT were found in both the sardine-supplemented groups than in the control group (P, 0·05). However, the AST:ALT ratio did not differ among the three dietary treatment groups (P. 0·05, data not shown).
Regarding the most important cytokines mainly produced by the adipose tissue, sardine supplementation did not affect the concentrations of leptin (P. 0·05), but increased those of adiponectin (P, 0·01). Nevertheless, the LS and HS groups had similar concentrations of adiponectin, and the leptin:adiponectin ratio in these two groups was lower than that in the control group (P, 0·05). The concentrations of pro-inflammatory markers IL-1b, IL-6, TNF-a, mono-cyte chemoattractant protein-1 and plasminogen activator inhibitor-1 are also summarised in Table 2. IL-1b was the only IL the concentration of which was significantly affected by sardine supplementation, with the HS group having a higher concentration than the control and LS groups (P, 0·05).
British
Journal
of
Fatty acid composition of erythrocytes and tissues
The total fatty acid composition of erythrocytes and tissues was not altered by the dietary treatments (P. 0·05), except for that of the retroperitoneal adipose tissue, with the HS group having higher values than the control and LS groups (P, 0·01) (Tables 3 – 7).
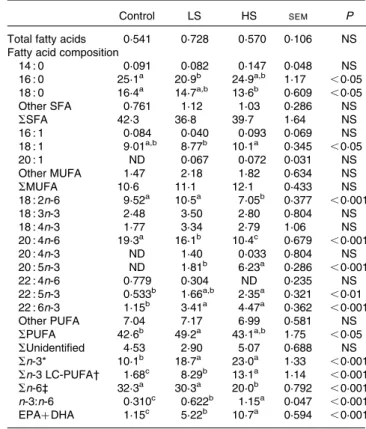
The relative percentage of FAME in erythrocytes is summarised in Table 3. Contrarily to those of total SFA and MUFA, the percentage of total PUFA was affected by the diet-ary treatments, with the LS group having higher values than the control group (P, 0·05). While the percentage of n-6 PUFA, such as linoleic acid (LA, 18 : 2n-6) and AA, decreased with sardine supplementation (P, 0·05), that of n-3 PUFA increased, especially the sum of n-3 LC-PUFA (P, 0·05). The percentage of EPA was significantly higher in the HS group than in the LS group (P, 0·001). However, the percentage of DHA in the LS and HS groups was similar, but was significantly higher than that in the control group (P, 0·001). With an increase in sardine intake, the percentage of EPAþ DHA in
erythrocytes increased 4·5-fold between the control and LS groups and 2·1-fold between the LS and HS groups (P, 0·001). The fatty acid profile of the liver is summarised in Table 4. The percentage of total SFA did not change (P. 0·05), but that of total MUFA in the LS group was lower than that in the HS group, mainly due to 16 : 1 and 18 : 1 fatty acids (P, 0·001). A significant increase in the percentages of the major n-3 LC-PUFA, EPA, 22 : 5n-3 and DHA (P, 0·001), and a significant decrease in the percentages of the main n-6 PUFA, LA and AA (P, 0·001), were observed. The percentage of EPAþ DHA increased 3·6-fold between the control and LS groups and 1·6-fold between the LS and HS groups.
There were significant differences in the percentages of the majority of fatty acids identified in the LD muscle among the dietary treatment groups (Table 5). The percentage of total SFA, and particularly 14 : 0 and 16 : 0 fatty acids, was sig-nificantly higher in the LS and HS groups than in the control group (P, 0·001). In relation to that of total MUFA, there was no difference in the percentage of 18 : 1 fatty acid, the major MUFA, among the dietary treatment groups (P. 0·05).
Table 2. Body composition parameters and plasma metabolite values
Control LS HS SEM P
Growth parameters and tissue weight (g)
Initial body weight 190 189 190 4·30 NS
Final body weight 397 379 392 11·1 NS
Daily body weight gain 3·38 2·98 3·15 0·158 NS
Daily feed intake 19·9 19·6 20·1 0·660 NS
Liver 10·2 9·22 10·1 0·389 NS
LD muscle 12·3 11·8 12·6 0·574 NS
Retroperitoneal fat 8·70 7·30 8·31 0·836 NS
Epididymal fat 7·58 6·45 6·54 0·932 NS
Plasma biochemistry profile
Total cholesterol (mg/l) 728a 523b 359c 33·6 ,0·001 HDL-cholesterol (mg/l) 164a 157a 108b 9·09 ,0·001 LDL-cholesterol (mg/l) 422a 317b 200c 3·46 ,0·001 VLDL-cholesterol (mg/l)* 155 162 151 20·1 NS Total cholesterol:HDL-C 4·43a 3·35b 3·34b 0·084 ,0·001 TAG (mg/l) 77·7 80·8 75·3 10·0 NS Total lipids (mg/l)† 3328 3141 2883 146 NS Glucose (mg/l) 1420 1550 1450 85·6 NS Insulin (pg/ml) 298 286 311 42·8 NS
HOMA-IR (mmol/l £ mU/l)‡ 3·08 3·22 3·10 0·559 NS
Creatinine (mg/l) 3·78 3·97 4·08 0·220 NS
Urea (mg/l) 348 358 334 20·6 NS
Plasma hepatic markers
AST (U/l) 80·8 105 106 10·0 NS
ALT (U/l) 27·0b 36·0a 35·8a 2·29 ,0·01
Plasma inflammatory markers
Leptin (ng/ml) 2·45 1·83 2·20 0·192 NS Adiponectin (mg/ml) 18·7b 24·5a 21·8a 1·20 ,0·01 Leptin:adiponectin 128a 80·7b 89·7b 12·4 ,0·05 IL-1b (pg/ml) 58·5b 66·8b 177a 12·1 ,0·001 IL-6 (pg/ml) 129 126 131 7·47 NS TNF-a (pg/ml) 22·9 22·7 23·2 0·267 NS MCP-1 (pg/ml) 106 97·5 108 7·27 NS PAI-1 (pg/ml) 114 119 142 14·4 NS
Control group, 0 % (w/w) of canned sardines in the diet; LS, low-sardine group, 11 % (w/w) of canned sardines in the diet; HS, high-sardine group, 22 % (w/w) of canned sardines in the diet; LD, longissimus dorsi; HOMA-IR, homeostasis model assessment of insulin resistance index; AST, aspartate aminotransferase; ALT, alanine aminotransferase; MCP-1, monocyte chemoattractant protein-1; PAI-1, plasminogen activator inhibitor-1.
a,b,cMean values within a row with unlike superscript letters were significantly different (P, 0·05; Tukey’s post hoc test).
* VLDL-cholesterol ¼ 1/5 (TAG).
† Total lipids ¼ (total cholesterol) £ 1·12 þ (TAG) £ 1·33 þ 148. ‡ HOMA-IR ¼ (fasting serum glucose) £ (fasting serum insulin)/22·5.
British
Journal
of
Conversely, there was a significant decrease in the percen-tage of total PUFA with an increase in sardine content in the diet (P, 0·001). The percentage of n-3 PUFA increased (P, 0·001), whereas that of n-6 PUFA decreased (P, 0·001), resulting in a significant increase in the n-3:n-6 ratio with sardine intake (P, 0·001). There was a decrease in the percen-tages of LA and AA in the LS and HS groups with respect to those in the control group (P, 0·001). The sardine-supplemented diets altered the relative proportions of EPA and DHA (P, 0·001). The percentage of EPAþ DHA increased 2·2-fold between the control and LS groups and 1·7-fold between the LS and HS groups.
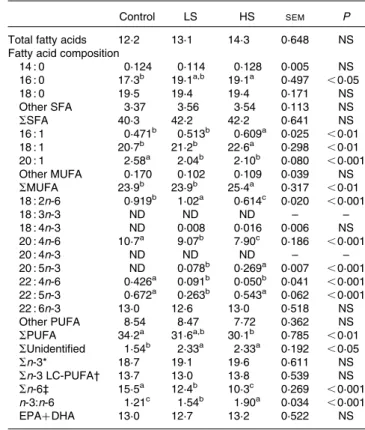
The fatty acid profile of the retroperitoneal adipose tissue is summarised in Table 6. The HF and LF groups had signifi-cantly higher percentages of SFA and MUFA than the control group, except for 18 : 1 fatty acid, which was present at similar values in the LS and control groups (P, 0·001). The percen-tage of LA, the most prevalent PUFA in retroperitoneal fat cells, decreased dramatically with sardine intake (P, 0·001). There were no variations in the percentage of AA between the LS and HS groups, but the percentage was significantly lower than that in the control group (P, 0·001). The percen-tage of n-3 PUFA (a-linolenic acid, 20 : 4n-3, EPA, 22 : 5n-3
and DHA) was higher in the sardine-supplemented groups (P, 0·001). Interestingly, the percentage of stearidonic acid (18 : 4n-3) was lower in the LS and HS groups than in the control group (P, 0·001). As the percentage of n-3 PUFA increased and that of n-6 PUFA decreased, the n-3:n-6 ratio increased progressively (P, 0·001). The percentage of EPAþ DHA increased 22·1-fold between the control and LS groups and 3·9-fold between the LS and HS groups.
The fatty acid profile of the brain is summarised in Table 7. The SFA 16 : 0 was the only fatty acid that exhibited an increase in its percentage in the HS group compared with that in the control group (P, 0·05). In fact, the percentage of total SFA did not differ among the three dietary treatment groups (P. 0·05). With regard to MUFA, the highest percen-tage of 20 : 1 fatty acid was observed in the control group (P, 0·001). However, the percentages of 16 : 1 and 18 : 1 fatty acids were much higher in the HS group than in the LS or control group (P, 0·01). The same trend was observed for the percentage of total MUFA (P, 0·01). In addition, the lowest percentages of LA, AA, 22 : 4n-6 and total n-6 PUFA were observed in the HS group (P, 0·001). Moreover, there was no significant change in the sum of n-3 PUFA (P. 0·05). Furthermore, a-linolenic acid (18 : 3n-3) and 20 : 4n-3 were
Table 4. Total fatty acids (percentage of dry weight) and fatty acid composition (percentage of total fatty acids) of the liver
Control LS HS SEM P
Total fatty acids 20·8 15·8 22·4 2·04 NS
Fatty acid composition
14 : 0 0·373b 0·424b 0·655a 0·065 ,0·05 16 : 0 17·5b 18·8a,b 22·6a 1·26 ,0·05 18 : 0 11·8b 13·9a 11·4b 0·529 ,0·01 Other SFA 0·998 0·757 0·731 0·118 NS SSFA 30·7 33·8 35·4 1·44 NS 16 : 1 1·05b 1·18b 2·66a 0·337 ,0·01 18 : 1 13·9a 11·5b 14·8a 0·473 ,0·001 20 : 1 0·292 0·220 0·213 0·068 NS Other MUFA 0·354 0·251 1·27 0·578 NS SMUFA 15·6b 13·2b 19·0a 0·850 ,0·001 18 : 2n-6 30·1a 24·3b 14·4c 0·630 ,0·001 18 : 3n-3 0·419 0·171 0·235 0·121 NS 18 : 4n-3 0·656a 0·633a 0·125b 0·134 ,0·05 20 : 4n-6 16·4a 11·8b 5·89c 0·766 ,0·001 20 : 4n-3 0·019b 0·038b 0·312a 0·028 ,0·001 20 : 5n-3 0·332c 3·27b 7·68a 0·702 ,0·001 22 : 4n-6 0·164 0·038 0·146 0·044 NS 22 : 5n-3 0·445c 1·78b 2·35a 0·188 ,0·001 22 : 6n-3 3·02c 8·81b 11·2a 0·939 ,0·001 Other PUFA 1·48 1·47 1·22 0·448 NS SPUFA 53·0a 52·2a 43·6b 1·68 ,0·01 SUnidentified 0·743b 0·743b 2·06a 0·336 ,0·05 Sn-3* 4·96c 14·7b 22·0a 1·20 ,0·001 Sn-3 LC-PUFA† 3·82c 13·9b 21·6a 1·19 ,0·001 Sn-6‡ 47·4a 37·2b 21·0c 0·933 ,0·001 n-3:n-6 0·105c 0·395b 1·05a 0·052 ,0·001 EPAþ DHA 3·35c 12·1b 18·9a 1·05 ,0·001 Control group, 0 % (w/w) of canned sardines in the diet; LS, low-sardine group, 11 % (w/w) of canned sardines in the diet; HS, high-sardine group, 22 % (w/w) of canned sardines in the diet; LC-PUFA, long-chain PUFA.
a,b,cMean values within a row with unlike superscript letters were significantly
different (P, 0·05; Tukey’s post hoc test).
* Sn-3 ¼ S(18 : 3n-3, 18 : 4n-3, 20 : 4n-3, 20 : 5n-3, 22 : 5n-3, 22 : 6n-3). † Sn-3 LC-PUFA ¼ S(20 : 4n-3, 20 : 5n-3, 22 : 5n-3, 22 : 6n-3). ‡ Sn-6 ¼ S(18 : 2n-6, 20 : 4n-6, 22 : 4n-6).
Table 3. Total fatty acids (percentage of dry weight) and fatty acid composition (percentage of total fatty acids) of the erythrocytes
Control LS HS SEM P
Total fatty acids 0·541 0·728 0·570 0·106 NS Fatty acid composition
14 : 0 0·091 0·082 0·147 0·048 NS 16 : 0 25·1a 20·9b 24·9a,b 1·17 ,0·05 18 : 0 16·4a 14·7a,b 13·6b 0·609 ,0·05 Other SFA 0·761 1·12 1·03 0·286 NS SSFA 42·3 36·8 39·7 1·64 NS 16 : 1 0·084 0·040 0·093 0·069 NS 18 : 1 9·01a,b 8·77b 10·1a 0·345 ,0·05 20 : 1 ND 0·067 0·072 0·031 NS Other MUFA 1·47 2·18 1·82 0·634 NS SMUFA 10·6 11·1 12·1 0·433 NS 18 : 2n-6 9·52a 10·5a 7·05b 0·377 ,0·001 18 : 3n-3 2·48 3·50 2·80 0·804 NS 18 : 4n-3 1·77 3·34 2·79 1·06 NS 20 : 4n-6 19·3a 16·1b 10·4c 0·679 ,0·001 20 : 4n-3 ND 1·40 0·033 0·804 NS 20 : 5n-3 ND 1·81b 6·23a 0·286 ,0·001 22 : 4n-6 0·779 0·304 ND 0·235 NS 22 : 5n-3 0·533b 1·66a,b 2·35a 0·321 ,0·01 22 : 6n-3 1·15b 3·41a 4·47a 0·362 ,0·001 Other PUFA 7·04 7·17 6·99 0·581 NS SPUFA 42·6b 49·2a 43·1a,b 1·75 ,0·05 SUnidentified 4·53 2·90 5·07 0·688 NS Sn-3* 10·1b 18·7a 23·0a 1·33 ,0·001 Sn-3 LC-PUFA† 1·68c 8·29b 13·1a 1·14 ,0·001 Sn-6‡ 32·3a 30·3a 20·0b 0·792 ,0·001 n-3:n-6 0·310c 0·622b 1·15a 0·047 ,0·001 EPAþ DHA 1·15c 5·22b 10·7a 0·594 ,0·001 Control group, 0 % (w/w) of canned sardines in the diet; LS, low-sardine group,
11 % (w/w) of canned sardines in the diet; HS, high-sardine group, 22 % (w/w) of canned sardines in the diet; ND, not detected; LC-PUFA, long-chain PUFA.
a,b,cMean values within a row with unlike superscript letters were significantly
different (P, 0·05; Tukey’s post hoc test).
* Sn-3 ¼ S(18 : 3n-3, 18 : 4n-3, 20 : 4n-3, 20 : 5n-3, 22 : 5n-3, 22 : 6n-3). † Sn-3 LC-PUFA ¼ S(20 : 4n-3, 20 : 5n-3, 22 : 5n-3, 22 : 6n-3). ‡ Sn-6 ¼ S(18 : 2n-6, 20 : 4n-6, 22 : 4n-6).
British
Journal
of
Nutrition
not detected in the brain. Interestingly, EPA was the only n-3 PUFA that exhibited an increase in its percentage in the dietary treatment groups fed the sardine-supplemented diets, while DHA did not exhibit any change in its percentage. In fact, the n-3:n-6 ratio increased significantly (P, 0·001), but there was no change in the sum of EPAþ DHA contents (P. 0·05).
Tissue contents and deposition ratios of EPA and DHA
In general, the increase in canned sardine intake from 11 % (LS diet) to 22 % (HS diet) led to an effective increase in tissue EPA and DHA contents (Fig. 1). However, the DHA contents of the erythrocytes, muscle and brain were similar in both the LS and HS groups (P. 0·05). In comparative terms, the brain was richer in DHA than in EPA, among the tissues. The increases in EPA and DHA contents were signifi-cantly higher in the liver and retroperitoneal adipose tissue when comparing the LS and HS groups (P, 0·05).
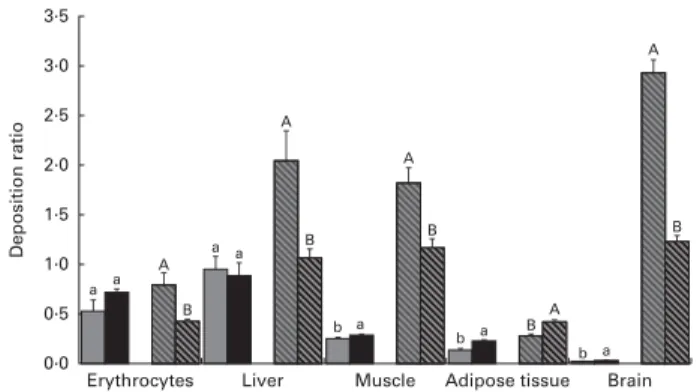
In Fig. 2, the deposition ratios of EPA and DHA in the tissues are shown. Overall, EPA was deposited at lower rates (, 1) in each tissue. In contrast, the values of EPA deposition ratio in the erythrocytes and liver were much higher than those observed in other tissues. The values of EPA deposition ratio in the erythrocytes and liver were similar in both the LS and HS groups (P. 0·05); however, in the LD muscle,
retroperitoneal adipose tissue and brain, the values were slightly increased with a higher dosage of sardine (P, 0·05). The deposition ratio of DHA was greater than 1 in the liver, LD muscle and brain. The increase in dietary sardine content did not reflect an increase in the tissue deposition ratio, except for the retroperitoneal adipose tissue. In the latter, the deposition ratio of DHA was higher in the HS group than in the LS group (P, 0·05).
Discussion
Based on the n-3 LC-PUFA dietary recommendations made by the American Heart Association for the primary and secondary prevention of CVD(13)and taking into account that the average of energy provided per day should be about 8374 kJ (2000 kcal) for humans v. 1256 kJ (300 kcal) for rats, the EPA and DHA dietary intakes were extrapolated to the rat model. The values calculated were found to be 76 and 151 mg/d of EPAþ DHA and were very similar to the amounts of EPAþ DHA used in the present study, 70 and 152 mg/d of EPAþ DHA, corresponding to diets with 11 % (w/w) of canned sardines (LS) and 22 % (w/w) of canned sardines (HS), respectively.
In the present study, the consumption of both LS and HS diets by Wistar rats modified the profiles of systemic
Table 5. Total fatty acids (percentage of dry weight) and fatty acid composition (percentage of total fatty acids) of the longissimus dorsi muscle
Control LS HS SEM P
Total fatty acids 7·62 6·30 5·59 0·809 NS
Fatty acid composition
14 : 0 0·954c 1·44b 2·06a 0·079 ,0·001
16 : 0 18·8c 22·2b 25·8a 0·472 ,0·001
18 : 0 7·73 7·71 6·94 0·642 NS
Other SFA 1·62b 1·77a,b 2·09a 0·115 ,0·05
SSFA 29·1c 33·1b 36·9a 0·833 ,0·001 16 : 1 2·71b 3·66b 6·31a 0·355 ,0·001 18 : 1 20·0 20·6 19·4 0·875 NS 20 : 1 0·235b 0·399a,b 0·517a 0·064 ,0·05 Other MUFA 0·117a 0·015b ND 0·016 ,0·001 SMUFA 23·0 24·6 26·3 1·12 NS 18 : 2n-6 31·2a 25·9b 13·6c 0·965 ,0·001 18 : 3n-3 1·53a 1·28a 0·910b 0·096 ,0·01 18 : 4n-3 ND 0·030b 0·315a 0·021 ,0·001 20 : 4n-6 7·42a 3·63b 2·89b 0·526 ,0·001 20 : 4n-3 ND 0·014b 0·305a 0·014 ,0·001 20 : 5n-3 0·020c 0·865b 2·48a 0·061 ,0·001 22 : 4n-6 0·269 ND ND 0·017 ,0·001 22 : 5n-3 1·05b 1·21b 1·73a 0·127 ,0·01 22 : 6n-3 4·01c 7·83b 12·3a 0·735 ,0·001 Other PUFA 0·914 0·956 1·05 0·077 NS SPUFA 47·0a 41·8b 35·6c 0·956 ,0·001 SUnidentified 1·50 0·510 1·27 0·477 NS Sn-3* 7·43c 12·0b 18·9a 0·859 ,0·001 Sn-3 LC-PUFA† 5·08c 9·91b 16·5a 0·875 ,0·001 Sn-6‡ 39·4a 29·6b 16·6c 0·660 ,0·001 n-3:n-6 0·190c 0·410b 1·15a 0·047 ,0·001 EPAþ DHA 4·03c 8·70b 14·8a 0·770 ,0·001
Control group, 0 % (w/w) of canned sardines in the diet; LS, low-sardine group, 11 % (w/w) of canned sardines in the diet; HS, high-sardine group, 22 % (w/w) of canned sardines in the diet; ND, not detected; LC-PUFA, long-chain PUFA.
a,b,cMean values within a row with unlike superscript letters were significantly different (P, 0·05; Tukey’s post hoc test).
* Sn-3 ¼ S(18 : 3n-3, 18 : 4n-3, 20 : 4n-3, 20 : 5n-3, 22 : 5n-3, 22 : 6n-3). † Sn-3 LC-PUFA ¼ S(20 : 4n-3, 20 : 5n-3, 22 : 5n-3, 22 : 6n-3). ‡ Sn-6 ¼ S(18 : 2n-6, 20 : 4n-6, 22 : 4n-6).
British
Journal
of
Nutrition
metabolites. The 11 % dosage of canned sardines was suffi-cient to decrease total cholesterol and LDL-cholesterol con-centrations and total cholesterol:HDL-cholesterol ratio, as well as to increase adiponectin concentrations, thus reducing cardiovascular risk factors. In comparative terms, an additional decrease in lipid parameters was observed with the higher dosage of canned sardines. Bandarra et al.(10) also observed a reduction in total cholesterol concentrations in Wistar rats fed sardine oil-enriched diets. The mechanism by which EPA and DHA decrease plasma cholesterol concentrations is not well established and contradictory results have been reported by epidemiological studies(12). It has been shown that n-3 LC-PUFA serve as PPAR-a and PPAR-g ligands(12). Therefore,
a possible explanation for our findings is that n-3 LC-PUFA may lead to PPAR-a stimulation, decreasing the expression of the active nuclear form of sterol regulatory element-binding protein-1(21)and increasing the activity of LDL receptor(22).
Dietary EPA and DHA can also decrease plasma TAG con-centrations by inhibiting the activity of enzymes associated with fatty acid synthesis or through the reduction of fatty acid synthesis in the liver, thus decreasing the secretion of TAG into the bloodstream(23,24). In addition, Qiao et al.(25) have suggested that adiponectin decreases plasma TAG con-centrations by increasing skeletal muscle lipoprotein lipase
and VLDL removal from the blood. We found that the 11 % (w/w) canned sardine diet was able to increase adiponectin concentrations in the plasma of rats, although no changes in plasma TAG concentrations were observed in both the sardine-supplemented groups. Neschen et al.(26)have shown that supplementation with menhaden fish oil, although at a higher dosage (27 % (w/w) of fish oil in the diet), increases plasma adiponectin concentrations in mice as well. Similar to the results obtained for plasma glucose and insulin concen-trations, the HOMA-IR index was identical across the dietary treatment groups, without evidence of insulin resistance, suggesting that high plasma adiponectin concentrations enhance insulin sensitivity and play an important role in glu-cose and lipid metabolism and homeostasis(27,28). In a similar manner, canned sardines supplementation did not alter creati-nine and urea concentrations, thus indicating unaffected renal function(29). Apart from these valid explanations, our findings regarding the non-variation in the profiles of some plasma metabolites may have resulted due to the composition of the basal (control) diet, which could have limited the occurrence of further reductions.
Considering the prudent and plausible utilisation of n-3 LC-PUFA in the prevention of CVD, it is necessary to guarantee that their intake leads to no undesirable side effects. In parallel
Table 6. Total fatty acids (percentage of dry weight) and fatty acid composition (percentage of total fatty acids) of the retroperitoneal adipose tissue
Control LS HS SEM P
Total fatty acids 58·7b 54·0b 73·3a 4·01 ,0·01
Fatty acid composition
14 : 0 0·979c 1·77b 3·08a 0·053 ,0·001 16 : 0 16·8c 21·3b 28·6a 0·406 ,0·001 18 : 0 3·17c 3·70b 4·06a 0·114 ,0·001 Other SFA 0·628c 0·827b 1·01a 0·035 ,0·001 SSFA 21·6c 27·6b 36·7a 0·408 ,0·001 16 : 1 2·19c 3·65b 6·65a 0·243 ,0·001 18 : 1 27·8a 27·8a 26·5b 0·251 ,0·01 20 : 1 0·372c 0·786b 1·08a 0·050 ,0·001 Other MUFA 0·125 0·169 0·183 0·018 NS SMUFA 30·5c 32·4b 34·4a 0·348 ,0·001 18 : 2n-6 42·4a 32·3b 14·3c 0·539 ,0·001 18 : 3n-3 0·264b 0·207b 0·642a 0·018 ,0·001 18 : 4n-3 2·40a 2·10b 1·70c 0·050 ,0·001 20 : 4n-6 0·585a 0·296b 0·349b 0·024 ,0·001 20 : 4n-3 0·005c 0·140b 0·610a 0·013 ,0·001 20 : 5n-3 0·011c 0·466b 1·97a 0·070 ,0·001 22 : 4n-6 0·047a,b 0·010b 0·056a 0·013 ,0·05 22 : 5n-3 0·055c 0·541b 1·38a 0·048 ,0·001 22 : 6n-3 0·064c 1·20b 4·43a 0·134 ,0·001
Other PUFA 1·14a,b 1·03b 1·23a 0·035 ,0·01
SPUFA 47·0a 38·3b 26·7c 0·591 ,0·001 SUnidentified 0·937c 1·69b 2·18a 0·049 ,0·001 Sn-3* 2·81c 4·67b 10·8a 0·279 ,0·001 Sn-3 LC-PUFA† 0·135c 2·35b 8·40a 0·240 ,0·001 Sn-6‡ 43·6a 32·9b 15·2c 0·538 ,0·001 n-3:n-6 0·065c 0·143b 0·716a 0·019 ,0·001 EPAþ DHA 0·075c 1·66b 6·41a 0·190 ,0·001
Control group, 0 % (w/w) of canned sardines in the diet; LS, low-sardine group, 11 % (w/w) of canned sardines in the diet; HS, high-sardine group, 22 % (w/w) of canned sardines in the diet; LC-PUFA, long-chain PUFA.
a,b,cMean values within a row with unlike superscript letters were significantly different (P, 0·05; Tukey’s post hoc test).
* Sn-3 ¼ S(18 : 3n-3, 18 : 4n-3, 20 : 4n-3, 20 : 5n-3, 22 : 5n-3, 22 : 6n-3). † Sn-3 LC-PUFA ¼ S(20 : 4n-3, 20 : 5n-3, 22 : 5n-3, 22 : 6n-3). ‡ Sn-6 ¼ S(18 : 2n-6, 20 : 4n-6, 22 : 4n-6).
British
Journal
of
Nutrition
with the aforementioned beneficial changes in plasma metabolite profiles, our experimental data indicated that the consumption of the 22 % (w/w) canned sardine diet increased the circulating concentrations of IL-1b, a pro-inflammatory marker. Despite the well-recognised anti-inflammatory role of n-3 LC-PUFA in human studies(30), their action can be mediated by different signalling pathways. It has recently been reported that IL-1b production can be modulated by dietary fatty acids. While palmitic acid (16 : 0) has been shown to be associated with an increase in the concentrations of IL-1b, DHA has been demonstrated to have an inverse effect on the secretion of this IL(31). Interestingly, the sum of
SFA, mainly 16 : 0, was increased in the muscle and adipose tissue in the HS group when compared with that in the LS group. This could have led to the activation of Toll-like recep-tors, inducing inflammasome-mediated IL-1b production(31).
The underlying justification for this negative finding may be directly associated with the amounts of SFA and DHA avail-able in the HS diet. The contribution of these fatty acids and their putative interplay to pro- or anti-inflammatory final events remains unclear.
Recently, a study using Wistar rats has shown both positive and negative effects after menhaden fish oil supple-mentation(32). The diet used by Shirazi et al.(32), with 15·9 %
of energy as fish oil, decreased total cholesterol and LDL-cholesterol concentrations, but induced fatty liver (steatosis) and the formation of atherogenic lesions, in contrast to the present results. In accordance with this, plasminogen activator inhibitor-1 and monocyte chemoattractant protein-1 concen-trations were similar among the dietary treatment groups of the present study. Although the fat supplementation dosage was similar to the value used in the experimental diets (14·7 % of diet energy), the values of both liver weight and total fatty acid percentages were not affected, thus excluding the possibility of hepatic lipotoxicity. The enzymes AST and ALT have been accepted as the markers of liver injury; the activity of ALT is more indicative of hepatic diseases than that of AST. Despite the increase in ALT activity at both dosages of canned sardines, it is worth noting that the levels were still within the reference values for rats, which are 35·1 (SD 13·3) U/l(29), and the AST:ALT ratio did not vary among the three dietary treatment groups.
The sum of EPA and DHA contents in erythrocyte mem-branes, expressed as a percentage of total fatty acids, is known as the omega-3 index(33). It appears to be a good bio-marker of EPAþ DHA intake(33). In fact, it can be perceived as a new surrogate risk factor that is associated with dietary fatty acids and morbidity and mortality associated with CVD(33). Harris & von Schacky(33) observed that an omega-3 index
value . 8 % is associated with the greatest cardioprotection, whereas values , 4 % have the least protective capacity. In the present study, changes in erythrocyte fatty acid compo-sition were directly related to sardine supplementation, with omega-3 index values of 5 and 11 % being found in the LS and HS groups, respectively.
The liver has a pivotal function in the regulation of lipid and lipoprotein metabolism. The present results indicated that the fatty acid composition of the liver is very susceptible
Table 7. Total fatty acids (percentage of dry weight) and fatty acid composition (percentage of total fatty acids) of the brain
Control LS HS SEM P
Total fatty acids 12·2 13·1 14·3 0·648 NS Fatty acid composition
14 : 0 0·124 0·114 0·128 0·005 NS 16 : 0 17·3b 19·1a,b 19·1a 0·497 ,0·05 18 : 0 19·5 19·4 19·4 0·171 NS Other SFA 3·37 3·56 3·54 0·113 NS SSFA 40·3 42·2 42·2 0·641 NS 16 : 1 0·471b 0·513b 0·609a 0·025 ,0·01 18 : 1 20·7b 21·2b 22·6a 0·298 ,0·01 20 : 1 2·58a 2·04b 2·10b 0·080 ,0·001 Other MUFA 0·170 0·102 0·109 0·039 NS SMUFA 23·9b 23·9b 25·4a 0·317 ,0·01 18 : 2n-6 0·919b 1·02a 0·614c 0·020 ,0·001 18 : 3n-3 ND ND ND – – 18 : 4n-3 ND 0·008 0·016 0·006 NS 20 : 4n-6 10·7a 9·07b 7·90c 0·186 ,0·001 20 : 4n-3 ND ND ND – – 20 : 5n-3 ND 0·078b 0·269a 0·007 ,0·001 22 : 4n-6 0·426a 0·091b 0·050b 0·041 ,0·001 22 : 5n-3 0·672a 0·263b 0·543a 0·062 ,0·001 22 : 6n-3 13·0 12·6 13·0 0·518 NS Other PUFA 8·54 8·47 7·72 0·362 NS SPUFA 34·2a 31·6a,b 30·1b 0·785 ,0·01 SUnidentified 1·54b 2·33a 2·33a 0·192 ,0·05 Sn-3* 18·7 19·1 19·6 0·611 NS Sn-3 LC-PUFA† 13·7 13·0 13·8 0·539 NS Sn-6‡ 15·5a 12·4b 10·3c 0·269 ,0·001 n-3:n-6 1·21c 1·54b 1·90a 0·034 ,0·001 EPAþ DHA 13·0 12·7 13·2 0·522 NS
Control group, 0 % (w/w) of canned sardines in the diet; LS, low-sardine group, 11 % (w/w) of canned sardines in the diet; HS, high-sardine group, 22 % (w/w) of canned sardines in the diet; ND, not detected; LC-PUFA, long-chain PUFA.
a,b,cMean values within a row with unlike superscript letters were significantly
different (P, 0·05; Tukey’s post hoc test).
* Sn-3 ¼ S(18 : 3n-3, 18 : 4n-3, 20 : 4n-3, 20 : 5n-3, 22 : 5n-3, 22 : 6n-3). † Sn-3 LC-PUFA ¼ S(20 : 4n-3, 20 : 5n-3, 22 : 5n-3, 22 : 6n-3). ‡ Sn-6 ¼ S(18 : 2n-6, 20 : 4n-6, 22 : 4n-6). a cb BA Ab b a C B A c b a B A A b b a C B A cba A B A,B 0 5 10 15 20 25 30 35 40
Erythrocytes Liver Muscle Adipose tissue Brain
Tissue content (mg/g)
Fig. 1. Tissue contents (mg/g dry weight) of EPA and DHA in the erythro-cytes, liver, longissimus dorsi muscle, retroperitoneal adipose tissue and brain of Wistar rats fed graded levels of canned sardines: low sardine (LS, 11 % (w/w)) and high sardine (HS, 22 % (w/w)). Values are means, with their standard errors represented by vertical bars.a,b,cFor EPA, mean values with unlike letters were significantly different among the control, LS and HS groups (P, 0·05; Tukey’s post hoc test).A,B,CFor DHA, mean values with unlike letters were significantly different among the control, LS and HS groups (P, 0·05; Tukey’s post hoc test). , EPA – control group; , EPA –
LS group; , EPA – HS group; , DHA – control group; , DHA – LS
group; , DHA – HS group.
British
Journal
of
to diets with graded levels of canned sardines, with an almost 2-fold increase in the tissue contents of EPA and DHA. However, the deposition ratio of DHA was not proportional to the correspondent levels of sardine supplementation. The skeletal muscle is mainly involved in lipid oxidation to produce chemical energy. Although DHA was incorporated at amounts (in absolute values) higher than those of EPA, only the deposition ratio of EPA increased with an increase in sardine content in the diet. In addition, the retroperitoneal adipose tissue under study was a visceral fat depot closely associated with the metabolic syndrome, which is largely due to its immune response potential and lower number of insulin receptors(34). The incorporation of both EPA and DHA in this tissue was highly significant, resulting in a pro-portional increase in the deposition ratio. This is probably the result of the ability of adipose tissue to accumulate dietary fatty acids in cell membranes and cytosolic lipid droplets, given its nature as an energy storage organ(35).
The fatty acid composition of the brain was less affected by the dietary treatments when compared with that of other tissues. This finding has previously been reported in rats administered DHA(36,37). In fact, Suzuki et al.(38) suggested that DHA intake increases per se the DHA content in brain membranes more rapidly than the intake of associated pre-cursors in rats fed a low-n-3 LC-PUFA diet. In the present study, EPA and DHA contents were increased by the graded levels of canned sardines, although the small magnitude of the increment reveals that the fatty acid composition of the brain is tightly regulated and probably more selective towards DHA uptake from the bloodstream. It is important to note that, even without sardine supplementation, the brain had the highest DHA content among all the tissues studied. The accumulation of DHA in the brain is in line with the results reported by Barcelo´-Coblijn et al.(39)and Rapoport et al.(40).
Interestingly, EPA and DHA had distinct deposition ratios in the various tissues studied, suggesting unequal metabolic regulation. The lower deposition ratios of EPA may reflect a
different degree of depletion of this fatty acid in all the tissues. The 22 % (w/w) dosage of canned sardines was able to increase EPA deposition in the muscle, retroperitoneal adipose tissue and brain. Conversely, DHA deposition was not enhanced by the LS and HS diets, except in the retroperitoneal adipose tissue. This is probably the consequence of dividing the tissue content by a higher value of sardine incorporation in the diet. The same trend was observed in the liver and muscle. Notwithstanding this, DHA had the highest deposition ratio in both the muscle and liver compared with EPA, regard-less of the dietary treatment. This is probably due to the long-est acyl chain length and the highlong-est degree of unsaturation of DHA, which together could lead to stereoisomeric difficulties and, consequently, to b-oxidation resistance(41). Alternatively, it may also be the result of a higher specificity of fatty acyl transferase for this fatty acid(41).
Conclusions
The present study reports as novel findings the different responses of the fatty acid metabolism in different tissues to two different dosages of canned sardines. After a 10-week period of 11 and 22 % (w/w) of canned sardine supplemen-tation in Wistar rats, each tissue had a specific fatty acid com-position reflecting different EPA and DHA decom-position ratios, and all these ratios were distinct from that of erythrocytes. The fatty acid composition was influenced in a dose-depen-dent manner by n-3 LC-PUFA and the profiles were tissue specific. The brain seemed to be the most conservative and the least responsive organ, while the adipose tissue was the most sensitive to EPA and DHA dietary intake.
At the systemic level, the consumption of the 11 % (w/w) canned sardine diet improved blood lipid and lipoprotein profiles and adiponectin concentrations, suggesting that this dietary approach may be a cost-effective and feasible option for the primary prevention of CVD. In addition, the higher dosage of canned sardines (22 % (w/w) in the diet), which mimics a secondary prevention approach for CVD, resulted in a higher omega-3 index value. Besides the unexpected increase in plasma IL-1b concentrations observed in rats fed the HS diet, the absence of an association of IL-1b with other pro-inflammatory biomarkers, insulin resistance, and liver and renal dysfunctions is a finding that deserves further pathophysiological understanding.
Acknowledgements
The authors thank Clı´nica Me´dica e Diagno´stico Dr Joaquim Chaves (Alge´s, Portugal) and Arium – Sistemas de Diag-no´stico, Lda (Lisbon, Portugal) for technical assistance and support regarding plasma metabolite determination.
The present study was supported by Fundac¸a˜o para a Cieˆncia e a Tecnologia (FCT) through the grant PTDC-SAU/ OSM/2006/70560 (principal investigator: P. O. R). S. V. M. is the recipient of a FCT individual fellowship SFRH/BPD/ 2009/63019 and P. A. L. is a researcher involved in the FCT programme ‘Cieˆncia 2008’. a a A B a a A B b a A B b a B A b a A B 0·0 0·5 1·0 1·5 2·0 2·5 3·0 3·5
Erythrocytes Liver Muscle Adipose tissue Brain
Deposition ratio
Fig. 2. Deposition ratios of EPA and DHA in the erythrocytes, liver, longissi-mus dorsi longissi-muscle, retroperitoneal adipose tissue and brain of Wistar rats fed graded levels of canned sardines: low sardine (LS, 11 % (w/w) in the diet) and high sardine (HS, 22 % (w/w) in the diet). Values are means, with their standard errors represented by vertical bars.a,bFor EPA, mean values with unlike letters were significantly different between the LS and HS groups (P, 0·05; Tukey’s post hoc test).A,BFor DHA, mean values with unlike letters were significantly different between the LS and HS groups (P, 0·05; Tukey’s post hoc test). , EPA – LS group; , EPA – HS group; , DHA – LS group; , DHA – HS group.
British
Journal
of
The authors’ contributions are as follows: S. V. M., P. A. L. and C. M. A. conducted the animal experiment; S. V. M., P. A. L., C. R., S. M., R. M. A. P. and P. B. conducted the labora-tory work; S. V. M., P. A. L., P. O. R. and N. M. B. prepared the manuscript; P. O. R., I. B., N. M. B. and J. A. M. P. were respon-sible for the experimental design, interpretation of the results and final version of the manuscript. All authors read and approved the findings of the study.
None of the authors has any conflicts of interest to declare.
References
1. Muhlhausler BS & Ailhaud GP (2013) Omega-6 poly-unsaturated fatty acids and the early origins of obesity. Curr Opin Endocrinol Diabetes Obes 20, 56 – 61.
2. Wang C, Harris WS, Chung M, et al. (2006) n-3 Fatty acids from fish or fish-oil supplements, but not a-linolenic acid, benefit cardiovascular disease outcomes in primary- and secondary-prevention studies: a systematic review. Am J Clin Nutr 84, 5 – 17.
3. Calder PC (2004) n-3 Fatty acids and cardiovascular disease: evidence explained and mechanisms explored. Clin Sci 107, 1 – 11.
4. Calder PC, Ahluwalia N, Brouns F, et al. (2011) Dietary fac-tors and low-grade inflammation in relation to overweight and obesity. Br J Nutr 106, Suppl. 3, S5 – S78.
5. Schmitz G & Ecker J (2008) The opposing effects of n-3 and n-6 fatty acids. Prog Lipid Res 47, 147 – 155.
6. Robinson K, Prins J & Venkatesh B (2011) Clinical review: adiponectin biology and its role in inflammation and critical illness. Crit Care 15, 221 – 229.
7. Chen SJ, Yen CH, Huang YC, et al. (2012) Relationships between inflammation, adiponectin, and oxidative stress in metabolic syndrome. PLOS ONE 7, e45693.
8. Lin Z, Tian H, Lam KSL, et al. (2013) Adiponectin mediates the metabolic effects of FGF21 on glucose homeostasis and insulin sensitivity in mice. Cell Metab 17, 779 – 789. 9. INE (2013) Estatı´sticas da Pesca 2012, pp. 133. Lisbon,
Portugal: Instituto Nacional de Estatı´stica, I.P.
10. Bandarra NM, Batista I, Nunes ML, et al. (1997) Seasonal changes in lipid composition of sardine Sardina pilchardus. J Food Sci 62, 40 – 43.
11. Usydus Z, Szlinder-Richert J, Polak-Juszczak L, et al. (2008) Food of marine origin: between benefits and potential risks. Part I. Canned fish on the Polish market. Food Chem 111, 556 – 563.
12. Komprda T (2012) Eicosapentaenoic and docosahexaenoic acids as inflammation-modulating and lipid homeostasis influencing nutraceuticals: a review. J Funct Foods 4, 25 – 38. 13. Kris-Etherton PM, Harris WS & Appel LJ (2002) Fish con-sumption, fish oil, omega-3 fatty acids, and cardiovascular disease. Circulation 106, 2747 – 2757.
14. AOAC (1995) Official Methods of Analysis, 16th ed. Washington, DC: Association of Official Analytical Chemists. 15. Bandarra NM, Batista I, Nunes ML, et al. (2001) Seasonal variation in the chemical composition of horse-mackerel (Trachurus trachurus). Eur Food Res Technol 212, 535 – 539. 16. Friedewald WT, Levy RI & Fredrickson DS (1972) Estimation of the concentration of low-density lipoprotein cholesterol in plasma, without use of the preparative ultracentrifuge. Clin Chem 18, 499 – 502.
17. Covaci A, Voorspoels S, Thomsen C, et al. (2006) Evaluation of total lipids using enzymatic methods for the normalization
of persistent organic pollutant levels in serum. Sci Total Environ 366, 361 – 366.
18. Matthews DR, Hosker JP, Rudenski AS, et al. (1985) Homeo-stasis model assessment: insulin resistance and b-cell func-tion from fasting plasma glucose and insulin concentrafunc-tions in man. Diabetologia 28, 412 – 419.
19. Christie WW (editor) (1989) Preparation of methyl ester and other derivatives. In Gas Chromatography and Lipids – A Practical Guide, 1st ed., pp. 64 – 84. New York, NY: Pergamon Press.
20. Berge G, Ruyter B & Asgard T (2004) Conjugated linoleic acid in diets for juvenile Atlantic salmon (Salmo salar); effects on fish performance, proximate composition, fatty acid and mineral content. Aquaculture 237, 365 – 380. 21. Kim HJ, Takahashi M & Ezaki O (1999) Fish oil feeding
decreases mature sterol regulatory element-binding protein 1 (SREBP-1) by down-regulation of SREBP-1c mRNA in mouse liver. A possible mechanism for down-regulation of lipogenic enzyme mRNAs. J Biol Chem 274, 25892 – 25898. 22. Roach PD, Kambouris AM, Trimble RP, et al. (1987) The
effects of dietary fish oil on hepatic high density and low density lipoprotein receptor activities in the rat. FEBS Lett 222, 159 – 162.
23. Ikeda I, Kumamaru J, Nakatani N, et al. (2001) Reduced hepatic triglyceride secretion in rats fed docosahexaenoic acid-rich fish oil suppresses postprandial hypertriglyceride-mia. J Nutr 131, 1159 – 1164.
24. Shearer GC, Savinova OV & Harris WS (2012) Fish oil – how does it reduce plasma triglycerides? Biochim Biophys Acta 1821, 843 – 851.
25. Qiao L, Zou C, van der Westhuyzen DR, et al. (2008) Adipo-nectin reduces plasma triglyceride by increasing VLDL triglyceride catabolism. Diabetes 57, 1824 – 1833.
26. Neschen S, Morino K, Rossbacher JC, et al. (2006) Fish oil regulates adiponectin secretion by a peroxisome proliferator-activated receptor-gamma-dependent mecha-nism in mice. Diabetes 55, 924 – 928.
27. Tschritter O, Fritsche A, Thamer C, et al. (2003) Plasma adiponectin concentrations predict insulin sensitivity of both glucose and lipid metabolism. Diabetes 52, 239 – 243. 28. Berg AH & Scherer PE (2005) Adipose tissue, inflammation,
and cardiovascular disease. Circ Res 96, 939 – 949.
29. Kaneko JJ, Harvey JW and Bruss ML (editors) (1997) Clinical Biochemistry of Domestic Animals, 5th ed., pp. 895 – 900. San Diego, CA: Academic Press.
30. Simopoulos AP (2002) Omega-3 fatty acids in inflammation and autoimmune diseases. J Am Coll Nutr 21, 495 – 505. 31. Snodgrass RG, Huang S, Choi I-W, et al. (2013)
Inflamma-some-mediated secretion of IL-1b in human monocytes through TLR2 activation; modulation by dietary fatty acids. J Immunol 191, 4337 – 4347.
32. Shirazi MM, Taleban FA, Abadi AR, et al. (2011) Fish oil increases atherosclerosis and hepatic steatosis, although decreases serum cholesterol in Wistar rat. J Res Med Sci 16, 583 – 590.
33. Harris WS & von Schacky C (2004) The Omega-3 Index: a new risk factor for death from coronary heart disease? Prev Med 39, 212 – 220.
34. Capurso C & Capurso A (2012) From excess adiposity to insulin resistance: the role of free fatty acids. Vascul Pharmacol 57, 91 – 97.
35. Barcelo´-Coblijn G, Collison LW, Jolly CA, et al. (2005) Dietary a-linolenic acid increases brain but not heart and liver docosahexaenoic acid levels. Lipids 40, 787 – 798. 36. Taniguchi H, Suzuki K, Takita T, et al. (1993) Comparative
effects of eicosapentaenoic acid and docosahexaenoic acid
British
Journal
of
on n-6 and n-3 fatty acid profiles of phospholipid classes in several tissues of rats fed a hypertriglyceridemic diet. J Clin Biochem Nutr 14, 151 – 162.
37. Saito M, Ueno M, Kubo K, et al. (1998) Dose – response effect of dietary docosahexaenoic acid on fatty acid profiles of serum and tissue lipids in rats. J Agric Food Chem 46, 184 – 193.
38. Suzuki H, Manabe S, Wada O, et al. (1997) Rapid incorpor-ation of docosahexaenoic acid from dietary sources into brain microsomal, synaptosomal and mitochondrial mem-branes in adult mice. Int J Vitam Nutr Res 67, 272 – 278.
39. Barcelo´-Coblijn G & Murphy EJ (2009) Alpha-linolenic acid and its conversion to longer chain n-3 fatty acids: benefits for human health and a role in maintaining tissue n-3 fatty acid levels. Prog Lipid Res 48, 355 – 374.
40. Rapoport SI, Chang MCJ & Spector AA (2001) Delivery and turnover of plasma-derived essential PUFAs in mammalian brain. J Lipid Res 42, 678 – 685.
41. Bandarra NM, Rema P, Batista I, et al. (2011) Effects of dietary n-3:n-6 ratio on lipid metabolism of gilthead seab-ream (Sparus aurata). Eur J Lipid Sci Technol 113, 1332 – 1341.