Exploring passive innovation resistance in products developed through
co-creation strategy.
Madalena Batalha Reis
Dissertation written under the supervision of Cláudia Costa
Dissertation submitted in partial fulfillment of requirements for the degree of International MSc in Business Administration, at Católica-Lisbon School of Business and Economics.
TITLE PAGE
Title
Exploring passive innovation resistance in products developed through co-creation strategy.Student name
Madalena Mendes Gouveia Batalha ReisStudent No.
152113183Supervisor
Cláudia CostaInstitute
Universidade Católica PortuguesaFaculty
Católica-Lisbon School of Business and EconomicsDegree
International Master in Business AdministrationABSTRACT
Firms often overlook and neglect the importance of consumer innovation resistance, which leads to bad investments and failure of otherwise value capturing products. This dissertation aims to identify the role of passive innovation resistance when applied to a product developed through a co-creation model. Past literature has suggested an exploration into the extent passive innovation resistance plays in consumers’ perceptions of innovation-specific products. Based on a sample of 243 respondents this study complements the current literature by providing empirical results and testing the existing theory. Overall our results show that in the context of co-created products there is a significant resistance to adopt by passive innovation resistant segments. Our findings come complement the existing literature and show that cognitive rigidity is the most significant factor when dealing with co-created products.
SUMÁRIO
As empresas muitas vezes negligenciam a importância da resistência a inovação por parte dos consumidores, algo que pode levar a más decisões em termos de investimentos e o insucesso de produtos de valor acrescentado. Este estudo tem como objetivo identificar o papel da resistência a inovação passiva aquando aplicada a produtos desenvolvidos num modelo de cocriação. A existente literatura sugere uma exploração à relevância que a resistência a inovação passiva toma nas perceções dos consumidores em produtos específicos de inovação. Tendo por base uma amostra de 243 participantes, este estudo complementa a existente literatura ao proporcionar resultados empíricos e testar a teoria presente. Em suma, os resultados mostram que num contexto de cocriação, existe uma resistência significativa à sua adoção por parte dos segmentos passivamente resistentes a inovação. Os resultados obtidos vêm complementar a literatura existente e mostram que a rigidez cognitiva é o fator mais significativo aquando a lidar com produtos provenientes de um modelo de cocriação.
ACKNOWLEDGEMENTS
Innovation has been an incredibly fascinating and multi-faceted study field for me. In addition, as an Erasmus student in the University of Nottingham I learned about the ins and outs of consumer behavior and became very interested in the diverse psychological perspectives of how consumers think and behave. Combining my fascination for novelties and consumer behavior made me end up developing a thesis dealing with the consumers’ resistance to innovations, particularly open innovations. Even though it took me more time than I initially expected I thoroughly enjoyed writing this thesis.
Like every student who writes a thesis I have many people to thoroughly thank. First to my supervisor Cláudia Costa, who introduced me to academic research and had an incredible patience and understanding of my situation, was always available for anything I might need and gave invaluable advice, critical evaluation and guidance.
Secondly there are a lot of people I am indebted to, everyone who helped improve, distribute and respond my survey, with a special thanks to my friends and family for their unconditional support and patience throughout, without them this would not have been possible.
Finally, I want to express my sincerest gratitude to the person who had to endure me and this process the most. Like no other you know the frustrations that I sometimes had when working on my thesis. Without your willingness to hear all my complaints, your support, and your patience, I simply would not have reached this stage.
LIST OF CONTENTS
TITLE PAGE 2 ABSTRACT 3 SUMÁRIO 4 ACKNOWLEDGEMENTS 5 LIST OF CONTENTS 6 LIST OF FIGURES 8 LIST OF TABLES 8 1. INTRODUCTION 91.1 - CONTEXT & BACKGROUND 9
1.2 - PROBLEM STATEMENT 12
1.3 - RESEARCH QUESTIONS 13
1.4 – RELEVANCE 13
2. LITERATURE REVIEW 15
2.1 – CO-CREATION AS A NEW BUSINESS PARADIGM 15
2.2- CO-CREATION PERCEPTION AND RESISTANCE 17
2.3 - AIR - ACTIVE INNOVATION RESISTANCE 19
2.4 - PIR - PASSIVE INNOVATION RESISTANCE 20
2.4.1 - IRC - INCLINATION TO RESIST CHANGE 22
2.4.2 - SQS - STATUS QUO SATISFACTION 24
2.5 - COGNITIVE AND SITUATIONAL PASSIVE RESISTANCE 25
3. RESEARCH METHODOLOGY 29 3.1 – RESEARCH STRATEGY 29 3.1.1 – METHODOLOGY 29 3.1.2 – SAMPLE 29 3.2 - PROCEDURES 30 3.3 - MEASURES 30 3.3 – DATA PROFILE 32 4. RESULTS 33
4.1 - IDENTIFICATION AND DESCRIPTION OF SEGMENTS 33
4.1.1 - SEGMENT DESCRIPTIONS 36
4.2 - RQ1 - WHAT ARE THE CONSUMER SEGMENTS THAT ARE PASSIVELY RESISTANT TO
CO-CREATED PRODUCTS? 37
4.3 - RQ2 - DO THE DIFFERENT TYPES OF PASSIVE INNOVATION RESISTANCE AFFECT THE
PERCEPTION OF A PRODUCT DEVELOPED THROUGH A CO-CREATION MODEL? 40 4.4 - RQ3 - HOW CAN THIS KNOWLEDGE BE USED IN THE DESIGN OF STRATEGIES AIMING TO
PROMOTE CO-CREATED PRODUCTS? 46
5.1 CONCLUSION 50
5.2 - MANAGERIAL IMPLICATIONS 52
5.3 – LIMITATIONS & FUTURE RESEARCH 53
6. ANNEX 55
ANNEX 1 - H1, H2 & H3 – INTENTION TO ADOPT 55
ANNEX 2 - H5 – QUALITY OF PRODUCTION METHOD 56
ANNEX 3 - H6 – OVERALL PRODUCT EVALUATION 57
ANNEX 4 - H7 – ATTRACTIVENESS 58
ANNEX 5 - H8 – COMPANY BENEFIT 59
ANNEX 6 – SAMPLE DEMOGRAPHICS 60
LIST OF FIGURES
Figure 1 - Sources of Passive Innovation Resistance (Talke and Heidenreich, 2014) ... 21
Figure 2 - Types of Passive Innovation Resistance (Talke and Heidenreich, 2014) ... 25
Figure 3 - Mean Graph Intention to Adopt ... 38
Figure 4 – Mean Graph QEPM ... 41
Figure 5 – Mean Graph OPE ... 43
Figure 6 – Mean Graph Attractiveness ... 45
Figure 7 – Means Graph Benefit ... 47
LIST OF TABLES
Table 1 - Measurement model for passive innovation resistance _____________________________________ 31 Table 2 - Measurement model for co-creation evaluation and adoption _____________________________ 32 Table 3 - KMO and Bartlett's Test ______________________________________________________________________ 33 Table 4 - Total Variance Explained _____________________________________________________________________ 33 Table 5 - Component Matrix ____________________________________________________________________________ 34 Table 6 - Final Cluster Centers __________________________________________________________________________ 35 Table 7 - Segments composition factors loading _______________________________________________________ 36 Table 8 – Descriptives Intention to Adopt ______________________________________________________________ 37 Table 9 – Levene’s Test Intention to Adopt _____________________________________________________________ 37 Table 10 - ANOVA Intention to Adopt __________________________________________________________________ 38 Table 11 – Welch and Brown-Forsythe Intention to Adopt ____________________________________________ 38 Table 12 – Descriptives QEPM __________________________________________________________________________ 40 Table 13 – Levene’s Test QEPM _________________________________________________________________________ 40 Table 14 – ANOVA QEPM _______________________________________________________________________________ 41 Table 15 – Welch and Brown Forsythe QEPM__________________________________________________________ 41 Table 16 – Descriptives OPE ____________________________________________________________________________ 42 Table 17 – Levene’s Test OPE ___________________________________________________________________________ 42 Table 18 - ANOVA OPE __________________________________________________________________________________ 43 Table 19 – Welch and Forsythe OPE ____________________________________________________________________ 43 Table 20 – Descriptives Attractiveness _________________________________________________________________ 44 Table 21 – Levene’s Test Attractiveness ________________________________________________________________ 44 Table 22 – ANOVA Attractiveness ______________________________________________________________________ 45 Table 23 – Welch and Forsythe Attractiveness ________________________________________________________ 45 Table 24 – Descriptives Benefit _________________________________________________________________________ 46 Table 25 – Levene’s Test Benefit ________________________________________________________________________ 46 Table 26 – ANOVA Benefit ______________________________________________________________________________ 47 Table 27 – Welch and Forsythe Benefit ________________________________________________________________ 47
1. INTRODUCTION
“New product success and failure is often decided before the new product project even enters the product development phase.” (Cooper, 1988)
1.1 - Context & Background
Human beings are not completely rational creatures (Kahneman & Tversky, 1979). Often individuals make decisions that do not maximize value and are against rational reasons. There are several human biases identified in literature, for example, in order to give up the possession of an object already owned, people demand more than what would be spent to newly buy the same object (Kahneman et al., 1990). The goal of this study is to understand how human irrationality affects new product adoption.
Introducing new products allows companies to achieve competing leading positions, and provide new companies with an opportunity to position themselves in the market (Danneels and Kleinschmidt 2001). Nevertheless, even though new products are essential for firms to survive, innovations have a price, which is usually translated in a high risk. This makes it that many new products actually fail in the market for numerous reasons, one of the most prominent has been identified as being consumer resistance (e.g. Ram 1987, Ram & Sheth 1989, Sheth 1981).
In order to understand success and market failure of new products, researchers have performed a considerable amount of investigation in the topics of open innovation and co-creation. The concept of co-creation was made popular in the early 00s by Prahalad and Ramaswamy who defined co-creation as the “joint creation of value by the company and the customer” (Prahalad and Ramaswamy 2004, P.9).
This new paradigm of innovation has been embraced by several companies, (ex. Coca-Cola, Threadless, LEGO, DHL) recent research has shown a correlation between firms who successfully build connections with consumers to develop new products(Hull, 2004; Prahalad and Ramaswamy, 2000). Benefits range from increased market share (Joshi and Sharma, 2004), inferior costs and risks (Ogawa and Piller, 2006), increased profitability (Lau et al, 2010) and enhanced fit of product–customer needs (Alam and Perry, 2002). Several companies are now offering online platforms for consumers to co-create (ex. Nike, BMW, Mymuesli). On one hand open innovation gives companies access to a type of knowledge only acquired by experience that only consumers possess (Schreier et al., 2007; Schreier and Prügl, 2008), and on the other hand, it provides the consumers the satisfaction of their needs (Meuter et al, 2000). Enkel et al. (2009) have recognized three main core processes of open innovation: (1) outside-in, where an outsider to the firm is brought in to provide knowledge and resources (eg. crowdsourcing); (2) inside-out, where the company shares their knowledge with outsiders (eg. licensing); and (3) coupled, where there is co-creation between partners (eg. cooperation, joint venture). The implementation of co-creation models depends on many factors, and one of the most recognized is the diffusion of innovation.
The topic of diffusion has been pushed forward by several researchers particularly on the sector of high tech firms with short technology cycles (Cooper and Zmud, 1990; Williams et al., 2009; Zhu et al, 2006a; Zhu et al. 2006b). Understanding the diffusion of the innovation process is of extreme importance in order to understand why consumers adopt (or not) products more quickly, and as such, guarantee market success. To this end what drives consumers to resist the adoption of innovation is also a relevant managerial and academic question. Most innovations fail in the diffusion or adoption phase (Dewett, Whittier and Williams, 2007) but despite the substantial interest in co-creation, limited consideration has been expressed concerning the organizational challenges in implementing it, and why it would be met by resistance. Research has focused on the personality traits to identify innovators (Midgley, 1977; Horton, 1979; Foxall, 1989a, b; Goldsmith,
1968; Mudd, 1990) and while it is understandable, the study of why people resist innovation is perhaps just as important. E.g Ram and Sheth (1989, p.6):
"[i]nnovation resistance is the resistance offered by consumers to an innovation, either because it poses potential changes from a satisfactory status quo or because it conflicts with their belief structure."
Consumer resistance to innovation has been acknowledged by both scientific (Ellen, Bearden and Sharma, 1991; Heidenreich and Handrich, 2014; Laukkanen, Sinkkonen and Laukkanen, 2008; Patsiotis, Hughes and Webber, 2013; Sheth, 1981) and managerial research (Garcia, Bardhi and Friedrich, 2007; Gourville, 2006). Resistance to innovation can be considered as a more specific form of individuals’ overall resistance to change (Oreg 2003). There is also a conceptual distinction between active and passive innovation resistance. The difference lies on the degree a consumer participates cognitively in the adoption decision process (Nabih and Bloem 1997; Rogers 2003). Prior research acknowledges the responsibility of passive innovation resistance as a significant obstruction to the adoption of innovation (Oreg, 2003; Kleijnen et al., 2009; Saaksjarvi and Morel, 2010). However, empirical evidence on how and if different forms of passive resistance (i.e., cognitive and situational passive resistance) affect innovation adoption is still missing. The existent literature refers to a "pro-change" bias that is occurring in the research, signifying that there is a biased assumption in the literature that people are usually open to change and to new product adoption (e.g. Talke and Heindenreich, 2014). In order to overcome this bias it has been recently suggested that this subject should be further researched. (Talke and Heindenreich, 2014)
“The typical human tendency is to strive for consistency and status quo rather than to continuously search for, and embrace new behaviors” (Sheth, 1981, p. 275). Since co-creation has combined product development with customer experience by incorporating consumers in the process (Prahlad, 2004), and customer experience is the combination of all the interactions with a company and its products or services (Meyer, 2007), a product developed through a co-creation
model is a new paradigm in innovation, a new way to create products that is new and strange for consumers and recognizably a change for the consumer in his experience with that company's previous products. “An innovation, which is perceived as new or different, always imposes change to the individual, endangers the actual status quo, and is thus likely to provoke initial resistance” (Heidenreich and Spieth, 2013, p.4)
Furthermore, Thompson & Malaviya (2013) found that attributing credit to a consumer for creating and ad actually hindered persuasion and decreased brand evaluation, as well as discovered that disclosing a consumer source caused skepticism about the ad creators abilities. This study shows that there are conditions in with consumers resist user co-creation.
This way the aim of this thesis is to develop a better understanding of how passive resistance affects co-creation, since this new paradigm is observably a change in the consumers’ experience with the company. We want to study how already passive innovation resistant people react when faced with a co-created product. As well as identifying which are the resistant consumer segments and their perception of co-created products. Understanding resistance allows managers to improve design and implement open innovation and co-creation strategies so they result in a better product targeting and positioning.
1.2 - Problem Statement
Previous academic studies highlight that innovation managers need to give more importance to consumers who resist innovation since resistant consumers are the majority of the market (Heidenreich and Handrich, 2014). Recent studies on "how firms can improve new product development processes and company strategies in order to improve their innovation performance to overcome consumer resistance towards innovation" (Antioco and Kleijnen 2010, p.1701), revealed that the value, risk and image barrier of products considered having a high level of
following study focuses on a similar question. Passive innovation resistant individuals demonstrate a resistance towards uncertainty and change, if a product is co-created, would those individuals be more likely to resist it and not adopt it? Therefore, the problem statement of this study is to show the differential effects of co-creation on consumers' perceptions of quality and overall product evaluation as well as intention to adopt and attractiveness from the viewpoint of different passive resistant consumer segments.
1.3 - Research Questions
In order to achieve the general aim mentioned above, we sought answers to the following:
1. What are the consumer segments that are passively resistant to co-created products?
2. Do the different types of passive innovation resistance affect the perception of a product developed through a co-creation model?
3. How can this knowledge be used in the design of strategies aiming to promote co-created products?
1.4 – Relevance
We need a better understanding of the extent to which passive consumer resistance affects business decisions when implementing a co-creation model. A deeper understanding of which are the resistant consumer segments and their perception of co-creation is of critical importance for companies aiming to improve co-creation. This will assist companies in their marketing and innovation strategies to overcome consumer resistance (Antioco and Kleijnen, 2010)
“(…) it is about time we paid respect to individuals who resist change, understand their psychology of resistance and utilise this knowledge in the development and promotion of innovations rather than thrust upon them preconceived innovations’ (Sheth, 1981, p.281).”
2. LITERATURE REVIEW
This chapter analyzes the literature in the topic used to develop the present thesis.
2.1 – Co-creation as a new business paradigm
Modern consumers scrutinize and compare companies’ new products, their behavior in the market, and firmly check if the company upholds its promises (Holt, 2002). This new examination and monitoring by consumers was made possible by the internet, a new interactive platform where users can search for new pieces of information, can share their own opinions and criticize (van Dijk, Antonides and Schillewaert, 2014). Traditionally companies developed new products internally through Research and Development departments specialized in data analytics and business intelligence to better understand the consumers' needs and wants. Here costumers were viewed as passive participants (Jahn and Kunz, 2012). With the introduction of Web 2.0, power was suddenly transferred, consumers started to emerge as contributors to new product development and becoming more involved with companies and their products (Constantinides and Fountain, 2008). Companies suddenly had easy and costless access to the opinions of consumers, and soon realized the potential of greater consumer involvement. The fact that it was so much easier for consumers to communicate with the companies over the internet and the increased globalization helped to significantly reduce the costs associated with developing a product with consumer involvement for companies (Chesbrough, 2003b; von Hippel and Katz, 2002).
The adoption of a successful open innovation and co-creation strategy means incorporation of new sources of expertise and knowledge outside the companies' borders, reduced time to market, decreased development costs, and new insights and market knowledge (Gassmann and Enkel, 2004; Wallin and Von Krogh, 2010).
Companies such as IBM, Intel, Xerox (Chesbrough 2003), Procter and Gamble, Philips, Siemens (Enkel et al 2009) and Lego (Antorini et al 2012) all have successfully developed open innovation and co-creation strategies alongside their traditional innovation approaches.
The two concepts of open innovation and co-creation are closely related, the scientific community has yet to agree to a single definition of open innovation, due to its a complexity and broad field of application. Probably the most consensual definition has been the usage of inflows and outflows of information and expertise in order to hasten the internal innovation and multiply the markets for outsider usage of innovation respectively (Chesbrough et al., 2006). However, this study focuses on user co-creation. Co-creation can be defined as the “joint creation of value by the company and the customer” (Prahalad and Ramaswamy 2004, p.9), or as the collaborative processes between consumers and professionals in new product development (NPD) (Hoyer et al., 2010). Co-creation allows consumers to take an active role as contributors in the new product development process.
Von Hippel (1986) identified “lead users”, the first consumers, as innovators. Lead users are individuals who identify needs not covered by current products available in the market. Moreover, such individuals profit from the solution and are therefore prone to become innovators. Lead users are ahead of the rest of the market and expected to set the market trends by searching how to satisfy the needs they have encountered. The reason why lead users are able to innovate in order to satisfy the needs is related to the knowledge acquired through experience, (Schreier et al., 2007; Schreier and Prügl, 2008) which is incredibly difficult and costly for companies to acquire but intrinsic to users (Popadiuk and Choo, 2006).
2.2- Co-creation perception and resistance
" innovations mean change to consumers, and resistance to change is a normal consumer response that has to be overcome before adoption may begin" (Laukkanen et al., 2007, p.420). When comparing products which are developed entirely by internal input, products developed in a co-creation model are better perceived by consumers, which results in a higher willingness to purchase, to pay and recommend (Schreier et al 2012). Some authors have stated that when a product is labeled as co-created the consumer's perception of the company's innovation capability increases (Schreier et al 2012).
Research has also identified some drawbacks to co-creation. This process increases the probability of disappointment in the final product since the consumers are investing their time and sharing knowledge with the company the expectations for the final product's quality are higher (Childers et al. 2001) and high expectations lead to customer dissatisfaction (Cardozo, 1965). As previously stated disclosing that a product was co-created can actually hinder persuasion, decrease brand evaluation, cause skepticism on the producer’s abilities and lead to resistance (Thompson & Malaviya, 2013).
A line of literature argues that co-created products' perception is sometimes negative and there are several influencers. Product complexity can be seen as a mediator of consumer perception, since when analyzing low complexity products (ex. clothing, household products) the perceptions are positive, as opposed to high complexity products (ex. electronics, cars) the innovation perception and purchase intend is much lower since consumers recognize expert knowledge in firms and not in consumers (Schreier et al 2012). Consumers attribute professional-made products better quality due to their training and experience, something consumers lack (Dahl and Moreau, 2007). Also, negative emotions may arise from uncertainty of dealing with a co-created product, since increasing customer participation reduces the control the firm has over the product (Plé and Cáceres, 2010; Zhuang, 2010).
A product developed through a co-creation model is recognizably a change for the consumer in his experience with company's previous products. The consumer has built a perception of the products and company from his experience with a traditional model of production, when the same company develops a co-created product, the perception of the consumer, whether it be positive (ex. innovativeness) or negative (ex. lower quality) will change, constituting a change in the consumers experience with that same company. Moreau and Herd (2010, p. 807) state that “professionals often have a significant advantage, either real or perceived, over consumers, in terms of their knowledge, training, and experience.” This can lead consumers to a negative attitude towards the new product leading to a non-adoption behavior. Innovation resistance is a phenomenon that can happen either before or after the new product evaluation (Talke and Heidenreich, 2014).
Furthermore, past literature has identified another perspective on adoption and resistance behavior. Consumers who have been the most committed to a specific brand may actually be the ones to resist the strongest to changes in the brand, while the less committed users might be the ones to show more tolerance to change (Walsh and Lipinski, 2008).
The degree to which a person is reasonably faster at adopting innovations when compared to the rest of the social system members is described as innovativeness. Consumers are characterized in five profiles relative to their degree of innovativeness: (1) innovators, (2) early adopters, (3) early majority, (4) late majority, and (5) laggards (Rogers, 1995). Just like innovativeness, laggardism may be considered as a global resistance to new products (Oreg, 2003).
Estimates on recent studies show that the rate to which innovations fail is approximately 40-50% (Castellion & Markham, 2013). A fundamental reason for the slow dissemination and failure of adoption of innovative products is a certain degree of consumer resistance. Resistance to innovation is a more specific form of resistance to change (Oreg 2003).
Prior research distinguishes between active and passive resistance (Bagozzi and Lee 1999; Kleijnen et al. 2009; Ram 1987; Ram and Sheth 1989). The difference lies on the level of consumer’s cognitive participation in the adoption decision process (Nabih and Bloem 1997; Rogers 2003). Both types occur before product adoption. Active innovation resistance occurs after an individual has analyzed consciously the product and its specifications and has actively decided not to adopt such product. Passive innovation resistance occurs when a individual is unconsciously resistant to change, and therefore resists an innovation prior to any analysis on its specifications (Engel et al., 1993; Talke and Heidenreich, 2014).
2.3 - AIR - Active Innovation Resistance
Resistance behaviors that occur after the awareness phase of the adoption-decision process are considered actively resistant. Active innovation resistance (AIR) represents an adverse attitude to innovation-specific aspects that comes from a careful evaluation of new products (Laukkanen et al., 2008; Talke and Heidenreich, 2014). It is considered a deliberate form of resistance that develops from product-specific factors. The individual's actions towards the new product derive from its evaluation of the innovation's features (Rogers, 2003). Actively resistant individuals have already evaluated the innovation and are therefore more cognitively involved, allowing them to make a more knowledgeable adoption decision. Studies show that new product-specific barriers are correlated with negative attitude formation, which can lead to the non-adoption of the innovation (Kleijnen et al., 2009; Laukkanen et al., 2008).
Active innovation resistance is manifested in three distinct categories of behavior, differing in its level of intensity: (1) rejection; (2) postponement; and (3) opposition(Szmigin & Foxall, 1998, Mirella et al., 2009)
Rejection is an intense form of active resistance where there is an active decision to not adopt a new product (Rogers, 2003). Postponement happens when the adoption of a new product is purposively delayed by the consumer. The decision to adopt the innovation is then pushed to the future (Kuisma et al., 2007).
Postponement usually results from situational factors such as, the individual not being able in the moment, or waiting for confirmation the innovation works as advertised. Postponement may result in a later decision to adopt or reject the innovative product (Szmigin & Foxall, 1998). Bagozzi and Lee (1999) consider consumers’ indecision as being a consumer who will most likely continue with information gathering and product evaluation until their perception of opportunity and/or threat are satisfied.
Opposition is the most intense active resistant behavior and a type of rejection but one in which the individual is keen on testing the new product before rejecting it. It may evoke the consumer to engage in actions to try and prevent the new product’s success with other consumers (Kleijnen et al. 2009). Opposition ranges from boycotts to negative word-of-mouth and complaints (Hirschman, 1970; Peñaloza and Price 1993). The major causes for opposition are situational factors, the individual’s own cognitive style, concern for business practices and social impacts (Herrmann, 1993; Mirella et al., 2009).
2.4 - PIR - Passive Innovation Resistance
“The typical human tendency is to strive for consistency and status quo rather than to continuously search for, and embrace new behaviors” (Sheth, 1981, p. 275)
The most common form of non-adoption is passive resistance (e.g. Sheth, 1981). Most consumers are more likely to stay contented with their status quo and pay little to no attention to innovation, than actively embrace innovation. Consumer's habits and routines are usually the cause of passive resistance, which results in not actively seeking out information on new products, technology or services (Sheth 1981, p. 275). Even so, passive resistance has met little empirical attention (Heidenreich and Handrich, 2014). Such lack of research points to a "pro-change"
bias in the existing literature on this subject on the assumption that humans are pro-change and pro-adoption of innovation.
Passive resistance develops prior to the conscious evaluation of an innovation, it is unconscious and determined by the person's inclination to resist change (IRC) and status quo satisfaction (SQS) (Heindenreich and Kraemer, 2015). It evolves from traits and personality-related inclination to resist changes and situation-specific factors that determine their status quo satisfaction (Talke and Heidenreich, 2014).
Passive innovation resistance describes non-purchase behavior that occurs prior to the deliberate evaluation of an innovation (Engel et al., 1993). The literature distinguishes two types of passive innovation resistance: cognitive passive resistance and situational passive resistance. The first tied to a person's IRC and the latter to the individual’s SQS (Heidenreich and Spieth, 2013) as Figure 1 illustrates.
Figure 1 - Sources of Passive Innovation Resistance (Talke and Heidenreich, 2014)
The literature shows that passive innovation resistance mainly results from consumers' inclination to resist change, status quo satisfaction or a combination of both (Heidenreich and Handrich, 2014). Although research is mostly focused on active innovation resistance, recent studies have developed on the implications of passive innovation resistance. Namely the impact on product evaluation (Heindenreich and Spieth, 2013), adoption (Heidenreich and Handrich, 2014), types of innovative consumer conduct (Heidenreich and Kraemer, 2015a), and how to overcome its negative impact (Heidenreich and Kraemer, 2015b).
People who display signs of passive innovation resistance, either by showing a tendency to resist change or wishing to maintain their status quo, when confronted with a product that was user co-created, a non-professional external source participated in the development of the new product, would these people be more inclined to reject the product? Saaksjarvi and Morel (2010) conclude that innovations fail because consumers might doubt that the new product will achieve its announced capacities.
Previous studies suggest that cognitive passive resistance, and situational passive resistance contrast in their impact on product adoption behavior (Heindenreich and Kraemer, 2015b; Talke and Heidenreich, 2014). It is so believed that the different combinations or levels of these two factors can classify passive innovation resistance. To further comprehend this it is first needed to understand the concept of inclination to resist change and status quo satisfaction.
2.4.1 - IRC - Inclination to Resist Change
The most noticeable description of inclination to resist change was conceptualized by Oreg (2003), and accounts for six elements: (1) reluctance to loss of control, referring to the predisposition of fear of loss of control over certain life events (Oreg, 2003); (2) cognitive rigidity, referring to a form of stubbornness and reluctance to consider alternatives (Rockeach, 1960); (3) lack of psychological resilience, describing an individual who is not as able to cope with change as a stressor (Judge et al. 1999); (4) intolerance to the adjustment period, referring to the preference to avoid short term efforts (Kanter, 1985); (5) preference for low levels of stimulation, meaning some individuals do not need much stimulation or innovation, and are therefore more unwilling to change (Goldsmith, 1984); (6) reluctance to give up old habits, describing a predisposition to resist change since the change might evoke new behaviors that are incompatible with the familiar responses therefore creating stress (Oreg, 2003). Oreg (2003) finds that individuals' inclination to resist change is the most prevailing construct when
aiming to predict change-related behavior (eg. Moldovan and Goldberg, 2004; Oreg, 2003)
When confronted with new products, people who are reluctant to lose control are challenged by a lack of confidence in their successful usage of the new elements (Mukherjee and Hoyer, 2001) which then leads to a perceived loss of control (Bagozzi and Lee, 1999). These consumers are less expected to engage in information seeking and analysis since they present high levels of cognitive rigidity, presenting an intransigent and closed-mindedness which decreases their openness to new products and opportunities (Oreg, 2003). So when confronted with a co-created product, a product that was not produced entirely by professionals of that company, but was co-created by users, would, according to the literature heighten the sense of loss of control for people who have high cognitive rigidity, and therefore lead to non-adoption.
People who have limited resilience are less willing to engage in change behavior and present lower coping skills (Wanberg and Banas, 2000). When presented with new products these individuals are less likely to seek out further knowledge and information, since changes will be perceived as a stress factor (Judge et al., 1999).
People who are intolerant to an adjustment period and prefer to avoid short term efforts may offer resistance to a new product since these demands an adaption, adjustment and learning effort (Oreg, 2003). Moreover, since new products increase stimulation, individuals who prefer low levels of stimulation are also less disposed to actively seek out innovation. The same happens with reluctance to give up old habits leading to innovation resistance.
IRC has been quite comprehensively studied in literature. Several studies have found that IRC plays a role as an inhibitor of innovative behavior, (e.g., Moldovan and Goldenberg, 2004; Oreg, 2003) and preventing favorable new product evaluations (e.g., Bagozzi and Lee, 1999; Nov and Ye, 2009). Since these characteristics determine each individual's IRC, it can be seen that this construct
is crucial to explaining and understanding passive innovation resistance and its effects.
2.4.2 - SQS - Status Quo Satisfaction
Past literature points out that status quo satisfaction is an important decision factor for individuals (Bell, 1985) and creates an irrational decision where the individual tendentiously favors the existing situation even though other options may offer a higher utility (Falk, Schepers, Hammerschimdt, and Bauer, 2007). This irrationality has been named the status quo bias (Gourville, 2006; Samuelson and Zeckhauser, 1988) referring to the tendency prefer the current situation to avoid change since the disadvantages of abandoning the present are larger than the advantages that could possible occur by leaving it.
It has been argued that a product can become a main situation-specific factor, determining the individual's status quo perception and becomes an important decision factor in the innovation decision process (Talke and Heidenreich, 2014). When posed with this decision, individuals will tendentiously prefer the previously tried, proven products, since switching to an unproven new product would possible involve larger losses. (Hess, 2009)
According to the literature, a co-created product would heighten SQS and decrease adoption intention given the fact that a product that was partly produced by a user can be perceived as less proven since it wasn’t completely made by only professionals.
This irrational attachment has been explained by the fact that people grow familiar to the products they own and consistently use (Bagozzi and Lee, 1999). In order to preserve the present situation, unconscious mechanisms are triggered that disrupt the inflow of new product information (Zaltman and Wallendorf, 1983) and since individuals are unaware of the alternatives and its possible gains, passive innovation resistance results. This effect is more prominent especially if the individual is especially satisfied with their current status quo (Hess, 2009).
Henceforth, status quo satisfaction has been considered a crucial construct when studying passive innovation resistance.
2.5 - Cognitive and Situational Passive Resistance
Based on the two previous concepts past studies have identified two types of passive innovation resistance: (1) cognitive passive resistance, and (2) situational passive resistance (Talke and Heidenreich, 2014).
Cognitive passive resistance refers to the degree to which an individual's attitudes regarding product resistance are affected by its cognitive style when faced with its adoption. Since this construct was developed in the scope of an individual's IRC it has four forces driving it, already previously defined: (1) routine seeking; (2) emotional reaction to imposed change; (3) Short-term thinking; and (4) cognitive rigidity (Heidenreich and Kraemer, 2015).
Situational passive resistance shows the degree to which an individual's attitudes regarding product resistance are affected by its preference for his or hers present status quo when faced with its adoption. Because this concept was articulated from individuals' SQS the two forces driving it are: (1) satisfaction with existing products; and (2) satisfaction with the extent of innovations;
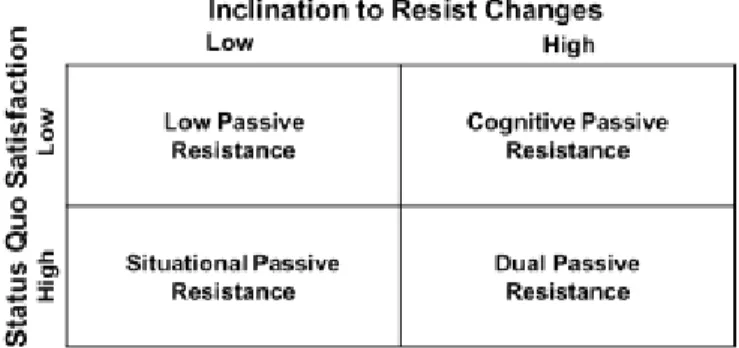
Figure 2 shows a classification of passive innovation resistance constructed by Talke and Heidenreich (2014) according to the previously discussed concepts.
As can be seen in Figure 2, Low Passive Resistance are people who show low levels of both IRC and SQS, and Dual Passive Resistance would be the opposite, meaning people who display high levels of both IRC and SQS. Adoption intention is highest with dual passive resistance and lowest with low passive resistance.
Cognitive passive resistance is mainly driven by IRC, this means that the forces driving it are (1) routine seeking; (2) emotional reaction to imposed change; (3) Short-term thinking; and (4) cognitive rigidity. As had been seen earlier, a person who has a deep fear of loss of control (someone who shows a high cognitive rigidity) would then display higher resistance to adopt a co-created product, since it was not produced entirely by professionals.
As can be seen in Talke and Heidenreich (2014) table in Figure 2, cognitive passive resistance has high IRC but low SQS meaning the adoption intention of consumers displaying cognitive passive resistance should be higher than for those with dual passive resistance but lower than consumers with low passive resistance. Given the afore mentioned classification of passive innovation resistance constructed by Talke and Heidenreich (2014) and given that Heidenreich and Handrich (2014) identified passive innovation resistance as having an impact on product adoption, we can draw the hypothesis to answer our first research question accordingly:
H1 - Adoption intention of products developed in a co-creation model will be higher
for consumers with cognitive passive resistance than a) for consumers with dual passive resistance but b) lower for consumers with low passive resistance.
Situational passive resistance is mainly driven by SQS, meaning that the forces driving it are (1) satisfaction with existing products; and (2) satisfaction with the extent of innovations. Consumers deposit their trust in companies that have proven themselves and have a reputation for innovating (Henard and Dacin, 2010), and also attribute high quality products and expertise to these companies (Keller, Parameswaran & Jacob, 2011), with the introduction of users in the production process it may damage the company’s reputation, break the trust the consumers put in it and subsequently lower the products quality perception
(Thompson & Malaviya, 2013). Also, consumers may feel uncertainty of dealing with a co-created product, since increasing customer participation decreases the control the company has over the product. (Plé and Cáceres, 2010; Zhuang, 2010).
As previously seen, a co-created product would heighten SQS and decrease adoption intention given the fact that a product that was partly produced by a user can be perceived as less proven since it wasn’t completely made by only professionals.
As can be seen in Talke and Heidenreich (2014) table in Figure 2 situational passive resistance shows a high SQS and low IRC so it should demonstrate higher values of adoption intention than consumers with dual passive resistance but lower than those with low passive resistance.
H2 - Adoption intention of products developed in a co-creation model will be higher
for consumers with situational passive resistance than a) for consumers with dual passive resistance but b) lower for consumers with low passive resistance.
Dual passive resistance presents high values for both IRC and SQS, meaning these are people who demonstrate the forces driving both IRC and SQS, these are considered to be the most resistant people since they combine high values of resistance in both spectrums. Therefore, it should show the lowest values of adoption intention when comparing to all other types of passive innovation resistance.
H3 - Adoption intention of products developed in a co-creation model, will be the
lowest for consumers with dual passive resistance, when compared with all other types of passive innovation resistance.
Low passive resistance shows low values for both IRC and SQS meaning the opposite from dual passive resistance, these are the consumers who demonstrate
the lowest values in all resistance factors. Henceforth adoption intention should be higher than all other types of passive innovation resistance.
H4 - Adoption intention of products developed in a co-creation model, will be the
highest for consumers with low passive resistance, when compared with all other types of passive innovation resistance.
Consumers attribute professional-made products better quality due to their training and experience, which are attributes that users do not have (Dahl and Moreau, 2007; Moreau and Herd, 2010), we could argue that this would lead to a negative perception of product evaluation. Past research has identified passive innovation resistance as having an influence of product evaluation (Heindenreich and Spieth, 2013), and so drawing from the different types of PIR previously mentioned, we can construct the hypothesis to answer our second research question:
H5 – Consumers’ quality perception of products developed in a co-creation model is
negative.
H6 – Consumers’ overall product evaluation of products developed in a co-creation
model is negative.
H7 – Consumers’ attractiveness of products developed in a co-creation model is
negative.
H8 – Consumers’ perception of company benefit from products developed in a
3. RESEARCH METHODOLOGY
3.1 – Research Strategy 3.1.1 – Methodology
To test the study’s hypotheses, we developed a scenario-based questionnaire that requests the participants to conceive hypothetical situations and circumstances. Given the time and budget constrictions the current study used a web survey. Prior research has determined that web surveys are more time and cost efficient, which makes online questionnaires more attractive (Evans and Mathur, 2005). Previous research shows personal interviews can provide lower quality results given the interviewer's lack of abilities and bias, and since the objective of this study is to evaluate individual innovation adoption behavior, it is preferable an unbiased and more reliable data collection method (Bronner and Ton, 2007; Deutskens et al., 2006). Therefore, given the limitations of the present research the only viable sampling method was the non-probability sampling through online surveys using the faculty provided software Qualtrics (see www.qualtrics.com).
3.1.2 – Sample
The survey was sent to the whole population without restrictions since resistance can affect everyone from every culture. The questionnaire was posted online for 10 days from May 1st to May 12th 2016. It was available through several social
media platforms such as Facebook, Twitter, Reddit and blogs.
A total of 243 respondents completed the survey. The completion rate was 81% with 301 started surveys, only the completed questionnaires were considered for further analysis. Researchers recommend a sample size of at least 200 respondents in order to achieve robustness of findings (Hogarty et al., 2005).
3.2 - Procedures
Likert-type scaling was applied. Numeric values (1 to 5 points scale) were allocated to each question in order to use the necessary parametric statistical techniques. In order to obtain access if respondents were passive innovation resistant the first part of the questionnaire consisted of questions pertaining to Inclination to Resist Change and Status Quo Satisfaction. Afterwards participants were shown a brief explanation on what consists co-creation. Finally, the last part consisted of questions on our dependent variables.
Moreover, previous research suggests that socio-demographic characteristics of each consumer might affect the adoption behavior of new products (Meuter, Bitner, Ostrom and Brown, 2005), therefore key socio-demographics were included as controls in the framework to provide a stronger assessment of the hypotheses. These were age, gender, country of origin, level of education and monthly income.
3.3 - Measures
The measures used were chosen according to the literature on our key subjects. As previously seen passive innovation resistance consists of two second-order factors, Inclination to Resist Change and Status Quo Satisfaction. The measures for IRC are: (1) routine seeking; (2) emotional reaction to imposed change; (3) short-term thinking; and (4) cognitive rigidity; these measures reveal behavioral, affective and cognitive aspects of inclination to resist change (Oreg, 2003). The measures for SQS are: (1) satisfaction with extent of innovations and (2) satisfaction with existing products.
The measures for co-creation regarding its evaluation, quality, adoption, attractiveness and benefits were also taken from the literature in order to access passive innovation resistant individual’s perceptions of co-created products. By measuring the predisposition for passive resistance we can then access the extent to which people who have this predisposition would have an intention of adopting
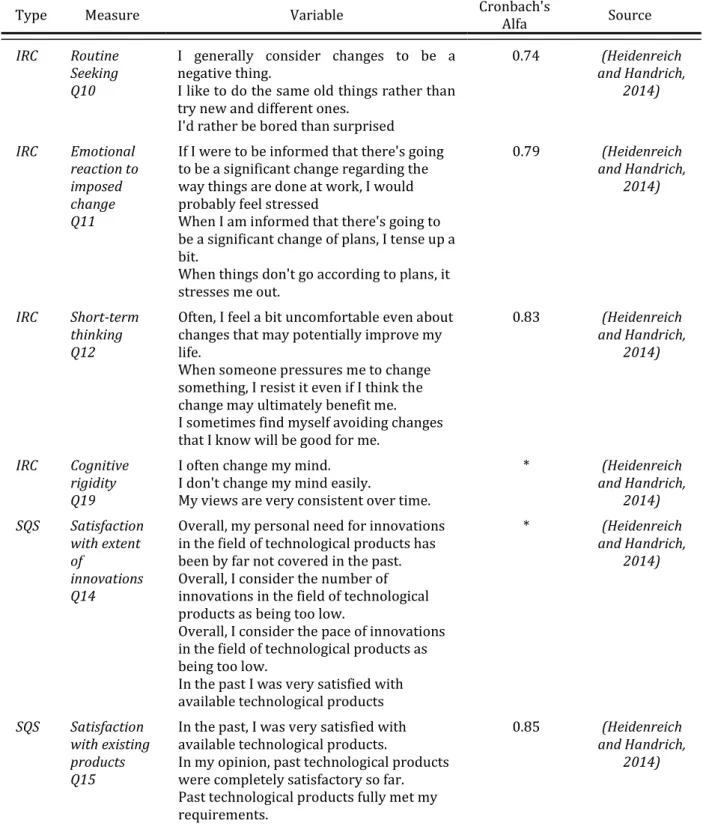
As for reliability of the measures used, all scales have a Cronbach’s alpha over 0,70, which is generally accepted by researchers (Nunnally and Bernstein, 1994). Tables 1 and 2, describe the measures used in the survey to assess our dependent and independent variables for further analysis.
Type Measure Variable Cronbach's Alfa Source
IRC Routine Seeking Q10
I generally consider changes to be a negative thing.
I like to do the same old things rather than try new and different ones.
I'd rather be bored than surprised
0.74 (Heidenreich and Handrich, 2014) IRC Emotional reaction to imposed change Q11
If I were to be informed that there's going to be a significant change regarding the way things are done at work, I would probably feel stressed
When I am informed that there's going to be a significant change of plans, I tense up a bit.
When things don't go according to plans, it stresses me out. 0.79 (Heidenreich and Handrich, 2014) IRC Short-term thinking Q12
Often, I feel a bit uncomfortable even about changes that may potentially improve my life.
When someone pressures me to change something, I resist it even if I think the change may ultimately benefit me. I sometimes find myself avoiding changes that I know will be good for me.
0.83 (Heidenreich and Handrich, 2014) IRC Cognitive rigidity Q19
I often change my mind. I don't change my mind easily.
My views are very consistent over time.
* (Heidenreich and Handrich, 2014) SQS Satisfaction with extent of innovations Q14
Overall, my personal need for innovations in the field of technological products has been by far not covered in the past. Overall, I consider the number of innovations in the field of technological products as being too low.
Overall, I consider the pace of innovations in the field of technological products as being too low.
In the past I was very satisfied with available technological products
* (Heidenreich and Handrich, 2014) SQS Satisfaction with existing products Q15
In the past, I was very satisfied with available technological products.
In my opinion, past technological products were completely satisfactory so far. Past technological products fully met my requirements.
0.85 (Heidenreich and Handrich,
2014)
Measure Variable Cronbach's Alfa Source Quality expectations of the production method Q17
The likelihood that the product would be reliable is.
The workmanship of the product would be. The likelihood that this product is dependable is.
This product quality should be.
The durability of this product would be.
0.89 (Dodds, Monroe, and Grewal, 1991) Overall Product Evaluation Q18 [1]bad ... [5]good [1]unpleasant ... [5]pleasant [1]unfavorable ... [5]favorable [1]dislike ... [5]like [1]useless ... [5]useful [1]undesirable ... [5]desirable [1]negative ... [5]positive [1]uninteresting ... [5]interesting [1]irritating ... [5]not irritating
0.97 (Bruner II, 2013)
Intention to adopt
Q20 How likely do you feel it is that you would purchase this product? * (Kulviwat et al., 2007) Attractiveness
Q19 9 Do you find the concept of "Co-creation" appealing? * (Amos and Spears, 2010) Benefit
Q21 Do you believe companies would benefit from this type of creation process? * Own construct
Table 2 - Measurement model for co-creation evaluation and adoption
3.3 – Data Profile
The participants were 53,3% male and 47,3% female. The highest portion of respondents were aged 18-34 years old (79,8%) showing a representative young population. Also the highest fraction of respondents (41.6%) claimed an undergraduate degree. Lastly when asked on what income per month they received the answers were quite dispersed with 35,8% being <500€ and 25.5% for 500€ - 1000€, showing a probably not working or in the beginning of work life sample of population. Given the high number of different demographics it was possible to achieve a total of 31 nationalities, with all continents being represented, the most relevant being Europe (46,3%) and America (46%).
4. RESULTS
4.1 - Identification and Description of Segments
We started by performing a factor analysis to understand if all variables are relevant, moderately correlated, and understand what factors result in order to construct our segment clusters. We firstly reduced the dimensions through a factor analysis and then used the resulting factors to conduct the cluster analysis, hence increasing the reliability of meaningful clusters (Mooi & Sarstedt 2011). For this the Kaiser-Meyer-Olkin (KMO) was computed and the sample delivered an overall KMO measure of 0.84, which can be considered “meritorious” for and useful for analysis (Kaiser, 1974). Bartlett's test of sphericity indicated a p = 0.000,
meaning it was statistically significant and the data was likely factorisable. The results also showed four factors with an Eigenvalue greater than 1.
KMO and Bartlett's Test
Kaiser-Meyer-Olkin Measure of Sampling Adequacy. ,837 Bartlett's Test of Sphericity Approx. Chi-Square 1319,993
Df 91
Sig. ,000
Table 3 - KMO and Bartlett's Test
Total Variance Explained
Component
Initial Eigenvalues Extraction Sums of Squared Loadings Total % of Variance Cumulative % Total % of Variance Cumulative %
1 4,650 33,213 33,213 4,650 33,213 33,213 2 2,322 16,582 49,796 2,322 16,582 49,796 3 1,136 8,114 57,910 1,136 8,114 57,910 4 1,047 7,481 65,391 1,047 7,481 65,391 5 ,917 6,547 71,938 6 ,796 5,682 77,621 7 ,555 3,966 81,587 8 ,542 3,868 85,455 9 ,474 3,388 88,843 10 ,386 2,755 91,599 11 ,336 2,400 93,998 12 ,308 2,197 96,195 13 ,280 1,998 98,194 14 ,253 1,806 100,000
Extraction Method: Principal Component Analysis.
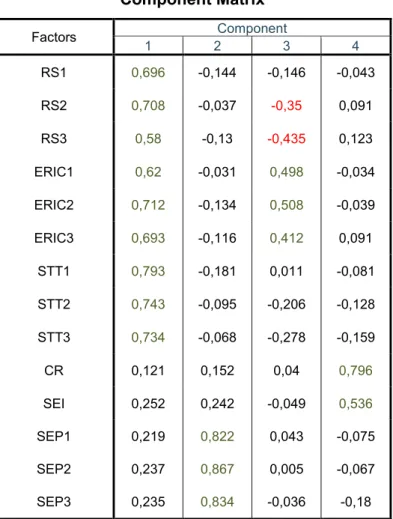
Component Matrix Factors 1 2 Component 3 4 RS1 0,696 -0,144 -0,146 -0,043 RS2 0,708 -0,037 -0,35 0,091 RS3 0,58 -0,13 -0,435 0,123 ERIC1 0,62 -0,031 0,498 -0,034 ERIC2 0,712 -0,134 0,508 -0,039 ERIC3 0,693 -0,116 0,412 0,091 STT1 0,793 -0,181 0,011 -0,081 STT2 0,743 -0,095 -0,206 -0,128 STT3 0,734 -0,068 -0,278 -0,159 CR 0,121 0,152 0,04 0,796 SEI 0,252 0,242 -0,049 0,536 SEP1 0,219 0,822 0,043 -0,075 SEP2 0,237 0,867 0,005 -0,067 SEP3 0,235 0,834 -0,036 -0,18
Table 5 - Component Matrix
The results showed 4 factors that were classified as such: (1) Cognitive passive resistant
(2) Situational passive resistant (3) High ERIC
(4) Cognitive rigidity/ Satisfaction existing products
Drawing from the literature review we can see that the measures we used in our survey are the same that construct the four types of passive resistance (Low passive resistance, Situational passive resistance, Cognitive passive resistance and Dual passive resistance). These were used to classify the four factors identified by the factor analysis and will further assist in classifying the clusters. Our aim was to firstly identify people who display signs of being passive innovation resistant, segment them into the four types of PIR if possible and then see how these segments responded to co-creation products.
The next step was to conduct a cluster analysis, the chosen method was the K-Means Clustering on SPSS in order to segment our population into the four types of passive resistance. The results were then examined and each cluster was given a name accordingly:
Final Cluster Centers
Factors Cluster 1 2 3 4 Cognitive passive resistant -0,70099 1,08253 0,61084 -0,47132 Situational passive resistant 0,1509 0,72622 -0,01061 -0,52904 High ERIC 0,70753 -0,54844 0,49034 -0,93554 Cognitive rigidity/ Satisfaction existing products -0,66117 -0,85677 0,77712 0,34565 Table 6 - Final Cluster Centers
Based on table 6, characteristics of each cluster can be described and thus segments on different types of passive resistant individuals defined:
(1) Normals with high ERIC (Cluster 1) – Individuals who display a high emotional reaction to imposed change, one of the four main forces driving inclination to resist change. Meaning, displaying a slight degree of cognitive passive resistance but not enough to be classified as such.
(2) Dual passive resistant (Cluster 2) – Individuals display high values of both cognitive and situational passive resistance and therefore classified as dual passive resistant.
(3) Cognitive passive resistant (Cluster 3) – Individuals exhibit high values of cognitive passive resistance, and are therefore classified as such.
(4) Normals with high Cognitive Rigidity (Cluster 4) – This segment pertains to both individuals who did not show a significant propensity for either cognitive or situational passive resistance.
4.1.1 - Segment Descriptions
All four segments showed some type of passive innovation resistance. As can be seen there was no significant number of individuals who could be classified as an independent cluster for situational passive resistant. Our sample did not show evidence of situational passive resistance, which is characteristic of individuals with low tolerance for changes in status quo. The forces behind it are satisfaction with existing products and satisfaction with the extent of innovations. One explanation for not finding a representative sample of this segment is the channels the survey was conducted, and the fact that it was distributed only through the internet, which excludes people who do not use it. We could speculate that people who actively use the internet, social media and blogs are more exposed to change and innovations and therefore have become accustomed to it. For these reasons, H2 was not further analyzed.
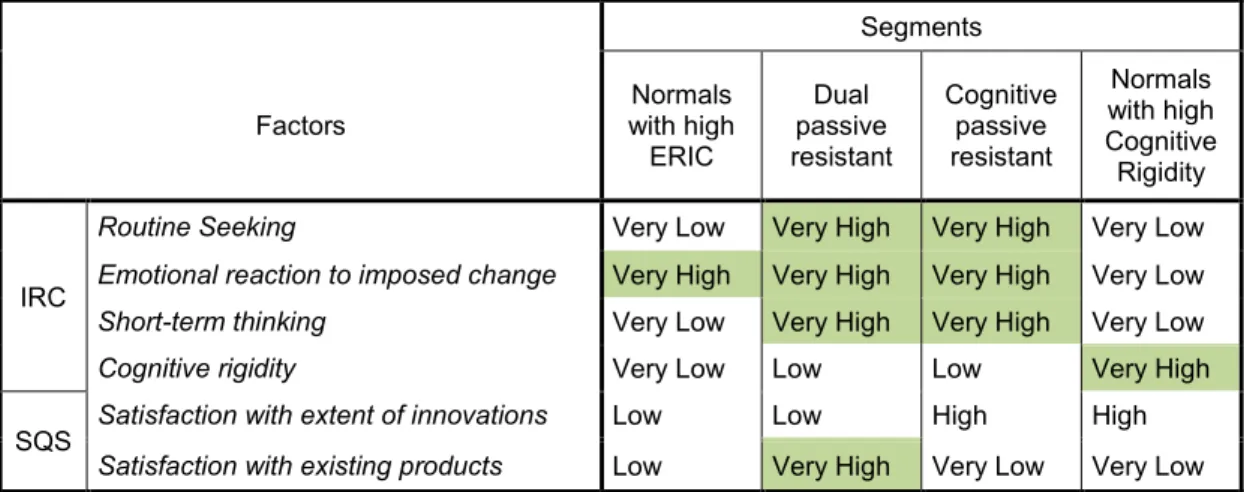
Furthermore, as can be seen in table 7 the segments of Normals with high ERIC and Normals with high Cognitive Rigidity both displayed low levels of passive innovation resistance. Both had few factors with significant loadings. Therefore,
Segments
Factors with high Normals ERIC Dual passive resistant Cognitive passive resistant Normals with high Cognitive Rigidity IRC
Routine Seeking Very Low Very High Very High Very Low
Emotional reaction to imposed change Very High Very High Very High Very Low
Short-term thinking Very Low Very High Very High Very Low
Cognitive rigidity Very Low Low Low Very High
SQS Satisfaction with extent of innovations Low Low High High
Satisfaction with existing products Low Very High Very Low Very Low
in our hypotheses when referring to low passive resistance segments we will use both these two segments and compare them.
4.2 - RQ1 - What are the consumer segments that are passively resistant to co-created products?
In order to test which are the consumer segments that are passively resistant to co-created products we used an analysis of variance with intention to adopt as our main dependent variable. As argued in the literature review, resistance to a particular product can be explained by its non-adoption, meaning the measure most appropriate and relevant was intention to adopt.
Descriptives
Intention to adopt
N Mean
Std.
Deviation Std. Error
95% Confidence Interval for Mean
Lower Bound Upper Bound Normals with high ERIC 70 2,4571 ,91185 ,10899 2,2397 2,6746 Dual passive resistant 36 2,8056 1,16667 ,19444 2,4108 3,2003 Cognitive passive resistant 69 2,7971 ,91683 ,11037 2,5769 3,0173 Normals with high Cognitive Rigidity 68 2,1324 ,84473 ,10244 1,9279 2,3368
Total 243 2,5144 ,97213 ,06236 2,3916 2,6372
Table 8 – Descriptives Intention to Adopt
Test of Homogeneity of Variances
Intention to adopt
Levene Statistic df1 df2 Sig.
2,213 3 239 ,087
Table 9 – Levene’s Test Intention to Adopt
In order to assess the ANOVA assumptions (homogeneity of variances) we conducted the Levene’s test (table 9). Results indicate a p-value of 0.87, p >0.05 and thus validating the assumption of equal variance between groups.
H1 - Adoption intention of products developed in a co-creation model will be higher
for consumers with cognitive passive resistance than for consumers with dual passive resistance but b) lower for consumers with low passive resistance.
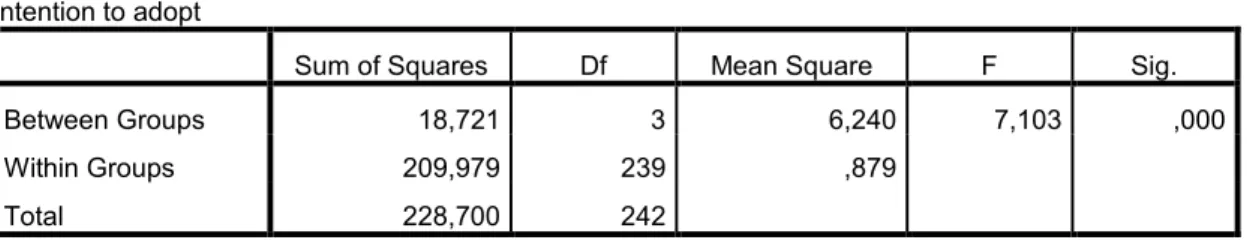
ANOVA
Intention to adopt
Sum of Squares Df Mean Square F Sig.
Between Groups 18,721 3 6,240 7,103 ,000
Within Groups 209,979 239 ,879
Total 228,700 242
Table 10 - ANOVA Intention to Adopt
Table 11 – Welch and Brown-Forsythe Intention to Adopt
Tables 10 and 11 show the ANOVA results indicating difference between customer segments and intention to adopt (p<.000), Welch and Brown-Fosythe tests confirms a statistically significant difference between groups (p=0.000). The different segments present different adoption intentions with Dual Passive
Resistant the most likely to adopt (MDPR= 2,8056) and Normals with high Cognitive
Rigidity the least likely to adopt (MNHCR= 2,1324).
Robust Tests of Equality of Means
Intention to adopt
Statistica df1 df2 Sig.
Welch 7,450 3 111,052 ,000 Brown-Forsythe 6,529 3 155,822 ,000 a. Asymptotically F distributed.
Using a pairwise comparison for the main effects with reported 95% confidence intervals and p-values we can further compare the segments. Inside our category of low passive resistance, the segment of Normals with high Cognitive Rigidity clearly was the most resistant (MNHCR=2,1324). The remaining two segments, Dual Passive
Resistant and Cognitive Passive Resistant, both showed signs of a rather neutral nature although still deviating to non-adoption (MDPR=2,8056; MCPR=2,7971). This
can be seen graphically represented in Figure 3. Looking at each segment’s means we can observe that all segments show some level of resistance in intention to adopt, all being below the average point (M=3,000). Also, both the lower passive resistance segments showed the most significant levels of non-adoption.
In order further analyze where these differences stand a post-hoc analysis was conducted (please see annex 1).
The post-hoc analysis shows that adoption intentions are significantly higher for
Dual Passive Resistant (MDPR=2,8056) when compared with Normals with high
Cognitive Rigidity (MNHCR=2,1324; p=.000) but not significantly different from the
other segments. Interestingly, Normals with high Cognitive Rigidity consumers were less likely to adopt than Cognitive Passive Resistant (p=0.000) and Dual passive resistant (p=0.004). Normals with high ERIC do not differ from any other segments in terms of intention to adopt (p > .05).
This results show that H1 is rejected, since Cognitive Passive Resistant individuals did not statistically differ from Dual Passive Resistant ones and showed higher adoption intention than the low passive resistance individuals (MDPR=2,8056 >
MNHCR=2,1324).
H3 - Adoption intention of products developed in a co-creation model, will be the
lowest for consumers with dual passive resistance, when compared with all other types of passive innovation resistance.
As was previously observed in the ANOVA and post-hoc analysis, the Dual Passive Resistant segment showed the highest adoption intention of all segments, as seen
in Figure 3 and Table 8 (MDPR=2,8056 > MNHCR=2,1324). Hence, leading to the
rejection of H3.
H4 - Adoption intention of products developed in a co-creation model, will be the
highest for consumers with low passive resistance, when compared with all other types of passive innovation resistance.
From the previous ANOVA and post-hoc analysis (MNHCR=2,1324 and MNHE=2,4571)
we were able to conclude that low passive resistance individuals demonstrated the lowest adoption intention for user co-created products (MDPR=2,8056 >
MNHCR=2,1324). Therefore, H4 was rejected.
4.3 - RQ2 - Do the different types of passive innovation resistance affect the perception of a product developed through a co-creation model?
H5 – Consumers’ quality perception of products developed in a co-creation model is
lower than the average quality.
Descriptives
Quality Expectations of Production Method
N Mean Std. Deviation Std. Error 95% Confidence Interval for Mean Lower Bound Upper Bound Normals with high ERIC 70 2,6971 ,65208 ,07794 2,5417 2,8526 Dual passive resistant 36 2,4333 ,89762 ,14960 2,1296 2,7370 Cognitive passive resistant 69 2,9217 ,69976 ,08424 2,7536 3,0898 Normals with high Cognitive Rigidity 68 2,1706 ,66311 ,08041 2,0101 2,3311
Total 243 2,5745 ,76461 ,04905 2,4779 2,6711
Table 12 – Descriptives QEPM
Test of Homogeneity of Variances
Quality Expectations of Production Method
Levene Statistic df1 df2 Sig.
In order to assess the ANOVA assumptions (homogeneity of variances) we conducted the Levene’s test (table 13). Results indicate a p-value of 0.63, p >0.05 and thus validating the assumption of equal variance between groups.
ANOVA
Quality Expectations of Production Method
Sum of Squares Df Mean Square F Sig.
Between Groups 21,184 3 7,061 14,029 ,000
Within Groups 120,298 239 ,503
Total 141,482 242
Table 14 – ANOVA QEPM
Robust Tests of Equality of Means
Quality Expectations of Production Method
Statistica df1 df2 Sig.
Welch 15,015 3 110,755 ,000
Brown-Forsythe 12,789 3 151,644 ,000 a. Asymptotically F distributed.
Table 15 – Welch and Brown Forsythe QEPM
Tables 14 and 15 show the ANOVA results indicating difference between customer segments and intention to adopt (p<.000), Welch and Brown-Fosythe tests confirms a statistically significant difference between groups (p=0.000).