Characterization of food offer at a university cafeteria
João PM Lima1,2,3,4, Raquel Mendes5 and Ada Rocha5
1Coimbra Health School – Polytechnical Institute of Coimbra – Portugal, 2CitechCare, 3GreenUPorto, 4LAQV-Requimte, 5Faculty of Nutrition and Food Sciences – University of Porto – Portugal joao.lima@estescoimbra.pt
Keywords: University; Availability; Food offer. Introduction
In European countries, economic development and the increase of consumers’ purchasing power led to an increase of food availability, which resulted in deep changes in food consumption (1). Regardless of other risk factors, an unbalanced food consumption pattern, characterized by high consumption of high energetic food, such as sugary drinks, sweets, cakes and fast-food associated with a sedentary lifestyle, has a significant impact on the nutritional status of the population, leading to an increased risk of developing chronic non-communicable diseases (1-5). Cafeterias have been associated with low availability of healthy foods (6-8) and consumption away from home as potential promoters of obesity prevalence has been demonstrated in several studies and assumed by consumers (7, 9-11). The key factor in the decision process of food selection is the food at the work environment (12), which includes complex aspects such as cost, quality, availability and accessibility that can act as incentives or barriers in the selection of healthy options (6, 12-14).
Therefore, it becomes necessary to develop tools that assess food availability of restaurants, allowing consumers to identify units that adopt strategies, which will facilitate the acquisition of healthier eating patterns among the population (7, 13). Cafeterias present a complementary service to the university canteens; they must also observe the principles of a balanced diet and act as health promoter (15). Recently, university and work cafeterias have been recognized as a place of support in the promotion of a healthy diet and are considered as decisive and influential on eating behaviour (16), since students and employees spend most of their break time there (16, 17). By modifying food availability in cafeterias, it may be possible to promote consumption of healthy foods and restrict the marketing of harmful foods, influencing eating habits (18-21).
Objective
To assess the food offer of a university cafeteria and characterize the nutritional adequacy of the food items available and to correlate it with sales and prices.
Materials and Methods
Food groups through direct observation and price list evaluated the availability from the perspective of the variety of food products available for sale. Food products were
classified as desirable (D), acceptable (A) and not desirable (ND). The classification was carried out taking into account the target population and the goals of health promotion and according to the criteria developed by Ferreira et al and by Costa (50, 51) and The Guidelines for school buffets of the Portuguese Ministry of Education and Science - General Direction of Education (MEC - GPI) (52). Availability, sales and cost were evaluated item by item.
Table 1 – Food items classification according to literature
Desirable (D) Acceptable (A) Not Desirable (ND)
Milk and dairy products rich in calcium, fruit, dark bread, bread without added fat or very low fat content and without added sugar.
Food products that can function as an alternative and complement of desirable food products. In accordance with the classification developed by Ferreira, A.,
et al and by Costa, there were considered acceptable
foods rich in carbohydrates, with or without added sugar; Examples: chocolate milk, biscuits and Croissants without stuffing, without stuffing, white bread, ham, cheese and nectars.
Food products that have one or more of the following
characteristics: are hiper energetic; include stimulants; additives or have high salt content.
Pastry, cakes, fruit nectars and ice cream, due to the lack of discrimination on available data of the type and variety of products offered and sold, were classified as follows: all nectars as A food, and all types of pastries, cakes (with the exception of the slice of cake) and ice cream as ND food. Additionally, since the bread was classified as D food and jam and butter as A food, bread with butter or jam, were classified as A food. Also regarding white bread with D or ND food, was classified as A food. According to Decree Law Nº. 50/2013, of April 16, cafeteria (alcoholic) beverages may not be available for sale. So, beer with alcohol and wine, were classified as ND products, considering their alcoholic content. Sales and prices of food items on a cafeteria of private management in the university campus were collected through reports of daily sales. The analysis was carried out between January and June. For qualitative evaluation and study of availability, sales and prices the Microsoft Office Excel® was used.
Results
It was found that 46% of foods available at the cafeteria were not desirable, 29% were desirable and 25% of products were acceptable. In general, consumers choose mostly not desirable food products (44%), followed by acceptable food (34%) and as final option desirable food products (23%). It was found the most available products were drinks with a prevalence of 30%. Fruit and ice cream were the least available products with a prevalence of only 1%. Drinks were sold in a higher percentage, accounting with 32% of the total sales. Ice creams accounted for 1% compared of the total sales. The results for availability of food products as well as the sales were organized by group and by subgroup.
Drinks: In terms of availability, it was found that not desirable drinks predominate (46%),
terms of availability not desirable food predominate, the desirable products were the most sold (40%), followed by acceptable food (33%) and by not desirable food (26%) (Table 1). In spite of a greater availability of soda/soft drinks (32%), nectars were the most sold drinks (25%).
Homemade cakes and pastries: In this group, only ND (58%) and A (42%) products
were available. It was found that ND food products were the most sold accounting for 61% of the total sales (table 3). It was also found that the pastry products showed a high availability (47%) and they were also the most sold (60%) of the group of homemade cakes and pastries.
Sweets: In this group level, all food products were classified as not desirable. The
products with the highest sales were the chewing gum and chocolates.
Bread: In this group food products were classified as desirable (72%) or acceptable
(28%). It was found that although in terms of availability desirable food products predominate, the acceptable foods were the most sold (66%).
Sandwiches: Food products available were classified only as acceptable (70%) and
desirable (30%). Acceptable food products were the most sold (69%).
Snacks: 89% of snacks available were not desirable, followed by acceptable (11%). Not
desirable food were the most sold (94%). Food products, as for example quiche, hamburgers, pizza slices and hot dogs in spite of being the most available (39%), were not the most sold, being supplanted by fried potatoes and chips (66%).
Ice Cream: All products were classified as not desirable. This group has only 2 types of
food products and for this reason the comparative analysis between the prevalence of availability and sales was not applicable.
Fruit: All products on this group were classified as desirable. In terms of availability this
group also features only 2 types of food products and for this reason the comparative analysis between the availability and sales was not applicable.
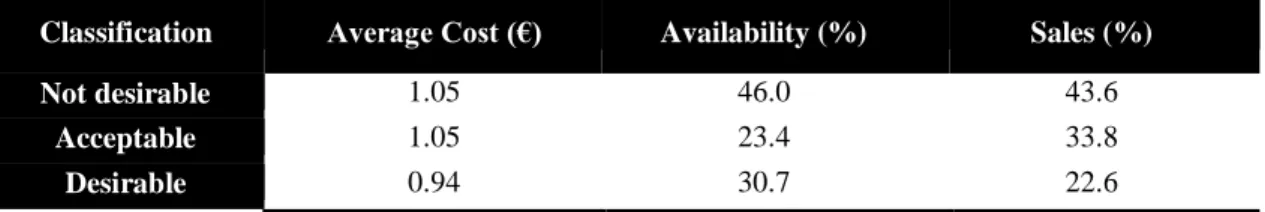
The average price of products available was 1.02€ and the top selling products were “not desirable products” with an average price of 1.05€. It appears that the “not desirable products” were on average more expensive than the others. The products more available were the most sold (table 2).
Table 2. Prevalence of food availability, sales and cost according to classification of
food products
Classification Average Cost (€) Availability (%) Sales (%)
Not desirable 1.05 46.0 43.6
Acceptable 1.05 23.4 33.8
Desirable 0.94 30.7 22.6
Drinks: In this group the “not desirable products” presented an average cost of 0.97€ and
were the most available (13.7%). Despite this, the most sold products were desirable products that were the cheaper ones (0.77€) (table 3).
Homemade cakes and pastries: In this group, “not desirable products” are those who
were on average more expensive (0.86€), and those who were more available and more sold (table 3).
Sweets, ice cream and fruit: Comparing to ice creams and sweets, fruits were cheaper,
and compared with sweets they were less available and less sold (table 3).
Bread: In spite of availability of less healthy options, it appears that healthier options,
although more expensive, are the most sold (table 3).
Sandwiches: The average cost of acceptable and desirable sandwiches was very similar,
and less healthy options were slightly more expensive. Despite being more expensive, they were the most available and the most sold (table 3).
Snacks: The not desirable snacks available were more expensive than the acceptable
ones. Despite this, they were the most available and the most sold (table 3).
Table 3. Prevalence of food availability, sales and cost according to classification of
food products and by a subgroup of foods
Group Classification Cost (€) Sales (%) Availability (%)
Not desirable 0.97 8.3 13.7
Drinks Acceptable 0.87 13.6 4.4
Desirable 0.77 12.9 11.7
Homemade cakes and pastries
Not desirable 0.86 13.4 8.0
Acceptable 0.83 8.4 5.8
Sweets Not desirable 0.84 5.4 5.1
Fruit Desirable 0.75 2.8 1.5
Ice Cream Not desirable 1.28 1.1 0.7
Acceptable 0.67 9.2 5.8 Bread Desirable 0.96 4.8 15.3 Acceptable 1.89 4.6 5.1 Sandwiches Desirable 1.88 2.1 2.2 Not desirable 1.25 15.4 18.3 Snacks Acceptable 1.05 0.9 2.2 Discussion
“Not desirable food products” should be the least representative; nevertheless, they were the most available at the cafeteria, corresponding to 46% of whole products. These results were in line with findings in a study carried out in the cafeteria at school the School of Tourism and Hospitality of Coimbra (EHTC) (22). Sales data followed the same trend of availability, not desirable food was the most sold, corresponding to 44% of whole sales, while desirable food products were the least sold (23%). Similar results were found in another study conducted in the cafeteria of EHTC, where not desirable dinks
corresponded to 60.9% of sold beverages (23). Most available products were high energy density, rich in saturated fats, low in complex carbohydrates and rich in simple sugars and are low density foods. Our results are in line with other studies on trends of food availability (1, 24). The not desirable products were the most sold. These results are consistent with the results from others studies undertaken in several European countries and in the United States of America (25-28). Availability and sales of ice creams may be underestimated since they are seasonal products and analysis was performed in the period of winter/spring.
It is known that food availability influences food intake, although it is not the only determinant. So, in view of the results obtained in this study, the question arises concerning the relationship between food availability and consumption. Considering the availability of food as a determinant of food habits, we might think that if the availability of desirable food increased in the cafeteria, an increase in consumption should be expected. These results reveal the need for improving nutritional adequacy of the menus, in order to meet recommendations, and promote healthier eating habits by canteen users. The intervention can start by a concerted action between units modifying the offer and increasing desirable products.
Comparative analyses carried out after systematic and continuous interventions reveal positive changes in food provided by school cafeterias. The effectiveness of these interventions is due to the involvement of the various levels of responsibility of the institutions, specialized health professionals and complementary actions of food education together with the agents involved - including employees who prepare meals and consumers - with the aim of promoting acceptance of proposed measures (29).
Conclusion
Generally, food offer is not good. However comparing the price of food available and food sold, seems that the price not to influence the food choice in the population under analysis. Food availability should be changed to shape sales toward the promotion of health, as well as the development of new policies and actions of food education to enable people to make more informed food choices away from home.
References
1. Who J, Consultation FE. Diet, nutrition and the prevention of chronic diseases. World Health Organ Tech Rep Ser. 2003;916(i-viii).
2. Lopes C, Oliveira A, Santos A, Ramos E, Gaio A, Severo M, et al. Consumo alimentar no Porto. Faculdade de Medicina da Universidade do Porto. 2006.
3. Malik VS, Popkin BM, Bray GA, Després J-P, Willett WC, Hu FB. Sugar-sweetened beverages and risk of metabolic syndrome and type 2 diabetes a meta-analysis. Diabetes Care. 2010;33(11):2477-83.
4. Fulgoni III VL, Fulgoni SA, Bodor AR. Association of candy consumption with physiological parameters in participants from the National Health and Nutrition
Examination Survey (1999-2004). The FASEB Journal.
2009;23(1_MeetingAbstracts):551.22.
5. Rosenheck R. Fast food consumption and increased caloric intake: a systematic review of a trajectory towards weight gain and obesity risk. Obes Rev. 2008;9(6):535-47. 6. Sallis JF, Glanz K. The role of built environments in physical activity, eating, and obesity in childhood. The Future of children / Center for the Future of Children, the David and Lucile Packard Foundation. 2006;16(1):89-108.
7. Saelens BE, Glanz K, Sallis JF, Frank LD. Nutrition Environment Measures Study in Restaurants (NEMS-R). American Journal of Preventive Medicine. 2007;32(4):273-81. 8. Cunha CCS. Publicidade e Alimentação: Mistura Explosiva. Nutrícias. 2007;7:58-61. 9. Jaworowska A, Blackham T, Davies IG, Stevenson L. Nutritional challenges and health implications of takeaway and fast food. Nutrition Reviews. 2013;71(5):310-8.
10. Nago ES, Lachat CK, Dossa RAM, Kolsteren PW. Association of Out-of-Home Eating with Anthropometric Changes: A Systematic Review of Prospective Studies. Critical Reviews in Food Science and Nutrition. 2014;54(9):1103-16.
11. Orfanos P, Naska A, Trichopoulos D, Slimani N, Ferrari P, van Bakel M, et al. Eating out of home and its correlates in 10 European countries. The European Prospective Investigation into Cancer and Nutrition (EPIC) study. Public Health Nutrition. 2007;10(12):1515-25.
12. Roy R, Kelly B, Rangan A, Allman-Farinelli M. Food Environment Interventions to Improve the Dietary Behavior of Young Adults in Tertiary Education Settings: A Systematic Literature Review. Journal of the Academy of Nutrition and Dietetics. 2015;115(10):1647-81.e1.
13. Glanz K, Sallis JF, Saelens BE, Frank LD. Healthy Nutrition Environments: Concepts and Measures. American Journal of Health Promotion. 2005;19(5):330-3.
14. Ni Mhurchu C, Vandevijvere S, Waterlander W, Thornton LE, Kelly B, Cameron AJ, et al. Monitoring the availability of healthy and unhealthy foods and non-alcoholic beverages in community and consumer retail food environments globally. Obesity reviews : an official journal of the International Association for the Study of Obesity. 2013;14 Suppl 1:108-19.
15. Gomes JP. As Escolas Promotoras de Saúde: uma via para promover a saúde e a educação para a saúde da comunidade escolar. Educação. 2009;32(1).
16. Thomas EL, Ribera AP, Senye-Mir A, Eves FF. Promoting Healthy Choices in Workplace Cafeterias: A Qualitative Study. Journal of nutrition education and behavior. 2016;48(2):138-45. e1.
17. Esfarjani F, Mohammadi-Nasrabadi F, Roustaee R, Hajifaraji M. Schools' Cafeteria Status: Does it Affect Snack Patterns? A Qualitative Study. Int J Prev Med. 2013;4(10). 18. Quintiliani L, Poulsen S, Sorensen G. Healthy eating strategies in the workplace. International Journal of Workplace Health Management. 2010;3(3):182-96.
19. Edmonds J, Baranowski T, Baranowski J, Cullen KW, Myres D. Ecological and socioeconomic correlates of fruit, juice, and vegetable consumption among African- American boys. Prev Med. 2001;32(6):476-81.
20. Tibbs T, Haire-Joshu D, Schechtman KB, Brownson RC, Nanney MS, Houston C, et al. The relationship between parental modeling, eating patterns, and dietary intake among African-American parents. J Am Diet Assoc. 2001;101(5):535-41.
21. Doyle EI, Feldman RH. Are local teachers or nutrition experts perceived as more effective among Brazilian high school students? J Sch Health. 1994;64(3):115-8.
22. Carvalho JG, Baptista E, Lima JPM. Caracterização do perfil nutricional de géneros alimentícios na cafetaria da Escola de Turismo e Hotelaria de Coimbra [Abstract]. Acta Portuguesa de Nutrição. 2015;1:60.
23. Lima J, Augusto C, Gaspar J, Brandão TRS, Rocha A. O açúcar que comes quando bebes: impacto de uma estratégia de consciencialização. Acta Portuguesa de Nutrição. 2016;4:18-22.
24. Chen Q, Marques-Vidal P. Trends in food availability in Portugal in 1966–2003. Eur J Nutr. 2007;46(7):418-27.
25. Orfanos P, Naska A, Trichopoulou A, Grioni S, Boer J, Van Bakel M, et al. Eating out of home: energy, macro-and micronutrient intakes in 10 European countries. The European Prospective Investigation into Cancer and Nutrition. Eur J Clin Nutr. 2009;63:S239-S62.
26. Ledikwe JH, Ello-Martin JA, Rolls BJ. Portion sizes and the obesity epidemic. The Journal of nutrition. 2005;135(4):905-9.
27. Glanz K, Basil M, Maibach E, Goldberg J, Snyder D. Why Americans eat what they do: taste, nutrition, cost, convenience, and weight control concerns as influences on food consumption. J Am Diet Assoc. 1998;98(10):1118-26.
28. Mancino L, Todd J, Lin B-H. Separating what we eat from where: measuring the effect of food away from home on diet quality. Food Policy. 2009;34(6):557-62.
29. Sancho T, et al. Promoção da qualidade nutricional de refeições em estabelecimentos de educação do Algarve - análise comparativa 2004/2005 - 2006/2007. Nutrícias. 2008;8:16-9.