UNIVERSIDADE DE LISBOA
FACULDADE DE MOTRICIDADE HUMANA
STRENGTH TRAINING AND MUSCLE ARCHITECTURE
With special reference to effects of range of motion on muscle structure
Dissertação elaborada com vista à obtenção do Grau de Mestre em Treino de Alto Rendimento
Orientador: Professor Doutor Pedro Mil-‐Homens Santos
Júri:
Presidente
Professor Doutor Pedro Victor Mil-‐Homens Ferreira Santos Vogais
Professor Doutor Paulo Alexandre Armada da Silva Professora Doutora Filipa Oliveira da Silva João
António Francisco Furtado Salgueiro Tavares 2014
Acknowledgments
Em primeiro lugar, ao Professor Doutor Pedro Mil-Homens Santos e à Professora Maria João Valamatos, obrigado pela vossa dedicação durante o passado ano e meio em que estive envolvido na escrita desta dissertação. A partilha do vosso conhecimento, orientação e todo o suporte académico e pessoal foram imprescindíveis para que conseguisse terminar este trabalho. Foi um enorme prazer e privilégio fazer parte da equipa durante este período.
À Rute Santos o meu agradecimento pela sua contribuição na recolha das imagens de ultrassons e pela partilha de conhecimento da sua área.
A todos os colegas que serviram de amostra experimental para o presente estudo. A disponibilidade foi decisiva para o sucesso desta investigação.
Ao Diogo Martins, Pedro Cardoso, João Martins o meu agradecimento por todo o suporte que me deram. Foi durante esta etapa que tive a oportunidade de vos conhecer de uma maneira Profissional mas acima de tudo, de vos ter como amigos.
Ao João Albuquerque, Joana Reis, Nuno Almeida, Ricardo Andrade e Ana Silva, o meu obrigado por toda a vossa amizade e companheirismo. É um privilégio trabalhar ao lado de pessoas tão bem dispostas, competentes e amigas.
Ao Sandro Freitas, Professor, colega mas essencialmente um verdadeiro amigo. O teu esforço e dedicação à ciência tornam-te uma referência para mim. Obrigado pelo tempo que me disponibilizaste naquelas alturas mais ocupadas deste percurso. Um obrigado também ao meu colega e amigo Sandro Dias não só pela revisão da escrita em Inglês mas também por toda a partilha Profissional.
À Sara Grade pelo enorme carinho e apoio. Durante um determinado período desta dissertação foi em ti que me apoiei diariamente. Obrigado pela tua preocupação constante e por estares sempre cá para mim.
Ao meu Pai, Mãe, Madrasta, Padrasto, Irmão e Irmã, por existirem. A diferentes níveis, todos vocês me deram a força para ser a pessoa ambiciosa que hoje sou. Essa força acompanha-me durante todas as etapas da minha vida. Obrigado pelo vosso suporte, carinho e amizade.
Abstract
The purpose of the present study was to investigate adaptations on vastus lateralis (VL) muscle size, pennation angle and force (torque max) to a 15 week training program with either a full or partial range of motion (ROM). Nineteen previously untrained students were randomly distributed in one of two groups: control (CG) (n = 8; age, 26.6 ± 5.2 years; height, 177 ± 5.3 cm; body mass, 75.7 ± 10.6 kg; means ± SD) or training (TG) (n = 11; age, 21.6 ± 3.5 years; height, 174 ± 4.5 cm, body mass, 71.0 ± 6.9 kg; means ± SD) group. In the TG, one of the subject’s legs was randomly chosen to be trained with a full ROM (FULL) and the other partial ROM (PAR). Training consisted on 15 weeks of isokinetic training, with either a full (100º of knee flexion to 0º) or partial (60º of knee flexion to 0º) ROM. Pennation angle (PA) was measured with ultrasonography at 50% of total muscle length. VL maximum anatomical cross sectional area (ACSAmax), volume and regional ACSA (measured at
25, 50 and 75% of total muscle length - ACSA25, 50, 75) was obtained with magnetic
resonance imaging (MRI). Maximum torque was obtained isometrically with isokinetic dynamometer at 75º of knee flexion.
Together with PA, all muscle size measures increase significantly (p<0.05) from pre- to post-training. The changes were respectively for FULL and PAR, PA: 9.6 and 12.3%; ACSAmax: 5.3 and 4.1%; Volume: 5.1 and 4.6%. When comparing regional
adaptations on muscle size of VL, the changes were respectively for FULL and PAR, ACSA25: 3.0 and 2.9%; ACSA50: 5.5 and 4.5%; ACSA75: 6.9 and 6.7%. Although we
verified a trend to a greater increase from proximal to distal site, we only found differences when comparing ACSA50 and ACSA75 to ACSA25. In PAR and FULL
maximal torque increased 27.9 and 33.3%, respectively. No significant differences (p<0.05) were found for PA, isometric knee extensor torque or any muscle size measures between training groups. As expected no significant changes (p<0.05) were found for the control group for any measured variable.
The present findings suggest that vastus lateralis adapts to training independent of ROM when muscle time under tension is similar.
Keywords: Muscle structure, muscle size, regional hypertrophy, muscle architecture,
Resumo
O propósito do presente estudo foi investigar as adaptações no volume do músculo vastus lateralis (VL), ângulo de penação e força (momento máximo de força) a um programa de treino de força de 15 semanas com amplitude (ROM) total ou parcial. Dezanove estudantes previamente não treinados foram distribuídos aleatoriamente num de dois grupos: controlo (CG) (n=8; idade, 26.6 ± 5.2 anos; altura, 177 ± 5.3 cm; massa corporal, 75.7 ± 10.6 kg; média ± DP) e treino (TG) (n = 11; idade, 21.6 ± 3.5 anos; altura, 174 ± 4.5 cm, massa corporal, 71.0 ± 6.9 kg; médias ± DP). No TG, uma das pernas de cada sujeito foi aleatoriamente escolhida para ser treinada com uma amplitude total (FULL) e a outra parcial (PAR). O treino consistiu em 15 semanas de treino isocinético com uma amplitude total (100 a 0º de flexão do joelho) ou parcial (60 a 0º). O ângulo de penação (PA) foi medido através de ultrasonografia a 50% do comprimento total do músculo. A área de secção anatómica máxima (ACSAmax), o
volume e a ACSA regional (medida a 25, 50 e 75% do comprimento total do músculo - ACSA25, 50, 75) do VL foram obtidas através de ressonâncias magnéticas (MRI). O
momento máximo de força foi obtido isometricamente com 75º de flexão do joelho. Para além do PA, todas as medidas do tamanho do músculo aumentaram significativamente (p<0.05) do período pré para pós-treino. As alterações foram respectivamente para o grupo FULL e PAR, PA: 9.6 e 12.3%; ACSAmax: 5.3 e 4.1%;
VL Volume: 5.1 e 4.6%. Quando comparadas as adaptações regionais do VL, as alterações foram respectivamente para o grupo FULL e PAR, ACSA25: 3.0 e 2.9%;
ACSA50: 5.5 e 4.5%; ACSA75: 6.9 e 6.7%. Apesar de se verificar uma tendência para
maiores aumentos da região proximal para a distal, só foram verificadas diferenças quando comparadas as regiões ACSA50 e ACSA75 com a região ACSA25. Para o grupo
PAR e FULL o momento máximo de força aumentou significativamente 27.9 e 33.2%, respectivamente. Não foram verificadas diferenças significativas (p<0.05) entre PAR e FULL no PA, momento isométrico máximo de extensão do joelho e nas medidas de dimensão do músculo. Não foram verificadas alterações significativas (p<0.05) no grupo de controlo em todas as variáveis avaliadas.
Os resultados do presente estudo demonstram que quando o tempo sobre tensão é semelhante, o VL se adapta ao treino independentemente do ROM.
Palavras chave: Volume muscular, hipertrofia regional, arquitectura muscular, vastus
Index
1. Introduction ... 1
1.1. Statement of the problem ... 1
1.2. Purpose of the study ... 7
1.3. Relevance of the study ... 8
1.4. Assumptions and Limitations ... 10
2. Review of literature ... 13
2.1. Skeletal muscle structure ... 13
2.1.1. Muscle architecture definitions ... 13
2.2. Measuring of muscle structure ... 14
2.2.1. Muscle architecture measurement ... 14
2.2.1.1. Measuring of fascicle length ... 15
2.2.1.2. Measuring of pennation angle ... 16
2.2.2. Measuring of muscle size ... 17
2.3. Functional implications of skeletal muscle architecture ... 19
2.4. Influence of range of motion on resistance training ... 21
2.5. Musculature plasticity to resistance training ... 22
2.5.1. Muscle size ... 23 2.5.2. Pennation angle ... 27 2.5.3. Fascicle length ... 30 3. Methods ... 39 3.1. Experimental design ... 39 3.2. Subjects ... 39 3.3. Training program ... 40
3.4. Muscle size assessment ... 42
3.5. Pennation angle assessment ... 43
3.6. Knee extension isometric torque assessment ... 44
3.7. Statistical analysis ... 44
4. Results ... 45
4.1. Muscle size ... 45
4.2. Pennation angle ... 48
5. Discussion ... 51 6. Conclusion ... 59 7. Bibliography ... 61
Index of Figures
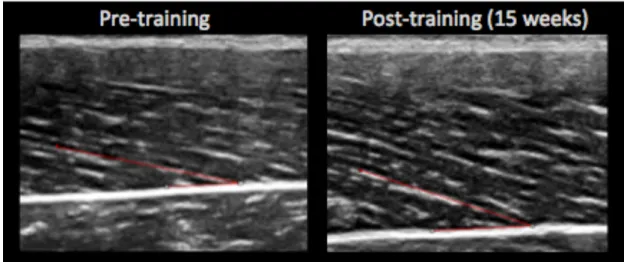
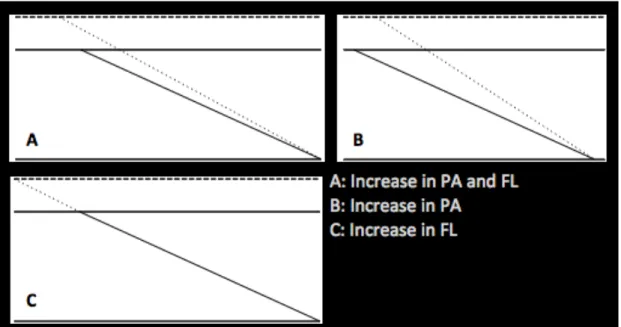
Figure 1 - An example of changes in pennation angle from pre (13.7º) to post-training (20.4º). ... 7 Figure 2 - A sonograph of vastus lateralis with architectural parameters. ... 14 Figure 3 - Different changes in FL and PA leading too similar increase in MT. ... 24 Figure 4 - Comparison of training volume between full and partial ROM groups along 5 training blocks. Each block consists on 3 weeks. ... 42 Figure 5 - MRI scan of the quadriceps muscles. Perimeter of the vastus lateralis (VL) is delimited on the right image. ... 43 Figure 6 - Relative changes in VL Volume and maximum ACSA (ACSAmax), after training with full ROM (Full), partial ROM (Partial) and control (Control). Columns show group adaptation mean (%), and standard error of the mean (SEM) is indicated by errors bars. No differences on changes of control group. No differences between training groups. *Significant different from control group (ρ < 0.05). ... 46 Figure 7 - Relative changes on regional VL ACSA, after training with full ROM (Full), partial ROM (Partial) and control (Control). Columns show group adaptation mean (%), and standard error of the mean (SEM) is indicated by errors bars. No differences were found between medial and distal regions on both training groups, or between any regions on control group. *Significant different from control group (ρ < 0.05). #Significant different from proximal region (ρ < 0.05). ... 48 Figure 8 - Relative changes in VL PA measured at 50%, after training with full ROM (Full), partial ROM (Partial) and control (Control). Columns show group adaptation mean (%), and standard error of the mean (SEM) is indicated by errors bars. No differences between training groups. No differences from pre- to post-training in the control group. *Significant different from control group (ρ < 0.05). ... 49 Figure 9 - Relative changes in force, measured as maximum knee extension torque, after training with full ROM (Full), partial ROM (Partial) and control (Control). Columns show group adaptation mean (%), and standard error of the mean (SEM) is indicated by errors bars. No differences between
training groups. No differences from pre- to post-training in the control group. *Significant different from control group (ρ < 0.05). ... 50
Index of Tables
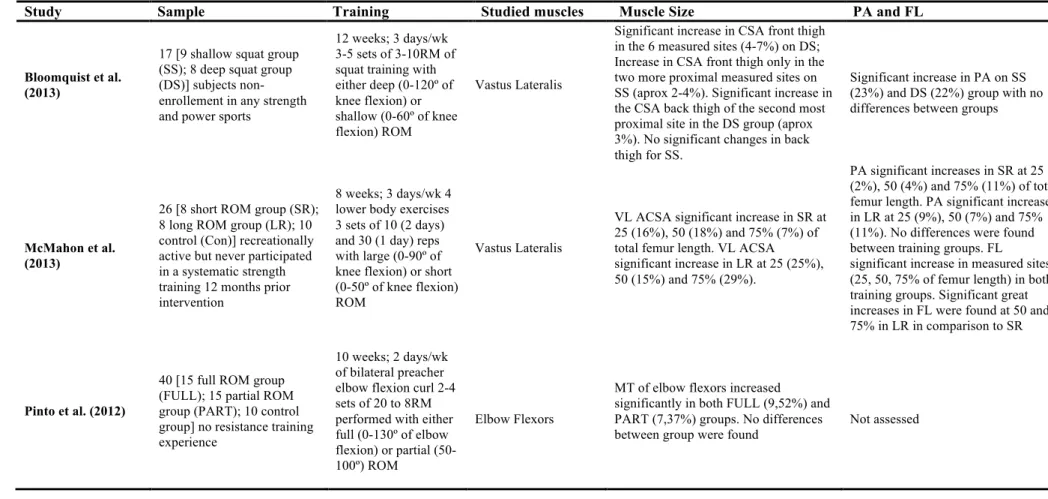
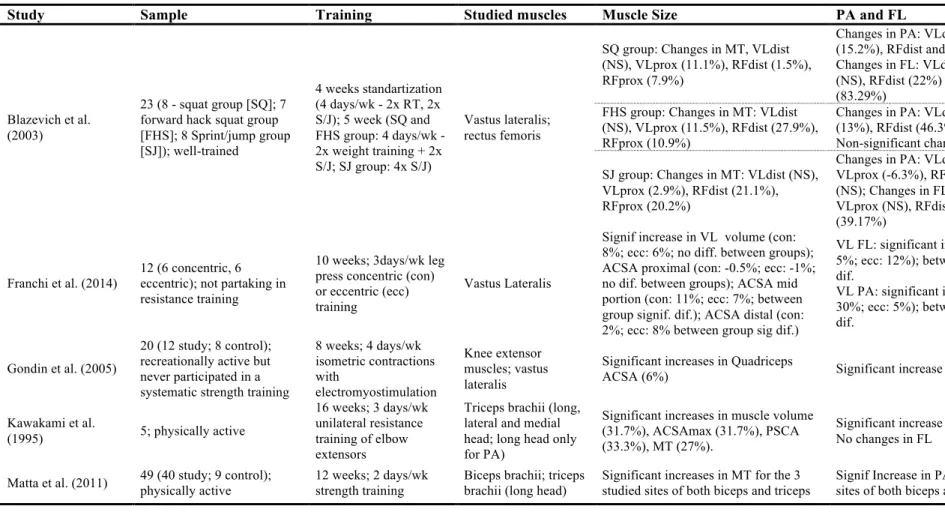
Table 1. Muscle size and muscle architecture adaptations after ROM training ... 35
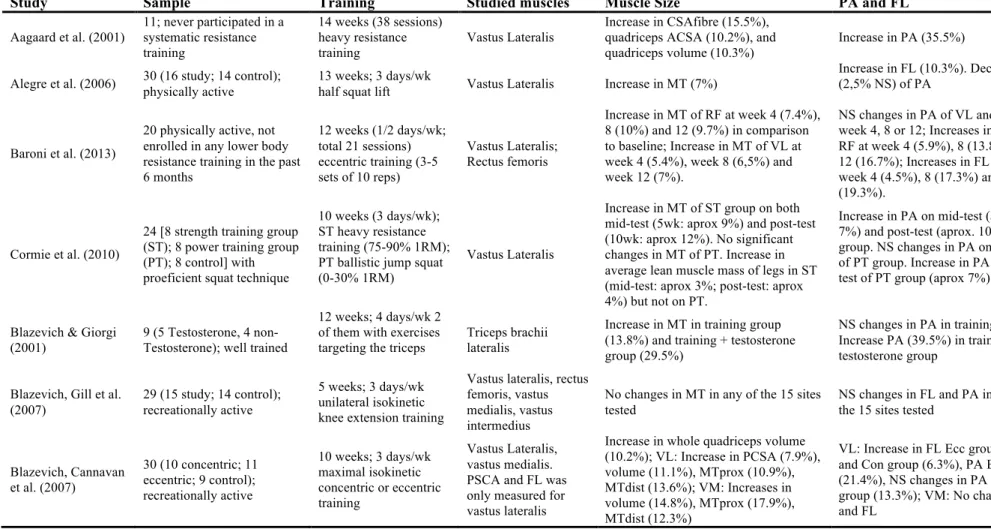
Table 2. Muscle size and muscle architecture adaptations after training ... 36
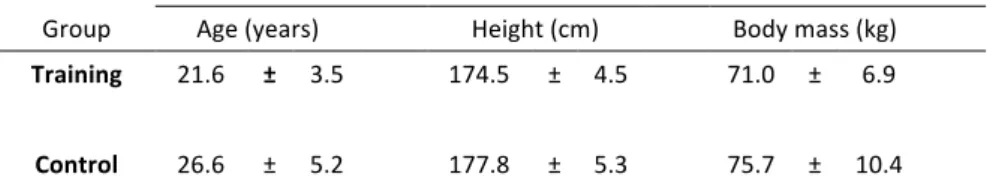
Table 3. Means ( ± SD) of age, height, weight ... 39
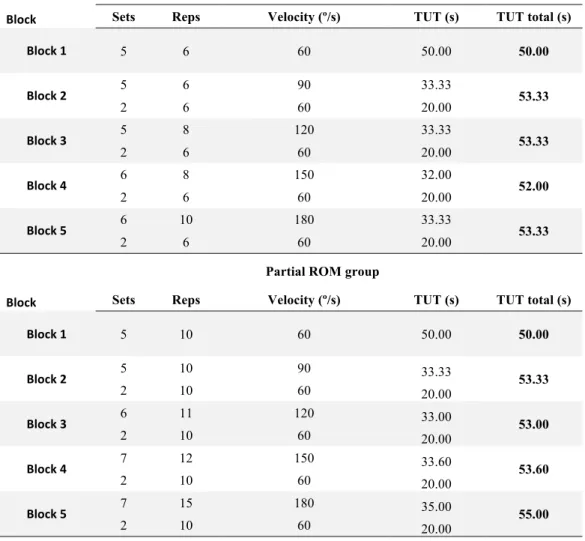
Table 4. Comparison of training volume between full and partial ROM groups. ... 41
Table 5. Changes in anatomical cross-sectional area of the Vastus lateralis (VL) measured on three muscle regions: proximal (25% of the length of the muscle), medial (50% length) and distal (75% in length). The mean and standard deviation of the respective anatomical sections 5 values are displayed. No differences were found on the control group. No differences were found between medial and distal regions on both training groups, or between any regions on control group. *Significant different from control group (ρ < 0.05). #Significant different from proximal region (ρ < 0.05). ... 47
ACSA Anatomical cross-sectional area
ACSAmax Maximal anatomical cross-sectional area
CSA Cross sectional area
CV Coefficient of variation
FL Fascicle length
GL Gastrocnemius lateralis
GM Gastrocnemius medialis
HIIT High intensity interval training HIPT High intensity power training IGF Insulin like growth factor ICC Intra-class correlation
MT Muscle thickness
MU Motor unit
MRI Magnetic resonance imaging
Nm Newton x meter
PA Pennation angle
PCSA Physiological cross-sectional area
QF Quadriceps femoris
RF Rectus femoris
RM Repetition maximum
ROM Range of motion
SD Standard deviation
SEM Standard error mean
TE Typical error
TUT Time under tension
US Ultrasound
VL Vastus lateralis
1. Introduction
1.1. Statement of the problem
There are several factors contributing to force production (Cormie, McGuigan, & Newton, 2011; Folland & Williams, 2007). Given this, adaptations to resistance training have been investigated at a hormonal, metabolic, neural and morphological level.
From a hormonal point of view it is well known that an increased anabolic hormonal level strongly influence muscle hypertrophy through the stimulation of protein synthesis (Kraemer & Fleck, 1993; Kraemer et al., 1990; McCaulley et al., 2009). Likely, resistance training increases protein synthesis in a greater magnitude than protein breakdown, resulting on an increased muscle net protein balance (Kumar, Atherton, Smith, & Rennie, 2009; Phillips, Tipton, Aarsland, Wolf, & Wolfe, 1997; Yarasheski, Zachwieja, & Bier, 1993). Also, an increase in both anabolic and catabolic hormonal levels is expected as response to resistance training (Kraemer et al., 1999; Kraemer & Fleck, 1993; Kraemer et al., 1990; McCall, Byrnes, Fleck, Dickinson, & Kraemer, 1999; McCaulley et al., 2009; Wideman, Weltman, Hartman, Veldhuis, & Weltman, 2002), whereas the balance between these ultimately dictate the increase or decrease on net protein balance (Kumar et al., 2009; Phillips et al., 1997; Yarasheski et al., 1993). At a cellular level, this phenomenon can occur due to a number of complex signaling pathways which in turn are stimulated by the mechanical stress induced thru resistance training (Schoenfeld, 2010; Tidball, 2005; Toigo & Boutellier, 2006). Although there are other anabolic hormones (e.g. leptin, peptide F, estrogens), the most widely investigated are probably testosterone, growth hormone, insulin and insulin-like growth factors (IGFs) (Crewther, Keogh, Cronin, & Cook, 2006; Kraemer & Ratamess, 2005). The catabolic hormone that has received most attention is cortisol (Kraemer et al., 1999; Kraemer & Fleck, 1993; McCall et al., 1999; McCaulley et al., 2009). These hormones seem to be sensitive to many factors as sex, age, nutrition, training status and training methodology (Crewther et
al., 2006; Kraemer & Ratamess, 2005). In particular, strength training characterized by high volume, high intensity and low intra-set rest intervals seems to lead to a greater acute increases in the hormonal level (Kraemer et al., 1999; Kraemer & Fleck, 1993; Kraemer et al., 1990; McCall et al., 1999; McCaulley et al., 2009; Wideman et al., 2002). Moreover, while an acute increased in anabolic hormones can be observed after strength training, chronically there seem to be no major changes on hormonal concentration arising from training (McCall et al., 1999; Wideman et al., 2002). An extensive review of the impact of manipulating these training variables can be found on the papers of Crewther et al. (2006) and Kraemer & Ratamess (2005).
Neural adaptations are expected as adaptation to resistance training (Gabriel, Kamen, & Frost, 2006). The disproportional greater increase in strength in comparison to muscle size observed during early exposure to resistance training protocol is one possible example of the adaptive potential of neural mechanisms (Moritani & DeVries, 1979). This can be explained by the observed increase in motor unit activation on untrained subjects (Häkkinen et al., 1998; Häkkinen, Alen, Kallinen, Newton, & Kraemer, 2000; Rabita, Pérot, & Lensel-Corbeil, 2000), although literature is inconsistent since no differences on motor unit activation after resistance training have been reported by some (Holtermann, Roeleveld, Vereijken, & Ettema, 2005). The level of motor unit (MU) activation expresses the number of recruited MU and their discharge rate (Gabriel et al., 2006; Sale, 2003). Therefore an increase in both recruitment (Patten, Kamen, & Rowland, 2001) and firing rate (Cutsem, Duchateau, & Hainaut, 1998; Patten et al., 2001) is expected as adaptation to strength training. Not only MU recruitment and firing rate seem to influence force production. Early activation of MU, training induced doublets, synchronization of MU are other examples of adaptations resulting from resistance training (Cutsem et al., 1998). The need for observation of a single motor unit to better understand neural adaptations arising from resistance training leads to methodological difficulties that makes scarce literature in comparison to other subjects. Thus, there are still a lot of controversies on the neural mechanisms that facilitate force production (Enoka & Fuglevand, 2001). An extended understanding of neural adaptations to resistance training can be found in the reviews of Sale (2003), Duchateau, Semmler, & Enoka (2006) and Gabriel et al. (2006).
Manipulation of program design variables (e.g. number of repetitions) strongly determines adaptations to resistance training (Anderson & Kearney, 1982; Campos et al., 2002; Stone & Coulter, 1994). Therefore, muscular adaptations in muscle size, strength and/or endurance can be partly explained by differences in the training intensity zone (i.e. different maximum repetitions zones, known as repetition continuum) (Campos et al., 2002). While heavy to moderate training (i.e. 3-5RM to 9-11RM) leads to increases in all muscle fiber type area and therefore greater increases in maximum strength, low load training (i.e. 20-28RM) appears to be best suited for increases in aerobic power, time to exhaustion and increase in muscular resistance (Campos et al., 2002). Another type of high volume resistance training is circuit training. This type of training consists on a set of exercises performed with little rest in between. Because the work rest ratio is greater in circuit training in comparison to traditional resistance training, circuit training seems to have beneficial effects on cardiovascular adaptations (Henry, Anshel, & Michael, 2006; Kaikkonen, Yrjämä, Siljander, Byman, & Laukkanen, 2000; Mosher & Underwood, 1994). More recently was implemented the term high intensity power training (HIPT). This type of training can be considered as high intensity interval training (HIIT) with recourse to resistance and bodyweight exercises. Being that, HIPT is very similar to circuit training but uses multi joint movements with high intensity (i.e. load, jumps, etc.) in combination with low rest between exercises (Smith, Sommer, Starkoff, & Devor, 2013). A very well known example of this type of training is Crossfit®. Recurring to this methodology, Smith et al. (2013) verified significant increases in VO2max after 10 weeks of
training. As reported by the authors, these increases were similar to previously research on HIIT and therefore a valid alternative when increases in maximal aerobic power are desired.
An increase in muscle size is expected as adaptation to resistance training. While historically studies of skeletal muscle required the dissecation of cadavers (Friederich & Brand, 1990; Lieber, Fazeli, & Botte, 1990; Wickiewicz, Roy, Powell, & Edgerton, 1983), progresses in imaging techniques and collecting of needle muscle biopsies allows for a better and more practical understanding of skeletal muscle function and structure. Given this, an increase in single muscle fibers cross sectional area (CSA) is expected after strength training (Aagaard et al., 2001; Akima et al., 1999; Andersen & Aagaard, 2000; Hikida et al., 2000; Sharman et al., 2001; Staron et al., 1994; Volek et
al., 1999), whereas type II muscle fibers generally demonstrate greater increases in comparison to type I. More specifically a shifting of type IIX/B to type IIA is commonly observed after resistance training (Andersen & Aagaard, 2000; Hikida et al., 2000; Sharman et al., 2001). While needle biopsies are required to obtain a sample of the tissue for further analysis of single muscle fibers (i.e. microscopic level), less invasive methods can be used to obtain information of muscle size at a macroscopic level. Magnetic resonance imaging (MRI) or ultrasonography (US) are examples of equipment used by researchers to analyze muscle at a macroscopic level. From a macroscopic point of view, an increase in muscle size measured as muscle thickness (MT) (Kawakami, Abe, Kuno, & Fukunaga, 1995; Matta, Simão, & Salles, 2011; Starkey et al., 1996), physiological cross sectional area (PCSA) (Aagaard et al., 2001; Kawakami et al., 1995), anatomical cross sectional area (ACSA) (Aagaard et al., 2001; Kawakami et al., 1995; Rutherford & Jones, 1992) or muscle volume (Aagaard et al., 2001; Kawakami et al., 1995) can be observed as a result of resistance training. As non-linear changes in muscle size between muscles from the same muscle group (e.g. quadriceps) and even within the same muscle (e.g. vastus lateralis) have been reported, assessments of the muscle along its entire length are recommended (Blazevich, Gill, Bronks, & Newton, 2003; Häkkinen et al., 2001; Housh, Housh, Johnson, & Chu, 1992; McMahon, Morse, Burden, Winwood, & Onambélé-Pearson, 2013; Reeves, Narici, & Maganaris, 2004). Although muscle size is expected to increase as adaptation to resistance training, different magnitudes are reported in literature. Adaptations on muscle size are sensible to some training variables as training volume, type of contraction (Blazevich, Cannavan, Coleman, & Horne, 2007; Seynnes, de Boer, & Narici, 2007; Tesch, Ekberg, Lindquist, & Trieschmann, 2004), velocity/time under tension (Cormie, McGuigan, & Newton, 2010) or range of motion (Bloomquist et al., 2013; McMahon et al., 2013).
Muscle size and muscle force production are strongly influenced by fascicles arrangement (muscle architecture) within the muscle (Alegre, Jiménez, Gonzalo-Orden, Martín-Acero, & Aguado, 2006). Although previously cadaveric studies analyzed organization of fascicle geometry (Friederich & Brand, 1990; Lieber, Fazeli, & Botte, 1990; Wickiewicz, Roy, Powell, & Edgerton, 1983), progresses in imaging technology allows researchers to analyze it in vivo. Normally ultrasonography is the technique of choice for this type of assessments. Basically, a sonogram
(ultrasonography image) is obtained from the echo of an emitted ultra-sound reflex on the different tissues and fascicle pennation angle (PA) and fascicle length (FL) are measured. Pennation angle (PA) is the angle measured between the fascicle and deep aponeurosis and fascicle length corresponds to the length of the fascile measured from the deep to superficial aponeurosis (Abe, Brown, & Brechue, 1999; Kawakami, Abe, & Fukunaga, 1993; Kumagai et al., 2000; Nimphius, McGuigan, & Newton, 2012). These parameters of fascicle geometry have some functional implications for muscle force production. Increases in strength arising from a traditional training intervention can be in part explained by the increase in PCSA (Aagaard et al., 2001; Fukunaga, Roy, Shellock, Hodgson, & Edgerton, 1996; Fukunaga et al., 2001). Because PCSA represents the amount of contractile material arranged in parallel (Wickiewicz et al., 1983), changes in the insertion angle of the fascicles (pennation angle) in aponeurosis strongly influence it (Aagaard et al., 2001). Therefore, an increase in PA is commonly observed as response to resistance training (Aagaard et al., 2001; Gondin, Guette, Ballay, & Martin, 2005; Kanehisa et al., 2002; Kawakami et al., 1995; Matta et al., 2011; Narici, 1999) (Figure 1). An increase in FL as chronic response to resistance training is also reported by some authors (Alegre, Jiménez, Gonzalo-Orden, Martín-Acero, & Aguado, 2006; Blazevich, Cannavan, et al., 2007; Narici et al., 2011; Potier, Alexander, & Seynnes, 2009; Reeves et al., 2004; Seynnes et al., 2007). Because the total distance shortened by a muscle fiber results from the product of each sarcomere displacement by the number of sarcomeres (Narici, 1999) an increase in FL is expected to enable for a greater contraction velocity (Burkholder, Fingado, Baron, & Lieber, 1994; Lieber & Fridén, 2000, 2001; Narici, 1999).
Therefore, there is a tendency for a functional adaptation on muscle architecture to load characteristics of the training program. While high velocity of shortening protocols leads to an increases on FL (Alegre et al., 2006; Blazevich et al., 2003), high load/low velocity protocols lead to greater increase on PA and muscle size (Aagaard et al., 2001; Blazevich & Giorgi, 2001; Gondin et al., 2005; Kawakami et al., 1995; Matta et al., 2011; Narici et al., 2011; Reeves et al., 2004; Seynnes et al., 2007). Therefore, adaptation of muscle architecture parameters seems to be dependent on the velocity (Alegre et al., 2006; Blazevich et al., 2003), type of contraction (Blazevich, Cannavan, et al., 2007; Franchi et al., 2014), range of motion (McMahon et al., 2013), duration of the training protocol and training background of the subjects
(Rønnestad, Kojedal, Losnegard, Kvamme, & Raastad, 2011). The majority of interventions studies on muscle architecture used isotonic training. Also isokinetic (Baroni et al., 2013; Blazevich, Cannavan, et al., 2007; Blazevich, Gill, Deans, & Zhou, 2007) or non-gravity-dependent equipment (Seynnes et al., 2007) has been used. The differences on the mechanical load characteristics induced by the equipment seems to have an important role in the observed results (Franchi et al., 2014). Particularly on isokinetic studies, the type of contraction and the preset dynamometer velocity seem to lead to different adaptations or magnitude of those. Concentric only (Blazevich, Cannavan, et al., 2007), eccentric only (Baroni et al., 2013; Blazevich, Cannavan, et al., 2007) or concentric/eccentric contractions protocols (Blazevich, Gill, et al., 2007) can be observed in scientific literature. In our best knowledge, only low isokinetic velocities as 30º/s (Blazevich, Cannavan, et al., 2007) or 60º/s (Baroni et al., 2013; Blazevich, Gill, et al., 2007) have been used in muscle architecture literature. Together with the type and isokinetic velocity of contraction, also the duration and volume (sets x reps) of the intervention difficult the comparison of results between the few muscle architecture studies that used such equipment. Because fascicles geometry adaptations, essentially fascicle length (McMahon et al., 2013), are sensible to training range of motion (ROM), higher muscle excursions (~90-100º) in comparison to those observed on everyday routine were used on isokinetic studies (Baroni et al., 2013; Blazevich, Cannavan, et al., 2007; Blazevich, Gill, et al., 2007).
While the effects of training with either high or low loads have been studied (Aagaard et al., 2001; Alegre et al., 2006; Blazevich et al., 2003; Kawakami et al., 1995; Reeves et al., 2004; Seynnes et al., 2007), to our best knowledge no other study examined changes in muscle size and architecture parameters to more functional training programs (wider range of training velocities). Moreover, in our best knowledge, only two other studies analyzed the effect of ROM on muscle size and fascicle arrangements on lower body. However, in both studies there was no equalization of training volume between training groups. In our study training volume was equalized between the full and partial ROM, allowing us to better understand the influence of ROM on muscle adaptation.
Figure 1. An example of changes in pennation angle from pre (13.7º) to post-training
(20.4º).
1.2. Purpose of the study
The main purpose of the present study was to investigate changes in muscle size, fascicle geometry and knee extension maximal torque, induced by concentric isokinetic training with different range of motion. In more detail, our research questions were:
1- Does different range of motion isokinetic training exercises influences changes in muscle size?
2- Is there a heterogeneous hypertrophy on VL adaptation to isokinetic range of motion training?
3- Are changes in fascicle geometry mediated by different range of motion isokinetic training exercises?
4- Does different range of motion isokinetic training exercises influences knee extension maximal torque?
The present study is part of a larger research project on Strength Training and Muscle Architecture, which is the PhD work of Drª. Maria João Valamatos. The present study have only analysed a limited number of variables (muscle size, pennation angle and maximal isometric torque) and the effects of one single experimental condition (concentric contraction).
1.3. Relevance of the study
Longitudinal and transversal studies concerning muscle size and architecture can be found in the literature. Transversal studies demonstrate the existent relationships between muscle size, fascicle geometry and performance (Abe, Fukashiro, Harada, & Kawamoto, 2001; Abe, Kumagai, & Brechue, 2000; Kawakami et al., 1993; Kumagai & Abe, 2000; Maughan, Watson, & Weir, 1984). Examples are the observed correlations between muscle size and maximum force (Maughan et al., 1984) and FL and sprint performance (Abe, Fukashiro, Harada, & Kawamoto, 2001; Kumagai et al., 2000), or the greater PA observed in bodybuilders in comparison to untrained subjects (Kawakami et al., 1993) and the greater FL verified in professional sprinters when compared to distance runners (Abe, Kumagai, & Brechue, 2000). On other hand, longitudinal studies concerned on comparing the influence of different training variables on muscle size and architecture adaptation (Aagaard et al., 2001; Blazevich & Giorgi, 2001; A. Blazevich, Cannavan, et al., 2007; McMahon et al., 2013). These adaptations on PA, FL and muscle size have been suggested to be dependent of a number of training variables. Additionally, strength training background of the subjects, have been reported as an important influencing factor (Rønnestad et al., 2011). The training velocity (Alegre et al., 2006; Blazevich et al., 2003), the type of muscle contraction (Blazevich, Cannavan, et al., 2007; Franchi et al., 2014) and more recently the range of motion (McMahon et al., 2013) of training exercises, are examples of some training variables that can influence how the skeletal muscle structurally adapts to resistance training. Generally, when subjects are exposed to very high loads stimulus (e.g. strength training), muscle size and PA tends to increase (Aagaard et al., 2001; Kawakami et al., 1995; Reeves et al., 2004; Seynnes et al., 2007). Contrariwise, when the loads are smaller allowing for higher contraction velocities, increases on muscle length and FL are expected (Alegre et al., 2006; Blazevich et al., 2003). Controversial results have been reported in the literature concerning the type of contraction, with eccentric training demonstrating lower (Franchi et al., 2014), or greater (Blazevich, Cannavan, et al., 2007) increases in PA when compared to concentric training. Differences on the type of training (isotonic vs. isokinetic) can be responsible for this distinct finding (Franchi et al., 2014). Also non-significant differences in FL between concentric and eccentric groups were found in the study of Blazevich, Cannavan, et al. (2007), whereas a greater increase in
eccentric training in comparison to concentric training was reported by Franchi et al. (2014). A higher magnitude of increase on FL was reported by Potier et al. (2009) as a result of 8 week of eccentric training in comparison to those who trained eccentrically in the studies of Blazevich, Cannavan, et al. (2007) and Franchi et al. (2014) (respectively 33,5% vs. 3,1% vs. 12%). The authors explained such differences in the magnitudes as the specificity of the studied muscle (i.e. biceps femoris vs. vastus lateralis). Different magnitudes and controversial results on the adaptations of the PA and FL have been reported in literature. This can be attributed to the characteristics of the training protocols (volume, training intensity or duration of the intervention) (Blazevich, Cannavan, et al., 2007; Blazevich, Gill, et al., 2007) the type of equipment used (e.g. isokinetic, isotonic, etc.) (Blazevich, Cannavan, et al., 2007; Franchi et al., 2014) or the studied muscle (Blazevich, Cannavan, et al., 2007; Potier et al., 2009).
In our best knowledge only two studies have analyzed muscle architecture (both VL) adaptations to differences in ROM (Bloomquist et al., 2013; McMahon et al., 2013). Both authors reported no differences in PA between ROM interventions (Bloomquist et al., 2013; McMahon et al., 2013). Fascicle length was only measured on the study of McMahon et al. (2013). The authors verified greater significant increases on all measured regions (25, 50 and 75%) in both training groups (large and short ROM group) with the larger ROM group demonstrating higher increases in FL measured at 50 and 75% of total muscle length. Therefore the authors concluded that differences on training ROM are responsible for specific adaptions on FL along muscle length. Previous studies analyzed the effect of ROM using either free weights, machines and bodyweight exercises (McMahon et al., 2013) or squat only exercise (Bloomquist et al., 2013). A more controlled approach (single-joint exercise) might advised to better address the influence of ROM on muscle structure adaptation. Therefore, we have choosen a single-joint exercise (knee extension) as the only exercise of our training intervention. Moreover, given the force-length and force-velocity relationship we trained the subjects on an isokinetic dynamometer so these two variables do not interfere with our findings. In previous research of muscle architecture and muscle size adaptation to ROM interventions, the training volume was not equalized (Bloomquist et al., 2013; McMahon et al., 2013) between groups. In the present study, training volume was equalized between training groups (full vs. partial ROM) using
time under tension (TUT). This allowed us to have greater certainty that any differences between groups resulted from the manipulation of the range of motion.
1.4. Assumptions and Limitations
The most important assumptions of this study were:
• In the beginning, all subjects were physically active but had no experience in regular and systematic strength training on the 6 months before the beginning of the present study;
• Exclusion criteria of this study included the presence of any muscular or orthopedic pathology on the lower body;
• Subjects performed no additional lower body resistance training during the training intervention;
• An attendance of at least 90% of the planned number of sessions, without missing twice in a row, was a requirement for the maintenance of the participants on the present study;
• In order to do not conflict with the intervention, the period of adaptation to the isokinetic exercise used for training was sufficient for subjects acquire the necessary technique.
As it happens with the majority of the studies, especially when the experimental design includes a training intervention, the more relevant limitations of the present study were:
• Difficulties were found on PA observation of VL in a proximal and distal region. Therefore, data from both regions were not included in the present study;
• In order to better understand how VL adapts during the 15 weeks of training, it would have been interesting to have intermediate measures of muscle size, PA and knee extension maximal torque;
• The fact that fascicle length was not assessed in the present study limits our understanding on how VL adapts structurally to ROM training.
• Given the heterogeneous hypertrophy of quadriceps muscle group to resistance training, our findings on VL may not reflect whole muscle group adaptation.
2. Review of literature
2.1. Skeletal muscle structure
Structural adaptations in skeletal muscle are expected as response to strength training. These have been assessed at different levels ranging from microscopic – muscle fiber (Aagaard et al., 2001; Akima et al., 1999; Andersen & Aagaard, 2000; Hikida et al., 2000; Sharman et al., 2001; Staron et al., 1994; Volek et al., 1999) to macroscopic evaluation – muscle size (Aagaard et al., 2001; Kawakami et al., 1995; Matta et al., 2011; Rutherford & Jones, 1992; Starkey et al., 1996). Through muscle resections by biopsies researchers can evaluate some properties of the muscle cell. Although quite detailed, this technique presents a clear difficulty, which is the level of intrusion necessary to obtain the sample of the tissue. Also, the analysis of the sample obtained can be erroneuos given the heterogeneus adaptations observed on different muscle regions (Blazevich et al., 2003; Häkkinen et al., 2001; Housh et al., 1992; McMahon et al., 2013; Narici, Hoppeler, et al., 1996; Reeves et al., 2004). On the other hand, techniques that analyze muscle size (i.e. MT, PCSA, ACSA, muscle volume) are less intrusive. As we will see later in this literature review, the various existing techniques provide information with different level of accuracy and interest to researchers. Therefore some caution is recommended when comparing the results obtained by different techniques. Given its determinant role in muscle contraction, also the organization of the contractile material within the muscle has gained greater consideration by researchers. This arrangement of the fascicles is usually termed muscle architecture or fascicle geometry (Kawakami et al., 1995; Lieber & Fridén, 2000, 2001; Mairet, Maïsetti, & Portero, 2006).
2.1.1. Muscle architecture definitions
In the Human skeletal musculature there are as many different architectural arrangements as the number of muscles (Lieber & Fridén, 2000, 2001). Roughly, there can be distinct two main classes of skeletal muscles according to the arrangement of their fibers: the fusiform or parallel muscles (e.g. biceps brachii)
whose fibers are oriented in parallel to the line of action of the muscle (Jones, Rutherford, & Parker, 1989; Narici, 1999) and the pennate muscles where fibers insert in the aponeurosis with a certain angle to the line of tension (Jones et al., 1989; Kawakami et al., 1995; Kawakami, Ichinose, & Fukunaga, 1998; Narici, 1999). Pennate muscles can be further divided into unipennate muscles (e.g. semi-membranous) and multipennate muscles (e.g. deltoid) depending respectively if muscle fibers insert in aponeurosis at a single or several angles (Lieber & Fridén, 2000, 2001). As we will see later, this angle that characterize the pennate muscles, has a determining role in muscle function.
Normally included measurements of muscle architecture are: pennation angle, wich is the angle measured between the fascicle and deep aponeurosis; and fascicle length (Abe et al., 1999; Kawakami et al., 1993; Kumagai et al., 2000; Nimphius et al., 2012). Given the close relation with the muscle structure, these two parameters are usually related to one or more indicators of muscle size, as physiological/anatomical cross-sectional area or muscle thickness (Aagaard et al., 2001; Blazevich, Cannavan, et al., 2007; Blazevich, Gill, et al., 2007; Reeves et al., 2004). Figure 2 shows an image obtained through ultrasonography where PA, FL and MT can be distinguished.
Figure 2. A sonograph of vastus lateralis with architectural parameters.
2.2. Measuring of muscle structure
2.2.1. Muscle architecture measurement
Historically, the architecture of skeletal muscle has been described using data obtained in directed dissection of cadavers (Friederich & Brand, 1990; Lieber et al., 1990; Wickiewicz et al., 1983). However, studies in vitro can have some issues like
the shrinkage from maceration, the limited number of fibers that are measured which may not be representative of the muscle, or the fragility of some fibers from certain muscles (Friederich & Brand, 1990). Rutherford & Jones (1992) also suggest that some changes in the angle of the fibers might be expected due the process of fixation. Other limitation of the in vitro measuring is the obvious inability to study the effect of muscle contraction or changes in the joint position in muscle architecture, which are known to change even during isometric actions (Fukunaga, Ichinose, Ito, Kawakami, & Fukashiro, 1997; Kawakami et al., 1998; Muramatsu, Muraoka, Kawakami, Shibayama, & Fukunaga, 2002; Narici, Binzoni, et al., 1996).
Progress in technology, such as ultrasonography (Aagaard et al., 2001; Abe et al., 2001; Blazevich & Giorgi, 2001; Blazevich, Cannavan, et al., 2007; Kawakami et al., 1995, 1998; Narici, Binzoni, et al., 1996; Rutherford & Jones, 1992) or magnetic resonance imaging (Aagaard et al., 2001; Kawakami et al., 1995; Narici, Binzoni, et al., 1996) allowed to measure the architectural parameters in vivo, both at rest (Aagaard et al., 2001; Alegre et al., 2006; Blazevich & Giorgi, 2001; A. Blazevich, Gill, et al., 2007; Gondin et al., 2005; Kawakami et al., 1995; Matta et al., 2011; Narici et al., 2011) and during contraction (Fukunaga, Ichinose, et al., 1997; Kawakami et al., 1998; Muramatsu et al., 2002; Narici, Binzoni, et al., 1996). Since ultrasound is a minimally invasive, viable method and not expensive, it has been widely used in the literature (Kawakami et al., 1993; Narici, Binzoni, et al., 1996). To check the accuracy of the US technique, Narici, Binzoni et al. (1996) Compared ultrasound-determined muscle architecture with direct measurement. The authors found no significant differences in PA, FL and MT, concluding that a good agreement exists between both techniques. Also, Kawakami et al. (1993) found no major differences in US measurements and manual measurements on three human cadavers in both MT (0-1 mm) and PA (0-1º). Therefore, viable measures can be expected when using ultrasonography to determine muscle architecture parameters.
2.2.1.1. Measuring of fascicle length
The length of a fascicle is measured from aponeurosis to aponeurosis and can be obtained directly using longitudinal ultrasonic images as seen in Figure 2 (Fukunaga, Ichinose, et al., 1997; Kawakami, Abe, Kanehisa, & Fukunaga, 2006; Kawakami et
al., 1998). However, because sometimes the fascicles are too long to be observed directly, its length has been estimated through equations (Fukunaga et al., 2001; Kawakami et al., 1995; Kumagai et al., 2000; Mairet, Maïsetti, & Portero, 2006; Nimphius et al., 2012) or extrapolating from the identifiable end of a fascicle to a line drawn from the superficial aponeurosis (Blazevich, Cannavan, et al., 2007; Narici, 1999; Potier et al., 2009; Reeves et al., 2004). Normally the equation used for the estimation of FL is a trigonometric equation: FL = MT (sin θ)-1, where θ is the fascicle angle between the fascicle and deeper aponeurosis (Fukunaga et al., 2001; Kawakami et al., 1995; Kumagai et al., 2000; Nimphius et al., 2012). The average of the PA measured using superior and deep aponeurosis can also be used. However, no different results using one or other method seems to exist (Mairet et al., 2006). Although this method is widely used in literature, caution must be taken when estimating FL through either extrapolation or equation as fascicles might have a curvilinear aspect (Kawakami et al., 1993, 1995; Muramatsu et al., 2002). Since the sonograms results from the echo of the emitted ultra-sound reflex, a different placing of the probe can also give erroneous measurements. Moreover, differential longitudinal or transversal collocation of the probe in different occasions can display different regions of the muscle. Being that, it’s strongly recommended that the technician is well trained handling the probe and the chosen locations for observation are mapped both longitudinally and transversely (Blazevich, Cannavan, et al., 2007; Blazevich, Gill, et al., 2007).
2.2.1.2. Measuring of pennation angle
As aforementioned, in the pennate muscles the fascicles inserts in the aponeurosis with a certain angle, thus they are arranged obliquely to the line of force production (Jones et al., 1989; Kawakami et al., 1995, 1998; Narici, 1999). This angle (PA), which can be measured through ultrasonography as the angle between deep aponeurosis and the fascicles (Abe et al., 1999; Kawakami et al., 1993; Kumagai et al., 2000; Nimphius et al., 2012), allows more contractile material to be attached in a given area (Jones & Rutherford, 1987; Kawakami et al., 1995; Lieber & Fridén, 2001). Being that, a positive correlation between the fascicle angle and muscle size measured as the anatomical cross-sectional area (Rutherford & Jones, 1992), muscle thickness (Fukunaga, Kawakami, Kuno, Funato, & Fukashiro, 1997; Kawakami et al.,
1993, 2006, 1995; Kubo et al., 2003) and muscle volume (Aagaard et al., 2001), can be observed. Some authors however found no correlations (Alegre et al., 2006; Kearns, Abe, & Brechue, 2000) between MT and PA. The relationship between MT and PA seems to be dependent on different muscles and populations used for study (Kearns et al., 2000).
2.2.2. Measuring of muscle size
In literature, muscle size has been measured through differents methods (i.e. PCSA/ACSA, MT, muscle volume) with authors using one (Kawakami et al., 1993, 2006, 1995; Rutherford & Jones, 1992) or more (Aagaard et al., 2001; Fukunaga et al., 2001) techniques. Muscle thickness, is the perpendicular distance between the superficial and deep aponeurosis (Figure 2) and can also be obtained through ultrasonography (Abe et al., 1999, 2001; Kawakami et al., 1993; Kumagai et al., 2000; Mairet et al., 2006). This technique is held to be accurate, reproducible (Kawakami et al., 1993; Narici, Binzoni, et al., 1996), and it is regarded to have highly significant correlations with muscle anatomical cross-sectional area, which is a good indicator of muscle size (Martinson & Stokes, 1991). Also ACSA and PCSA are commonly used to determine muscle size, however some considerations must be taken in order to use one or the other measure of muscle size (Aagaard et al., 2001; Fukunaga et al., 1996; Fukunaga et al., 2001; Rutherford & Jones, 1992). Because the maximal force that skeletal muscle is capable to generate is proportional to the number of sarcomeres arranged in parallel (Gans & De Vree, 1987; Jones & Rutherford, 1987; Narici, 1999), the PCSA which include all the muscle fibers at right angles to their long axes (Fukunaga et al., 1996; Kawakami et al., 1995; Narici, 1999), seems to be the most precise method of assessing muscle size in relationship to muscle force (Aagaard et al., 2001; Lieber & Fridén, 2000). Therefore higher correlations were found between force and PCSA than force and ACSA (Aagaard et al., 2001; Fukunaga et al., 1996; Fukunaga et al., 2001). Nevertheless strong correlations do exist between ACSA and force (Aagaard et al., 2001; Fukunaga et al., 1996; Fukunaga et al., 2001; Maughan, Watson, & Weir, 1984).
Because it is impossible to measure all CSA fibers directly, the PCSA has been obtained from biopsy samples of the muscle (Aagaard et al., 2001) or estimated
through formulas (Blazevich, Cannavan, et al., 2007; Fukunaga et al., 1996; Fukunaga et al., 2001; Kawakami et al., 1994, 1995; Reeves et al., 2004). In order to predict the PCSA is necessary to determine muscle volume, fascicle length and in case of pennate muscles the pennation angle ( Blazevich, Cannavan, et al., 2007; Fukunaga et al., 1996; Fukunaga et al., 2001; Kawakami et al., 1994, 1995; Reeves et al., 2004). Muscle volume can be calculated by summing the various slices of ACSA along muscle length, obtained through MRI (Blazevich, Cannavan, et al., 2007; Fukunaga et al., 2001; Kawakami et al., 1994, 1995) or US (Reeves et al., 2004) and multiplied by the interval of each slice thickness (Reeves 2004; Kawakami 1995; Kawakami 1994). PA and FL can be measured by US and together with volume, PCSA can be determined: PCSA = Volume x cos θ x FL-1 (Blazevich, Cannavan, et al., 2007; Fukunaga et al., 2001, 1996; Kawakami et al., 1994, 1995).
On the other hand ACSA can be measured directly using MRI. Authors normally chose to use a single or several slices along whole muscle length (Blazevich, Cannavan, et al., 2007; Carey Smith & Rutherford, 1995; Häkkinen et al., 2001; Housh, Housh, Johnson, & Chu, 1992; Narici, Hoppeler, et al., 1996; Reeves et al., 2004). When using a single slice to represent muscle size, normally authors chose the one located at half distance of the muscle (Aagaard et al., 2001; Alegre et al., 2006; Blazevich & Giorgi, 2001; Blazevich, Cannavan, et al., 2007; Gondin et al., 2005; Narici et al., 2011), or the one that corresponds to the maximum CSA (Kanehisa et al., 2002; Kawakami et al., 1995). When one image is chosen to represent muscle size, careful must be taken because an heterogeneous hypertrophy as been demonstrated in some muscles (Blazevich, Cannavan, et al., 2007; Blazevich et al., 2003; Carey Smith & Rutherford, 1995; Häkkinen et al., 2001; Kawakami et al., 1995; Matta et al., 2011; Reeves et al., 2004; Seynnes et al., 2007), but not in others (Blazevich, Cannavan, et al., 2007; Matta et al., 2011; Reeves et al., 2004). Therefore, in some muscles (e.g. triceps brachii) CSA from a single slice seems to reflect the increases in whole muscle size (Kawakami et al., 1995; Matta et al., 2011). Specifically in the quadriceps muscles, an heterogeneous hypertrophy in the muscles along their lengths have been observed (Blazevich, Cannavan, et al., 2007; Blazevich et al., 2003; Carey Smith & Rutherford, 1995; Häkkinen et al., 2001; Housh et al., 1992; Narici, Hoppeler, et al., 1996; Reeves et al., 2004; Seynnes et al., 2007). Thus, when the objective is to verify
the adaptations in muscle size, heterogeneous hypertrophy should be taken into account.
It seems that different usage of muscle size measures may lead to misleading conclusions about the size of the muscle and the force produced. This can be demonstrated by the disproportionate strength increases in comparison to some muscle size measures (ACSA) but not others (PCSA) (Aagaard et al., 2001). Although ACSA, PSCA, MT or muscle volume reflect muscle size and can be used to evaluate the adaptations to resistance training, when the objective is to assess the characteristics or functional adaptations with relation to muscle size (i.e. Specific force – muscle force.PSCA-1; Kawakami et al., 1994, 1995), the use of PSCA appears more coherent since stronger correlations exist for PSCA and force than for ACSA and force (Fukunaga et al., 2001, 1996; Narici, 1999). As discussed, this can be observed beacause PCSA accounts with some parameters (i.e. arrangement of the fascicles) that strongly influenciate force production (Aagaard et al., 2001; Lieber & Fridén, 2000).
2.3. Functional implications of skeletal muscle architecture
Parameters of muscle architecture have been extensively studied with regard to muscle function, such as the ability to produce force (Lieber & Fridén, 2000, 2001). These architectural parameters are known to play an important role in the muscle function (Abe et al., 2001; Kawakami et al., 1994, 1993; Kumagai et al., 2000) even greater than the biochemical proprieties of the muscle cells (Burkholder, Fingado, Baron, & Lieber, 1994; Lieber & Blevins, 1989), and appear to be specialized according to their function (Lieber & Fridén, 2000, 2001; Wickiewicz et al., 1983). Generally, muscles with larger pennation angles and/or shorter fascicles appear to be more able to produce high values of force (Kawakami et al., 1993; Lieber & Blevins, 1989; Lieber & Fridén, 2000, 2001), while muscles with smaller pennation angles and/or longer fascicles are more likely to produce force with higher velocity of contraction (Lieber & Fridén, 2000, 2001). Since larger pennation angles allow a great number of sarcomeres in parallel (Jones & Rutherford, 1987; Kawakami et al., 1993, 1995; Lieber & Fridén, 2001; Rutherford & Jones, 1992), and knowing that force is proportional to the amount of contractile material arranged in parallel (Gans
& De Vree, 1987; Jones & Rutherford, 1987; Narici, 1999), an increase in pennation angle is expected to be accompanied by an increase in force (Aagaard et al., 2001; Fukunaga et al., 2001; Narici, 1999). However, since the fascicles insert obliquely in the aponeurosis only part of the force produced by the fibers (fiber force x cos θ) will be actually transferred to the tendon (Blazevich, 2006; Gans & Gaunt, 1991; Kawakami et al., 1995; Lieber & Fridén, 2001; Maughan et al., 1984; Narici, 1999; Rutherford & Jones, 1992). Although, this effect is minimal in muscles with moderate pennation angles (Blazevich, 2006; Lieber & Fridén, 2001), such as those observed in human cadavers dissection (Friederich & Brand, 1990; Lieber et al., 1990; Wickiewicz et al., 1983). For example, a muscle with the fascicles oriented at a 30º angle to force-generation axis, would only transmit a portion (87%) of their force as: tendon force = muscle force x cosine 30º = 0,87 force produced (Lieber & Fridén, 2001).
Since fibers of the pennated muscles rotate during contraction (Fukunaga et al., 1997; Gans & Gaunt, 1991; Kawakami et al., 1998), increases in the pennation angle allow a greater tendon excursion for a given length of fiber shortening (Muhl, 1982). This rotation of pennate muscle fibers also allow a lower velocity of fiber shortening for a given muscle shortening velocity, which results in increased capacity for force production given the length-tension (Blazevich & Giorgi, 2001; Blazevich et al., 2003; Blazevich, Gill, & Zhou, 2006; Gans & Gaunt, 1991; Muhl, 1982) and force-velocity proprieties of the muscle (Blazevich & Giorgi, 2001; Blazevich et al., 2003, 2006; Kawakami et al., 1993).
If in one hand PA is closely related to the production of high values of force, on the other fascicle length has a major contribution on the velocity of contraction. Therefore, there is a good agreement in the proportionality of a sarcomere length and its shortening velocity, where longer fascicles are associated with an increased contraction velocity (Burkholder et al., 1994; Lieber & Fridén, 2000, 2001; Narici, 1999). This is easily understandable because the total distance shortened by a fiber results from the product of each sarcomere displacement by the number of sarcomeres (Narici, 1999). In a study from Kumagai et al. (2000), the authors schematically presented the differences in the contraction velocity of two muscles with different fascicles length (8.07 and 6.55 cm). On their model, the authors assumed a muscle
shortening of about 10% of the fascicle length and a 250-ms duration of the muscular shortening. The shorter fascicle (6.55 cm) would shorten approximately 0.66 cm which results in a tendon excursion of 0.68 cm and a muscle shortening velocity of 2.72 cm/s. The longer fascicle (8.07 cm) would shorten 0.81 cm resulting in a tendon excursion of 0.83 cm and a muscle shortening velocity of 3.31 cm/s. Therefore, contraction of a muscle with longer fascicles will result in greater tendon excursion for the same relative shortening of each sarcomere, or in other words, a greater velocity of muscle shortening (Blazevich et al., 2006; Kumagai et al., 2000; Lieber & Fridén, 2001; Narici, 1999). Also, because for a muscle shortening at a given velocity the individual sarcomeres of a longer fiber (i.e. with more sarcomeres in series) has a slower contraction velocity, it allows the fiber to operate in a advantageous situation on its force-velocity curve (Lieber & Fridén, 2000, 2001)
2.4. Influence of range of motion on resistance training
Range of motion is one of the training variables that should be taken into account when designing resistance-training programs. Manipulation of ROM had been suggested for specific performance goals, as the usage of half squats for short sprints or quarter squats for maximum sprints (Young, Benton, Duthie, & Pryor, 2001) or partial amplitude bench press when seeking for increases on peak force and/or decreasing on deceleration at the end range of the movement (Clark, Bryant, & Humphries, 2008). Regarding this, both acute (Clark et al., 2008; Clark, Umphries, Ohmann, & Bryant, 2011; Mookerjee & Ratamess, 1999) and chronic responses (Bloomquist et al., 2013; Graves et al., 1992; Graves, Pollock, Jones, Colvin, & Leggett, 1989; Kubo et al., 2006; Massey & Vincent, 2004, 2005; McMahon et al., 2013; Pinto et al., 2012; Weiss, Fry, Wood, Relyea, & Melton, 2000) to training have been studied.
Regarding strength adaptations to different ROM interventions, controversial results have been found. While some authors report specific increases on the amplitude used for training (Bloomquist et al., 2013; Clark et al., 2011; Graves et al., 1989; Kubo et al., 2006; Massey & Vincent, 2005; McMahon et al., 2013; Pinto et al., 2012; Weiss et al., 2000) others do not observed such specificity (Graves et al., 1992; Massey & Vincent, 2004). The superiority observed in those who trained with a full (or larger)
ROM can partly be explained by greater increases in muscle size (e.g. CSA) (Bloomquist et al., 2013; McMahon et al., 2013). Differences on muscle size arising from ROM training are suggested to result from the greater stress and lengthening of the sarcomeres as result of training with or at a greater ROM (Kubo et al., 2006; McMahon et al., 2013). Specific adaptations on architectural parameters can also be found as chronic response to different ROM resistance training (Bloomquist et al., 2013; McMahon et al., 2013). Nevertheless, in our best knowledge none of the referred studies equalized training volume. Time under tension is well known to strongly influence muscle hypertrophy (Burd et al., 2012; Schoenfeld, 2010, 2013), therefore, training with greater amplitude for the same volume (sets and repetitions) will expose muscles to higher time under tension. Even that force production is higher when using lower ROM training, the increased displacement of the resistance results on a greater mechanical work (Clark et al., 2008). Being that, differences observed previously between ROM groups can be justified by differences in TUT rather then the manipulation of the training amplitude. Adaptations on muscle size and architectural parameter as response to ROM resistance training can be found in Table 1. An extensive understanding of muscle size and fascicle geometry adaptation concerning ROM resistance training can be found in the following chapters of this bibliographic revision.
2.5. Musculature plasticity to resistance training
It is well accepted that skeletal muscles are liable to adapt as a response to a mechanical stimulus (Aagaard et al., 2001; Alegre et al., 2006; Blazevich & Giorgi, 2001; Blazevich, Cannavan, et al., 2007; Gondin et al., 2005; Kawakami et al., 1995; Matta et al., 2011; Narici et al., 2011; Potier et al., 2009; Reeves et al., 2004; Rutherford & Jones, 1992). To address this, differences in architectural parameters have been investigated concerning to performance (Abe et al., 2001; Kumagai et al., 2000), differences between populations (Kawakami et al., 1993; Kearns et al., 2000) or as response to training (Aagaard et al., 2001; Blazevich, Gill, et al., 2007; Kawakami et al., 1995; Matta et al., 2011; Nimphius et al., 2012; Rutherford & Jones, 1992; Starkey & Pollock, 1996) and detraining (Blazevich, Cannavan, et al., 2007; Fukunaga et al., 2001). A summary of both architectural and muscle size adaptations to different types of resistance training can be seen in Table 2. Typically adaptations
arising from resistance training are increases in pennation angle and muscle size (Aagaard et al., 2001; Gondin et al., 2005; Kanehisa et al., 2002; Kawakami et al., 1995; Matta et al., 2011; Narici, 1999). Also, an increases in FL as response to resistance training were reported by some authors (Alegre et al., 2006; Blazevich, Cannavan, et al., 2007; Narici et al., 2011; Potier et al., 2009; Reeves et al., 2004; Seynnes et al., 2007). Therefore, adaptation of muscle architecture parameters seems to be dependent on the velocity (Alegre et al., 2006; Blazevich et al., 2003), type of contraction (Blazevich, Cannavan, et al., 2007; Franchi et al., 2014), range of motion (McMahon et al., 2013), duration of the training protocol and training background of the subjects (Rønnestad et al., 2011).
2.5.1. Muscle size
Changes in muscle size are directly influenced by increases in muscle fiber size (hypertrophy) (Aagaard et al., 2001; Volek et al., 1999) and/or the arrangement of muscle fibers (or fascicles) within the muscle (Blazevich & Giorgi, 2001; Blazevich et al., 2003; Seynnes et al., 2007). While some authors attribute the increase in muscle size to the increase in FL (Baroni et al., 2013; Reeves et al., 2004), others attribute to an increase PA (Aagaard et al., 2001) or both FL and PA (Blazevich, Cannavan, et al., 2007). A scheme of differences on fascicles geometry adaptation leading to increases in MT can be observed on Figure 3. Increases in muscle size, measured as MT (Kawakami et al., 1995; Matta et al., 2011; Starkey et al., 1996), PCSA (Aagaard et al., 2001; Kawakami et al., 1995), ACSA (Aagaard et al., 2001; Kawakami et al., 1995; Rutherford & Jones, 1992) or muscle volume (Aagaard et al., 2001; Kawakami et al., 1995) has been shown to exist as an adaptation to training interventions. Moreover, physiological fiber area (hypertrophy) also increase as response to resistance training (Aagaard et al., 2001; Volek et al., 1999).
Figure 3. Different changes in FL and PA leading to similar increase in MT.
Hypertrophy of Human skeletal muscle fibers its well known to occur at the very beginning of a resistance training (Akima et al., 1999; Narici, Hoppeler, et al., 1996; Staron et al., 1994), and continue to increase until a plateau is reached as demonstrated by the inexistent of significant increases in more experienced individuals, as competitive weightlifters, powerlifers or bodybuilders (Hakkinen, Pakarinen, Alen, Kauhanen, & Komi, 1988; Häkkinen, Komi, Alén, & Kauhanen, 1987). Therefore, minor or absence of increases on muscle size are expected in subjects with greater training background (Ahtiainen, Pakarinen, Alen, Kraemer, & Häkkinen, 2003; Hakkinen et al., 1988; Häkkinen et al., 1987).
Differences on the onset of muscle size adaptations after training have been reported, where absence of early significant increases have been observed by some authors (Akima et al., 1999; Blazevich, Gill, et al., 2007), but not others (Baroni et al., 2013; Blazevich, Cannavan, et al., 2007; Seynnes et al., 2007; Tesch, Ekberg, Lindquist, & Trieschmann, 2004). Lack of early changes in muscle size can be attributed to the short duration of the intervention (Akima et al., 1999; Blazevich, Gill, et al., 2007), or differences on the training protocols (Blazevich, Cannavan, et al., 2007; Seynnes et al., 2007; Tesch et al., 2004). Akima et al. (1999) found no significant changes in CSA and fiber area of quadriceps femoris after 2 week of knee extension performed on isokinetic. Absence of early significant increases on MT were also found by Blazevich, Gill, et al. (2007) on the different portions of quadriceps muscle after 5
weeks of isokinetic knee extension (60º/s). However, Blazevich, Cannavan, et al. (2007) verified significant increases in MT of VL after 5 weeks (3 times per week) of isokinetic concentric and eccentric knee extension (30º/s). Muscle thickness of vastus medialis (VM) was also greater after training, although it was not enough to achieve a statistical significance. Because differential muscle hypertrophy within the same muscle group has been reported as response to a training program, it is possible for a muscle to achieve a significant increase but not the other (Blazevich, Cannavan, et al., 2007; Blazevich et al., 2003; Housh et al., 1992; Häkkinen et al., 2001; Narici, Hoppeler, et al., 1996; Seynnes et al., 2007). Lower isokinetic velocity is associated with greater time under tension and force (given the force/time relationship). Because both variables are known to be determinant for increases in muscle mass (Schoenfeld, 2010, 2013), the lower isokinetic velocity used by Blazevich, Cannavan, et al. (2007) in comparison to Blazevich, Gill, et al. (2007) (30º/s vs. 60º/s, respectively) may explain the observed differences on muscle size measured as MT. Similar findings were observed by Cormie, McGuigan, & Newton (2010) when comparing 10 weeks of either strength (75-90% RM) or power training (0-30% RM). While strength training (great time under tension and force) led to significant increases on MT of VL (after 5 and 10 weeks), power training led to no significant changes on MT. Nevertheless, Baroni et al. (2013), found significant increases in MT of VL and RF after 4 weeks of isokinetic eccentric training at the same velocity of Blazevich, Gill, et al. (2007) (60º/s). Methodological differences in the studies (i.e. 4 sets of 6 reps vs. 3 sets of 10 reps) are possible to be responsible for the observed differences between both studies. Also, Seynnes et al. (2007) and Tesch et al. (2004) found significant changes on quadriceps muscles size after a short-term intervention, during respectively 20 and 35 days. According to the authors, the early increases in muscle size might be obtained because of the type of resistance equipment (non-gravity-dependent – view Tesch et al., 2004 for further details) that allow for an eccentric overload in comparison to other type of equipment. This eccentric overload is associated with greater increases in muscle size (Farthing & Chilibeck, 2003; Higbie, Cureton, Warren, & Prior, 1996; Roig et al., 2009), and consequently more recommended when the goal is to increase muscle mass (Bird, Tarpenning, & Marino, 2005; Kraemer & Ratamess, 2004). Again, in both studies (Seynnes et al., 2007; Tesch et al., 2004) a heterogeneous hypertrophy on different portions of the same muscle group (quadriceps) was observed.