The impact of stronger patent
protection on innovation’s level
Joana Filipa Fernandes Pedro
Dissertation submitted in partial fulfillment of the requirements for the degree of MSc in Economics, at Universidade Católica Portuguesa, 2013
Supervisors
Prof. Hélder Vasconcelos Dr. Evaristo Mendes
ii
Abstrato
O objetivo principal desta tese é estudar o impacto que uma maior protecção das patentes tem no nível de inovação, utilizando dados transversais para Portugal, Europa e Estados Unidos da América. Como medida do nível de inovação foi usado o número de pedidos de patentes e para avaliar o nível de proteção do sistema de patentes foram usados vários índices de direitos de patentes, como é o caso do Índice de Ginarte e Park e o Índice de Direitos de Propriedade Intelectual. Os resultados evidenciam um efeito positivo entre o nível de protecção das patentes e o nível de inovação.
iii
Abstract
The main objective of this thesis is to study the impact of stronger patent protection on the innovation level using cross-sectional data for Portugal, Europe and United States of America. To measure the innovation level, this study uses the number of patent applications and for the strength of patent protection it uses a combination of patent rights index, including Ginarte and Park Index and Intellectual Property Rights Index. The results point to a positive effect between the level of patent protection and the innovation’s level.
iv
Aknowledgments
I would like to take this opportunity to thank all persons who have contributed in different aspects to make this thesis possible.
I would like to thank my thesis supervisor, Professor Hélder Vasconcelos for the support and important insights that helped to make this thesis possible.
I would also like to express my sincere appreciation to Dr. Evaristo Mendes for his patience, support and very useful insights on his professional knowledge regarding the patent system. His instructions were more useful than he may think.
My thanks also go to Tito Rendas who gave me important guidance and helped me to understand the law behind the patent system.
Furthermore, I also would like to thank Católica Lisbon School of Business and Economics for giving me the opportunity to learn economics, not only in master’s level but also at undergraduate level. Especially, to Laura Pedro for the support and comprehension during this challenging period.
Finally, but not least important, I would also like to express my gratitude to my family who have always supported me through the difficult times. It was their deep love and comprehension that helped me with the difficult task of writing this thesis.
v
Table of contents
1. Introduction ... 8
2. Literature review ... 11
3. Methodology and data collection ... 16
4. Results’ analysis ... 33
5. Main conclusions and limitations of the study ... 42
6. References ... 46
7. Appendices ... 50
Appendix I: Annual growth rates of patent applications ... 50
Appendix II: Tables of resident and non resident patent applications and grants ... 51
Appendix III: Total of patent grants by technology ... 54
Appendix IV: Patenting activity by industry (1991-1993) – percent of R&D units applying for patents and percentage of product and process innovations ... 57
Appendix V: Effectiveness of appropriability mechanisms for product innovations ... 58
vi
Figures and tables index
Figures:
Figure 1 – Total patents applications………..………..18
Figure 2 – Total patents grants……….………..………..19
Figure 3 – Percentage of non resident patent applications……….19
Figure 4 – Effectiveness of appropriability mechanism for product innovations...……….29
Figure 5 – Effectiveness of appropriability mechanism for process innovations……….29
Figure 6 – Effectiveness of appropriability mechanism for product innovations for large firm subsample………..…30
Figure 7 - Effectiveness of appropriability mechanism for process innovations for large firm subsample………..…30
Figure 8 – Reasons to patent product innovations………31
Figure 9 – Reasons to patent process innovations………31
Figure 10 – For unpatented innovations, reasons to not patent………32
Figure 11 – Correlation between # patent applications and expenditure in R&D (% of GDP): EUR..36
Figure 12 – Correlation between # patent applications and expenditure in R&D (% of GDP): PT....37
Figure 13 – Correlation between # patent applications and expenditure in R&D (% of GDP): USA..37
Figure 14 – Correlation between # patent applications and high technology exports: EUR………....38
Figure 15 – Correlation between # patent applications and high technology exports: PT..………....39
Figure 16 – Correlation between # patent applications and high technology exports: USA………....39
Figure I – Annual growth rates of patent applications……….50
Tables:
Table 1 – Research and development expenditure (% of GDP)………20Table 2 – Patent publications by technology in Europe……….…21
Table 3 – Patent publications by technology in Portugal………..………22
Table 4 – Patent publications by technology in U.S.A……….23
Table 5 – Scientific and technical journal articles published……….…26
vii
Table 7 – Patent Rights Index………..………33
Table I – Total number of resident and non resident patent applications in Europe (1980-2011)..…51
Table II – Total number of resident and non resident patent applications in Portugal (1980-2011).52 Table III – Total number of resident and non resident patent applications in U.S.A. (1980-2011)….53 Table IV – Patent grants by technology in Europe (1980-2011)………54
Table V – Patent grants by technology in Portugal (1980-2011)……….55
Table VI – Patent grants by technology in U.S.A.(1980-2011)………..56
Table VII – Patenting activity by industry (1991-1993)……….….57
Table VIII– Effectiveness of appropriability mechanism for product innovation……….…58
8
1. Introduction
The study of the relation between innovation and patent protection is far from new. A great number of academics spent years delving into this matter, though most of the studies presented show an ambiguous relationship between the two. On the one hand, it might be argued that there is a positive relationship between innovation and patent protection, since companies are motivated by monopoly profits from the patent grant. On the other hand, some believe that the existing system issues too much patents, many of which are just trivial improvements over prior art, and others as a mean to block new firms to enter the market (Hovenkamp and Bohannan, 2010).
Article 7 of the Agreement on Trade Related Aspects of Intellectual Property Rights (TRIPS) talks about this relationship: “The protection and enforcement of intellectual property rights should contribute to the promotion of technological innovation and to the transfer and dissemination of technology, to the mutual advantage of producers and users of technological knowledge in a manner conducive to social and economic welfare, and to a balance of rights and obligations.”
When a new invention appears, it is common sense that, if the innovation is any good, it should be available to all from a welfare point of view (Arrow, 1962). But if all the new inventions became accessible to public free of charge, the firms will not have a sufficient incentive to innovate due to the cost of creating and developing a new invention being too expensive.
The origins of patents, in the modern sense, date back to 1474, when the Republic of Venice enacted a decree where new and inventive devices had to be communicated to obtain the right to prevent others from using them. The Statute of Monopolies (1623) and the British Statute of Anne (1710) are seen as the backgrounds of patent and copyright law respectively1. However, it was only in the 19th century that the term intellectual property started to be used, and not until the late 20th century that it became commonplace in the majority of the world.
1 Sullivan, E. Thomas (2000), “The Conference of Antitrust and Intellectual Property at the New
9
The five main forms of intellectual property are patents, copyrights, trademarks, mask works and trade secrets. Regarding patents, the U.S.A make a distinction between patents for invention and patents for design. Also in Europe, there is a similar distinction, the design inventions are separated from patents and the organism responsible for the design creations is the Office for Harmonization in the International Market. Likewise, the new vegetable inventions cannot be patentable, they also have their own international organism that protect them.
The focus of this paper will be on patents for invention. A patent is a government grant of certain rights given to an inventor for a limited time in exchange for the disclosure of the invention. This way, patents confer the right to prevent third parties from making, using or selling the invention without their owners’ consent. Usually this consent is given in return for the payment of a royalty. When a patent is obtained through registration, the law grants the patent owner an exclusive monopoly on the use and commercial exploitation of the invention for 20 years from the date of first filing, in the Portuguese case, as well as in the case of U.S. and the majority of countries of the European Union. This 20 years rule only started in 1992 for European patents and from 1995 for Portugal and the U.S.A.
There are three requirements that need to be fulfilled, in order for a patent to be granted: novelty (the innovation must be new and not already in the public domain), usefulness (it needs to have applicability, practical use, and in the case for Europe, must have industrial applicability) and non-obviousness (it is necessary some inventive step). Despite these three statutory requirements, two other conditions must be met: the disclosure of information – it is necessary that the patent applicant describes all the steps of the creation and development of the innovation – and eligibility – in first place it is necessary to distinguish what is an invention and what is a mere discovery from nature, only the inventions can be patentable. Also there are several areas that are not covered by patent protection, as in the case of inventions that go against the public health. In the Portuguese case the cases that are not covered by patent protection are listed in the articles 52 and 53 of the National Industrial Property Code.
10
The protection given by the patents deters potential imitators – who could otherwise copy the product, or take advantage of the benefits arising from the innovation. The disclosure of information that the patent application requires also helps the diffusion of information of new processes and methods, which can help new inventors to improve their own innovations, simultaneously reducing “redundant R&D investments by firms who might otherwise continue try to develop the same technology.”2 On the other hand, the monopoly created by the patent grant may distort competition, which can result in inefficient allocation of resources, especially since this is a race – lot of independent laboratories invest billions of dollars to create a new invention with the objective to obtain patent protection for the invention, but since the rule is “first come, first served” (the first company to apply for a patent grant is the one that have the exclusive rights of the patent protection), the ones that lose the race waste a lot of money and a lot of resources. There is an exception for the U.S.A., the rule there is “first to invent, first to file” – they give one year to the creator of the innovation to raise sufficient funds to obtain a patent grant. In Europe, although the system was created to protect the invention and not the inventor, when the inventor proves that he already had been using the innovation before someone else applied for a patent, he beneficiates of “pre-use” rights, and he has the exclusivity of the patent.
This work aims to explain the effect, if there is one, of patent protection in the level of innovation by analyzing the existing literature and using some data to understand if there is any correlation. Although there are already some studies concerning this matter, it remains one of the most controversial questions in the economics of technology. Therefore, this paper is divided into five sections. Section 2 is a thorough analysis of the existing literature, focusing on some of the most important works. In Section 3, I explain the methodology adopted for the study and introduce the collected data. More detailed and additional data can be found in the appendices. The results’ analysis and the interpretation of the data are in Section 4. Finally, Section 5 presents the main conclusions and analyzes some limitations of this study.
2 Andrew J. Nelson, Measuring Knowledge Spillovers: What Patents, Licenses and Publications Reveal
11
2. Literature review
In the economics theoretical literature there are two current views concerning patent protection and innovation, one regards the firm’s perspective – it is profitable to patent the innovations or not? Are patents the best method for firms to protect the profits from their innovations –, and the other one concerns welfare economics’ perspective – is the patent system from the welfare point of view, the best method to promote innovation and help economic growth?
With respect to the firm’s perspective the question is should a firm patent or not patent? There are several studies concerning this question, some point out that in some industries, as pharmaceuticals there is a benefit in patenting the innovations and in other industries, as the case of software, the costs associated to the patent process do not compensate the benefits.
The first papers regarding this theory showed that in industries where it is easy to use reverse-engineering to discover the process of innovation, as in the pharmaceutical industry, the imitation costs increase significantly if compared with any other technological field (Mansfield, Schwartz and Wagner, 1981).
Further on, Mansfield (1986), in a survey done through 1981-1983, showed that around 82% of patentable inventions in pharmaceuticals were patented. Later, in a study conducted also by Mansfield (1990), it was found that an important number of innovations would never have taken place if patent protection didn’t exist (60% in pharmaceuticals and 38% in chemicals) – this happens because the investment social return’s rate far exceeds the private return.
However, in some industries, due to the “cumulative” nature of the innovations, patent protection can do more harm than good, such as the case of software industry and business methods (which are already patentable in the U.S., not the case for Europe). Merger and Nelson (1990) link this potential harm to patent breadth, using examples from aircraft, radio and pharmaceutical industries to claim for narrow patents. Others believe IP protection should only be used for isolated innovations because it can create incentive problems with cumulative innovations: in some cases the subsequent innovations can be the destruction of the first innovation (creative
12
destruction3), therefore it is essential to have a trade-off between “achieving static efficiency through competition and achieving long-run efficiency through optimal investment in research, development, and diffusion of innovation” (Schumpeter, 1943). In the same line of reasoning, Gallini (1992) showed that when patent awards are short, increasing the length of a patent award will raise the profits earned by innovators, and therefore increasing the incentive to innovate, but only until a certain level, since after that level, increasing patent length will raise the level of imitation by rivals.
Worried about the monopoly power conceded to firms by the patent grant, some academics were afraid that the costs associated to the monopoly do not outweigh the benefits linked to the information disclosure. Scherer et al. (1992) found that once firms have patent protection or compulsory licensing decrees they tend to patent less, and use other methods of appropriability, as secrecy, although there is no proof when more competition exists in a market, more likely firms will innovate, since the presence of competition is not the only motivation for firms to innovate. The possibility of appropriating the results of their investment is also a reason to innovate. Hall (2003) stated that the patent system is a good incentive scheme to promote innovation when “1) considerable funds are needed to develop an invention, as in the case of pharmaceuticals, or complex modern information technology, and 2) it is difficult to keep the innovation secret, or imitation is easy”.
In the same line of reasoning, Motta (2004), in his book Competition Policy: Theory and Practice, stated that a monopolist would have fewer incentives to innovate than a competitive firm, since the monopolist only considers the “additional” profit by the new invention, while a competitive firm would consider the whole profit. Furthermore, he proved that, in fact, patents improve welfare, as patents remove the negative externality created by spillovers, restoring the incentives to invest in R&D.
Likewise, surveys done on U.S. firms found that a significant number of patentable inventions were not patented (Mansfield, 1986) and that secrecy and lead-time advantages were viewed as the most important appropriation methods to the
13
innovator (Cohen et al., 2000; Levin et al., 1987; Arundel, 2001; and Arora et al., 2003). Arundel (2000) goes further, saying “there is no reason to strengthen IPRs when other appropriation methods provide an adequate incentive to innovate. Doing so would simply increase the ability of firms to extract monopoly profits without providing any social benefits.” Similar results have been obtained by other academics studying European and Japanese firms. The explanations behind this are the possibility of invalidation of the patent when challenged, the disclosure of the innovation method, due to the ease to invent around the patent and the high fees charged by the patent system. Nevertheless, when the value of the investment in R&D is too high, patents proved to be the best method of appropriation of the profits from innovation. Moreover, these studies showed that the reason to use the patent system by companies is not only to appropriate the profits from their innovation, but also for strategic reasons, as for example, to block some new competitors from entering the market, and the prevention of lawsuits from other companies.
Although there are some academics that do not believe in the veracity of these studies saying that several of the previous theoretical did not count innovation as a continuous process (Maurer and Scotchmer, 2002). And, some are not convinced that these results would persist if the focus of the studies were small firms and new entrants (Breitwieser and Foster, 2012). In fact, Mazzoleni and Nelson (1998) believe that these studies missed some important determinants to explain the relationship between innovation and IPR, since small firms and new entrants do not have the same mechanisms at their disposal.
The relationship between patents and innovation, as was showed above, is not so linear. Baldwin et al. (2000) says there is a relationship between patent use and innovation, but this relationship is not bidirectional: “Firms that innovate take out patents, but firms and industries that make more intensive use of patents do not tend to produce more innovations.”
As regards the economics welfare’s perspective, on one hand the disclosure of information implied by patents applications helps the diffusion of technical knowledge to the society, which stimulates innovation by channeling resources through
14
productive process, and therefore generating a race to be the first to patent the invention. On the other hand, it creates an inefficient allocation of resources, since there are a lot of companies “fighting” for the same patent, when one applies for a patent – winning the race – the others lose the investments made in the discover of that innovation. Although sometimes, not all the investments are lost in the process, for example, in the case of pharmaceuticals, when two or more firms are competing for the discovery of a new drug which cures cancer, they can find other drugs that cure other diseases in the process. As well, there is the deadweight loss associated to the monopoly created by the patent protection, and the costs associated to the patent system.
Hereupon, are the benefits of disclosure information enough to overlap the costs associated to the patent system and the deadweight loss and misallocation of resources created by it? There are some scholars that believe that the answer to this question is yes, and others believe that if there were no patent system, there would be no reason to implement one today.
As a matter of fact, in 1958, Fritz Machlup in a report to the Congress stated,
If we did not have a patent system, it would be irresponsible, on the basis of our present knowledge of its economic consequences, to recommend instituting one. But since we have had a patent system for a long time, it would be irresponsible, on the basis of our present knowledge, to recommend abolishing it.
In addition, Barzel (1968) said that intellectual property rights can stimulate too much innovation, which can replicate in wasteful duplicative or uncoordinated innovation activity, hurting competition.
Early, academics decided to study if, in fact, stronger patent protection helped or not to stimulate innovation and economic growth. But what is the meaning of stronger patent protection? Stronger patent protection is sometimes associated with an increase in the patent length or breadth. For Nordhaus (1969), the longer the patent protection, the higher the innovation, but also the deadweight loss associated to the monopoly created by the patent protection. Hence, he argues, it is essential to balance both. Likewise, Gilbert and Shapiro (1990) showed that the socially cost-effective way
15
to reward innovation is to have infinitely-lived patents and the optimal patent scope is the indispensable to cover the investment. In a similar study, Acemoglu and Akcigit (2011) show that a decrease in the patent length (from 50 years to 9 years) will reduce the rate of innovation (from 1.1% to 0.15%). Kamien and Schwartz (1974) and Klemperer (1990) also agree that an increase in patent protection unambiguously increases the rate of innovation. However, when patents are already strong, increasing the patent length further can, in fact, contract the level of innovation (Horowitz and Lai, 1996).
In an important contribution, Ginarte and Park (1997) constructed an index of patent rights for 60 countries between 1960-1990. The results of their study showed no relationship between the strength of patent rights and economic growth, with the exception being rich countries, where they found a positive relationship between stronger patent protection and investment and R&D.
Later, Kanwar and Evenson (2003) studied, at the aggregate level, the effect of stronger IPR protection (measured by Ginarte and Park (1997) index of IPRs) in R&D expenditure and they discovered that stronger IPR protection has a positive and a significant impact on the share of R&D investment in GDP. Furthermore, Lederman and Manoley (2003), Chen and Puttitanum (2005), and Falk (2006) also found a positive and significant effect between innovation and patent protection.
Nevertheless, there are some studies that show that this relation between patent protection and innovation is not so linear. On one hand, the costs of information disclosure more than offset the private gains from patenting (Horstmann, 1985). Other studies show that approximately 50% of all patents lapse due to failure in paying the renewal fees through the mid-point of the 20 years, in the case of U.S., and in European jurisdictions with annual renewal requirements, approximately 95% of all patents lapse due to failure in the payment of renewal fees previous to the end of the statutory term4. There are also several studies showing the “worthless” of the patents granted (Schankerman and Pakes, 1984; Pakes, 1985).
16
On the other hand, some studies showed that an increase in patent protection have a negative effect on innovation. Sakakibara and Branstetter (1999) and Bessen and Maskin (2000) found a negative correlation between the strength of IP system and innovation. Their results were not supported in Kortum and Lerner (1998), however. Lerner (2002) shows that when a country reinforces its patent system it will increase the number of patents registered by foreign inventors; yet, there is no proof of an increase in patentability of the domestic inventors, neither in their country itself or in the foreign country. Moser (2005) found a similar result in her work: “I find no evidence that patent laws increased levels of innovative active but strong evidence that patent systems influenced the distribution of innovative activity across industries”.
Moreover, Boldrin and Levine (2009) estimated that the optimal patent term would be somewhere between 5 to 10 years. In their example, if a world economy is growing at 4% a year, then patent protection should be reduced, approximately, 1% per year. In a different work, although with similar results, Krasteva (2012) showed that patent protection may impede R&D investment even in the context of independent innovations.
Some academics are convinced that intellectual property protection, including patent protection, is essential to stimulate innovation. Lemley (2001) stated that the goal of patent system is to promote innovation by giving inventors economic rewards. However, this relation is ambiguous, since over the years were several studies that pointed out a positive relationship between them, and others that do not see the positive effects of the patent system, and several asking for a reform of the current patent system (Boldrin and Levine, 2013).
3. Methodology and data collection
In this section I will explain the main reasons for the choice of the data used in this thesis, and also I will present the data collected and some data that I used from other research papers. The analysis of these data will be made at Section 4.
17
To study the relationship between patent protection and innovation I decided to focus on Portugal (PT), Europe (EUR), and United States of America (USA). The reason for the choice of these three economies was simple, Portugal is the country that I am natural off, and it was of my special interest compare Portugal with the other two economies to understand the importance of the patent system in Portugal. Europe and the U.S.A. are the two major case studies, already analyzed by the most important papers, concerning this topic, and second, since they were already the focus of many papers, there is more data available.
Some of the data used in this paper were collected in World Intellectual Property Organization (WIPO) Statistics Data Center and World Bank’s site. I also used data presented in Cohen, Nelson and Walsh (2000) relative to surveys made to U.S firms, and from Ginarte and Park (1997), Park (2008) and Intellectual Property Rights 2012 Report to compute the patent rights index, that will be explain further on.
To measure the rate of innovation I used the number of patent applications, since it removes the “vagaries” of patent offices, which can affect the number of patents granted, leaving only the creations of the inventors. Although it is not an effective measure of innovation, due to the fact that not all patents filed are effectively patentable, this measure was already used in many papers, and is the one that gathers more consensus.
The number of patent applications is not the only way to measure innovation. The other measures usually used are new products or products improvement - but not all products are guarantee to succeed -, the patent citations - however, patents can be self-cited-, and inventions disclosure or suggestions – yet, ideas are seldom realized.
The number of patent applications between 1980-2011 is not uniform between the economies in analysis, as we can see in figure 1. In Portugal the number of patent applications are decreasing over time (-64.56%). Portugal registered 1823 patent applications in 1980 and only 686 in 2011. However, Portugal didn’t always recorded this decreasing path, between 1980-1990, Portugal noted an increase in patent applications of 95%, with the maximum number of applications of 3642 listed in 1990, but after that, the number of patents applications decreased, significantly.
18
In Europe, if we look throughout the years in the sample (1980-2011), we observe a reduction in the number of patent applications (-23.19%), however after 1990, patent fillings at the European Patent Office (EPO) registered an increase of more than 45%. In the case of United States of America, the story is different, the number of patents applications increased more than 380%, throughout 1980-2011.
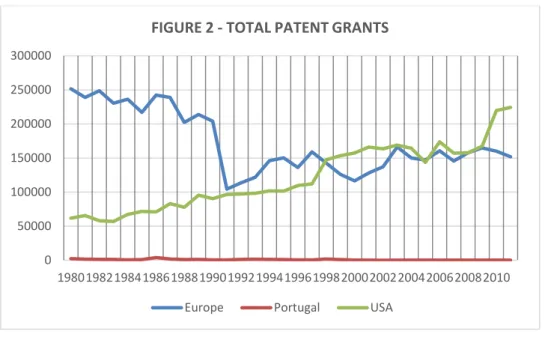
In figure 2 are showed the number of patent grants for Portugal, Europe and the U.S.A.: we observe the same path as patent applications, with a declining path recorded by Portugal and Europe, minus 93.68% and minus 39.58%, respectively, and once more, US showing more than 263% increase between 1980-2011.
It is important to mention that I could use the number of patent applications and the number of patent grants to compute the percentage of the number of patents effectively granted, however that analysis cannot be done since when a patent is filed it takes in average 2 to 5 years to be conceded with a grant.
0 100000 200000 300000 400000 500000 600000 1980198219841986198819901992199419961998200020022004200620082010 F I G U R E 1 - T O T A L P A T E N T A P P L I C A T I O N S
Europe Portugal USA
19
If we look closer to the origin of patent applications, as shown in figure 3, it is easy to perceive that until 1992, almost all patent applications in Portugal were made by foreign innovators. After 1992, we see an increase in domestic patent applications, and in 2011, only less than 12% of the patent applications were non resident patents. In Europe, the majority of patents applications are done by domestic inventors, with 38.78% (2002) as the maximum of patent applications registered at (EPO) by foreign innovators. In the U.S., the ratio between non resident and resident patent applications is very close but from 2009 the percentage of foreign patent applications is larger than the domestic ones.
0 50000 100000 150000 200000 250000 300000 1980198219841986198819901992199419961998200020022004200620082010
FIGURE 2 - TOTAL PATENT GRANTS
Europe Portugal USA
0% 10% 20% 30% 40% 50% 60% 70% 80% 90% 100% 1980 1982 1984 1986 1988 1990 1992 1994 1996 1998 2000 2002 2004 2006 2008 2010 F I G U R E 3 - % N O N R E S I D E N T P A T E N T A P P L I C A T I O N S Portugal EUR US
Source: WIPO Statistics Database Source: WIPO Statistics Database
20
I also decided to look to the amount of research and development expenditure, since the majority of innovations involve a large sum of research and development spending, especially in the first stage of the creation of the invention.
Figure 6 presents the total of the research and development expenditure in percentage of GDP per year, throughout 1996-2010. These expenditures for research and development are current and capital expenditures (both public and private) on creative work undertaken systematically to increase knowledge, including knowledge of humanity, culture, and society, and the use of knowledge for new applications. R&D covers basic research, applied research, and experimental development.
Table 1 - Research and Development Expenditure (% of GDP)
Office 1996 1997 1998 1999 2000 2001 2002 2003 2004 2005 2006 2007 2008 2009 2010
EUR 175.87% 178.01% 175.26% 183.71% 180.65% 186.59% 183.48% 186.13% 182.51% 182.15% 184.42% 184.50% 194.20% 203.89% 202.65% Portugal 55.62% 57.04% 63.04% 68.66% 72.78% 77.22% 73.20% 71.07% 74.36% 77.86% 98.66% 116.51% 150.31% 164.04% 159.12% USA 255.18% 257.63% 259.62% 264.00% 270.86% 271.88% 261.63% 261.28% 254.53% 259.41% 263.57% 270.45% 283.89% 289.66% N.D.
Source: United Nations Educational, Scientific, and Cultural Organization (UNESCO) Institute for Statistics.
As expected, the United States of America is the country where the expenditure in research and development, as percentage of GDP has the higher value, recorded almost 300% in 2009. In Europe this ratio is also high, with the spending in R&D hitting the 200% in 2009 and 2010. Portugal despite being the one which spends less in research and development is the one where this ratio exhibits greater increase (more than 180%), between 1996-2010.
The next three tables present the patent publications by technological field. In Europe, in 1980, the field of technology with higher percentage of patent publications was the electrical machinery, apparatus and energy, with 20,778 patent published. But, over the years this field changed, after 1980, the industries which registered a higher number of patent publications were measurement, civil engineering and transportation.
At the INPI the industries that registered the higher number of patent publications were pharmaceuticals and organic fine chemistry, and after 1994, civil engineering also counts as one of the industries with the higher percentage of patent publications.
21
The United States recorded medical technology as one of the fields with high number of patent publications, but also as electrical machinery, apparatus and energy and organic fine industry. After 1995, we can add computer technology as one of the industries which registered high number of patent publications, recorded almost 58,000 patent publications in 2008.
25
To comprehend the innovative activity of an economy it is necessary to look also at the scientific and engineering articles published and to the high technology exports.
Table 5 shows the scientific and engineering journal articles published, between 1985-2009, in the following fields: physics, biology, chemistry, mathematics, clinical medicine, biomedical research, engineering and technology, and earth and space sciences.
By looking at table 5 we can see that until 1995, the United States were the economy with most articles published in scientific and engineering journals but after 1995, Europe started to be the economy with higher number of articles published in scientific and engineering journals.
In all the economies, the number of articles published increased throughout the period in analysis; in Europe this increase was almost 100%, in the U.S.A. more than 50% and for Portugal this increase was more than 1600%.
As concerns to the high technology exports, it includes products with high R&D intensity, such as in aerospace, computers, pharmaceuticals, scientific instruments, and electrical machinery. Data are in current U.S. dollars.
At table 6 is possible to see that Europe is the economy which exports more high technology products, followed by the U.S. and Portugal, throughout the years in analysis (1992-2011). These results are perfectly normal given the dimension of these three economies.
In Europe, in 1992, the value of high technology was US$ 174 billion, and during the period in question, this value increased significantly, recording at the end of 2011 more than US$ 623 billion.
The Portuguese case is different, throughout 1992-2008 we assisted to an increase of more than 500%, registering a value of high technology exports of more than US$ 3 billion. After 2008, this value decreased significantly, and at the end of 2011, the value of high technology products exports in Portugal was US$ 1,5 billion.
26
The U.S. also present a decrease in the value of high technology products exports after 2008. At the end of 1992, the value of high technology exports was US$ 104 billion, in 2008 the U.S. registered a value for the exports of high technology products of more than US$ 220 billion, and at the end of 2011 the value was only US$ 145 billion.
28
To do a thorough and more complete analysis of the relation between patent protection and innovation, I used data from the surveys presented in Cohen, Nelson and Walsh’s (2000) paper.
In 1994, Wesley Cohen, Richard Nelson and John Walsh (2000) inquired 1478 R&D labs in the U.S. manufacturing sector to understand which were the methods used by companies to appropriate the profits of their invention. Although the surveys were conducted only in the United States, it is my opinion that they are essential to understand, in respect to the firm’s perspective, the relationship between innovation and patent protection.
The reason to the choice of these surveys was the fact that they were already used in a large amount of academic works and they allow us to comprehend, with respect to the firm’s perspective what are the main methods for the firms to appropriate the profits of their innovations, and if these methods of appropriation are or not related with the firm size and the level of investment in R&D. These surveys also enumerate what are the main reasons for companies patent and not patent their innovations. The next figures present the main results of the study. More detail data of these surveys can be found in the appendices.
Regarding product innovations, companies considered lead time advantages and secrecy as the most effective methods to appropriate the profits of their innovations (52.8% and 51%, respectively), as it is showed in figure 4. The most effective mechanisms for process innovations considered by firms are secrecy (50.6%) and complementary manufacturing (43%) – figure 5.
29
Considering only the large firms, secrecy, lead time advantages and complementary manufacturing remain as the most efficient mechanisms of appropriation, as it is presented in figure 6. 51 34,83 20,71 52,76 42,74 45,61 0 10 20 30 40 50 60 70 80 90 100 Secrecy Patents Other legal Lead time Complementary sales/service Complementary manufacturing
Mean % of product innovations for which mechanism considered effective
Figure 4 -Effectiveness of appropriability mechanism for product innovations: Mean percentage of product innovations for which
mechanism considered effective
50,6 23,3 15,4 38,4 30,7 43 0 10 20 30 40 50 60 70 80 90 100 Secrecy Patents Other legal Lead time Complementary sales/service Complementary manufacturing
Mean % of product innovations for which mechanism considered effective
Figure 5 - Effectiveness of appropriability mechanism for process innovations: Mean percentage of product innovations for which
mechanism considered effective
Source: Source: Cohen, Wesley M., Richard R. Nelson and John P. Walsh (2000), “Protecting their intellectual assets: Appropriability conditions and why U.S. manufacturing firms patent (or not)”, NBER Working Papers, National Bureau of Economic Research, No. 7552.
Source: Source: Cohen, Wesley M., Richard R. Nelson and John P. Walsh (2000), “Protecting their intellectual assets: Appropriability conditions and why U.S. manufacturing firms patent (or not)”, NBER Working Papers, National Bureau of Economic Research, No. 7552.
30
Companies refer the criteria of novelty in the patent application and the ease to invent around, as the most important reasons not to patent. On the other hand, the main reasons listed by companies to patent an innovation, either in product innovations as in process innovations are to prevent copying, to block potential competitors and to be protected against possible suits.
41,5 51,0 50,1 41,1 43,9 0 10 20 30 40 50 60 70 80 90 100 Patents Secrecy Lead time Complementary sales/services Complementary manufacturing
Mean % of product innovations for which mechanisms considered effective
Figure 6 - Effectiveness of appropriability mechanisms for product innovations for large firm subsample
26,8 53,2 36,7 27,1 43,8 0 10 20 30 40 50 60 70 80 90 100 Patents Secrecy Lead time Complementary sales/services Complementary manufacturing
Mean % of product innovations for which mechanisms considered effective
Figure 7 - Effectiveness of appropriability mechanisms for process innovation for large firm subsample
Source: Source: Cohen, Wesley M., Richard R. Nelson and John P. Walsh (2000), “Protecting their intellectual assets: Appropriability conditions and why U.S. manufacturing firms patent (or not)”, NBER Working Papers, National Bureau of Economic Research, No. 7552.
Source: Source: Cohen, Wesley M., Richard R. Nelson and John P. Walsh (2000), “Protecting their intellectual assets: Appropriability conditions and why U.S. manufacturing firms patent (or not)”, NBER Working Papers, National Bureau of Economic Research, No. 7552.
Source: Source: Cohen, Wesley M., Richard R. Nelson and John P. Walsh (2000), “Protecting their intellectual assets: Appropriability conditions and why U.S. manufacturing firms patent (or not)”, NBER Working Papers, National Bureau of Economic Research, No. 7552.
31 5,8 28,3 47,4 58,8 95,8 81,8 47,9 0 10 20 30 40 50 60 70 80 90 100 Measure performance Licensing revenue For use in negotiations Prevent suits Prevent copying Blocking Enhance reputation
% of respondents by reason
Figure 8 -Reasons to patent product innovations
5,0 23,3 37,0 46,5 77,6 63,6 34,0 0 10 20 30 40 50 60 70 80 90 Measure performance Licensing revenue For use in negotiations Prevent suits Prevent copying Blocking Enhance reputation
% of respondents by reason
Figure 9 - Reasons to patent process innovations
Source: Source: Cohen, Wesley M., Richard R. Nelson and John P. Walsh (2000), “Protecting their intellectual assets: Appropriability conditions and why U.S. manufacturing firms patent (or not)”, NBER Working Papers, National Bureau of Economic Research, No. 7552.
Source: Source: Cohen, Wesley M., Richard R. Nelson and John P. Walsh (2000), “Protecting their intellectual assets: Appropriability conditions and why U.S. manufacturing firms patent (or not)”, NBER Working Papers, National Bureau of Economic Research, No. 7552.
32
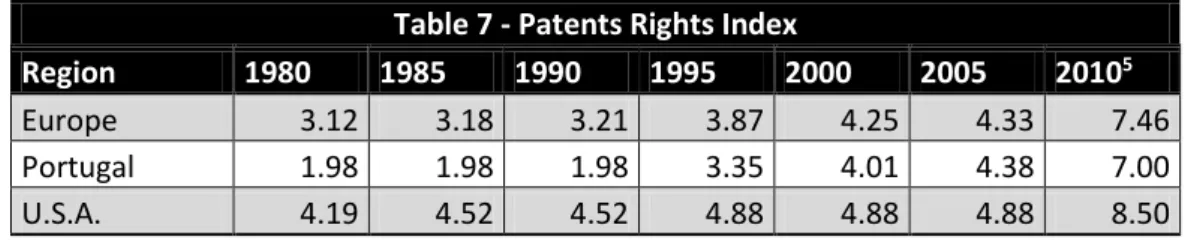
To evaluate the strength of patent protection I used the Ginarte and Park Index (GPI, henceforth), an index of patent rights, initially calculated for 110 countries between 1960-1990, but meanwhile updated to 124 countries and until 2005. This index considers five components of the laws: duration of protection, extent of coverage, membership in international patent agreements, provisions for loss of protection, and enforcement measures. Each of these components was assigned a value of one if present and 0 if absent, with the score being the sum of these values as a percentage of the maximum value. So, the minimum possible national score was 0 and the maximum was 5.
As this index only includes values until 2005, I used the Intellectual Property Rights Index (IPRI, henceforth) to have data until 2010. The IPRI came to replace the GPI, however the measurements of the two indices are not the same.
For this study I only computed the values throughout 1980-2010, since it is our time sample analysis.
As regards the IPRI, it includes three categories: Legal and Political Environment, Physical Property Rights and Intellectual Property Rights, but for the purpose of this study I only presented the values for the Intellectual Property Rights that comprises
32,1 24,3 15,7 3,2 24,6 0 5 10 15 20 25 30 35 Demonstration of novelty Disclosure Application cost Defense cost Ease of inventing around
% of repondents by reason
Figure 10 - For unpatented innovations, reasons to not patent
Source: Source: Cohen, Wesley M., Richard R. Nelson and John P. Walsh (2000), “Protecting their intellectual assets: Appropriability conditions and why U.S. manufacturing firms patent (or not)”, NBER Working Papers, National Bureau of Economic Research, No. 7552.
33
the protection of intellectual property rights, patent protection and copyright policy. Unfortunately it does not make any differentiation between them. The overall grading scale of the IPRI ranges from 0 to 10, with 10 representing the strongest level of property rights protection and 0 reflecting the non-existence of secure property rights in a country.
I decided not to converge the value of IPRI to the scale of the GPI, since these are two different measures and cannot be directly comparable.
Since GPI did not present the average value for Europe, I computed it by calculating the arithmetical mean of all European countries listed in Ginarte and Park (1997).
Table 7 - Patents Rights Index
Region 1980 1985 1990 1995 2000 2005 20105
Europe 3.12 3.18 3.21 3.87 4.25 4.33 7.46 Portugal 1.98 1.98 1.98 3.35 4.01 4.38 7.00 U.S.A. 4.19 4.52 4.52 4.88 4.88 4.88 8.50
Source: Ginarte and Park (1997) and Park (2008)
4. Results’ analysis
In this section I will analyze in detail the data of the previous section.
Over the years, patent regimes have gone through important changes, especially in the past two decades. The major changes were done in strengthening patent rights, mainly, conferring more exclusive rights to patent holders, and expanding the coverage and easing enforcement of patent applications. For example, in Portugal until 1995, the duration of patent protection was only 15 years and in the United States was 17 years, while the European Convention had already implemented the period of 20 years to the duration of the patent protection.
5 Data collected from Intellectual Property Rights Index 2012 Report, regards the section of
Intellectual Property Rights, the data is not divided by intellectual properties categories, therefore its include all types of intellectual property (patents, copyrights, trademarks, mask works and trade secrets.
34
The United States and Japan were the first to reinforce the duration of patent protection in pharmaceutical industry, followed by Europe in 1992. Nowadays, there is a supplementary protection certificate that extends the duration of the patent protection, in Europe. This certificate only comes into force after the corresponding general patent expires. It normally has a maximum lifetime of 5 years, can be extended to 5,5 years in cases related to human medical products which data from clinical trials conducted in accordance with an agreed Pediatric Investigation Plan have been submitted.
In Portugal, before joining the European Union (EU), patent rights did not have very strong protection. For instance, only after joining the EU, Portugal introduced the patent for products, before only the processes of the invention were patentable. Also, only after the adhesion to the EU, Portugal implemented by decree the possibility to “reverse the burden of proof”. This measure was already been discussed in the Parliament in 1980 but due to the pressure of the big economic groups did not passed.
Furthermore, this strengthening of patent protection did not only give higher protection to the patent holders, the field covered by patents was also expand, as in the case of the United States that, in 1989, took a more liberal approach regarding the software industry and business methods, which became patentable for the first time.
In Europe, software and business methods are still not protected through patent, due to the fact that they do not meet the “obviousness” criteria. However, Europe continues to strength patent protection, in April 2004 was approved a Directive by the European Parliament and the European Council to ease the enforcement of intellectual property rights.
Now, if we look to the data in Section 3 it is possible to see that the number of patent applications at the EPO and at the United States Patent and Trade Office (USPTO) is increasing between 1990-2011, more than 45% and almost 200%, respectively. Although the Portuguese Institute of Industrial Property (INPI) recorded an increase of more than 95% in patent fillings between 1980-1990, but after 1991 the number of patent applications decreased significantly. This can be explained by the Portuguese adhesion to the EU, which required that Portugal joined the EPO until 1992, therefore,
35
after 1992 the patent applications in Portugal increased, but they were registered at the EPO and not at the INPI.
As regards the origin of patents applications it is important to notice, that the number of domestic patent fillings at the INPI increased substantially, as the number of patent applications decreased, from 1992. This supports the theory that, although the number of patent applications at the INPI recorded a sudden decrease, this not means that the patent applications in Portugal have decreased. The total number of patent applications in Portugal increased but after 1992, these applications are filled at the EPO and not at the INPI.
In figure 2 we can notice a slightly increase of non resident patent fillings at the EPO and at the USPTO, which may be explained by the desire of foreign patent holders increase the extent of their patent application, and also, to protect their market in other countries, blocking domestic innovators to use their innovation.
Relative to the field of patent applications, analyzing the data is possible to see that the most chosen field by patent applicants varies across the three economies and in the case of Europe and United States of America also differs across time.
In Europe, throughout 1980-1996, the technological fields that exhibited more applications, according to WIPO’s qualification were measurement and civil engineering, after 1996 the technological field which registered more patent fillings was transportation.
In Portugal, between 1980-1994, the fields which have registered more patent applications were pharmaceuticals and organic fine chemistry. After that period, we can see an increase in the patent applications for civil engineering, although pharmaceuticals, medical technology and organic fine chemistry also registered a high number of fillings.
In the U.S.A, throughout 1980-2011, medical technology was one of the fields that registered the largest number of patent applications, the other two technological fields which noticed more fillings were electrical machinery, apparatus and energy and organic fine industry. After 1995, the number of patent applications in computer
36
technology increased significantly, making it, between 1996-2011, the field with more applications.
To understand better the relation between the number of patent applications and the value of the expenditures in R&D, as a percentage of GDP, I used the ordinary least squares (OLS) method to construct the regression line describing this relation. Figures 11, 12 and 13 show the linear regressions for Europe, Portugal and the U.S.A..
The results demonstrate that the model does not fit the data, for all the economies and this can be explain because this relation is not synchronic. The investment in R&D occurs years before the fillings for patent, since the creation and development of a new invention take time.
-0,03 -0,02 -0,01 0 0,01 0,02 0,03 0,04 0,05 0,06 -0,2 0 0,2 0,4 0,6 0,8 1 A n n u al gro wth r ate of e xpe n d itu re in R & D
Annual growth rate of patent applications
Figure 11 - Correlation between # patent applications and expenditure in R&D: EUR
37
With respect to the scientific and technical journals published there is a positive relation between the number of patent applications and the number of articles published. Over the years the number of articles published increased exponentially in all economies. An explanation for this can be the development of new methods of communication and the ease of diffusion of that communication, as for example, internet, the applications for smartphones, just to mention a few.
-0,1 0 0,1 0,2 0,3 0,4 -0,3 -0,2 -0,1 0 0,1 0,2 0,3 0,4 0,5 0,6 A n n u al gro wth r ate of e xpe n d itr u e in R & D
Annual growth rate of patent applications
Figure 12 - Correlation between # patent applications and expenditure in R&D: PT -0,05 -0,04 -0,03 -0,02 -0,01 0 0,01 0,02 0,03 0,04 0,05 0,06 -0,02 0 0,02 0,04 0,06 0,08 0,1 0,12 0,14 A n n u al gro wth r ate of e xpe n d itu re in R & D
Annual growth rate of patent applications
Figure 7- Correlation between # patent applications and expenditure in R&D: USA
38
Concerning the value of the exports for high technological products, I also decided to use the OLS to compute the linear regression between the number of patent applications and the exports for high technological products.
In this case, the results seem to point out to a positive relation between the number of patent applications and the high technology exports, with the exception for Portugal. This exception can have the same explanation as above, since Portugal joined the EPO, in 1992, the number of patent applications at the INPI decrease significantly, due to non residents innovators are now using the EPO to register their applications for a patent in Portugal.
But these results are biased. As before, the relation between the number of patent applications and the value of exports for high technological products is not synchronic. Between the application for a patent and the export of the innovation can take years.
0 100.000.000.000 200.000.000.000 300.000.000.000 400.000.000.000 500.000.000.000 600.000.000.000 700.000.000.000 200000 220000 240000 260000 280000 300000 320000 340000 360000 Figure 14 - Correlation between the number of patent applications and
39
Comparing now the data collected from Cohen, Nelson and Walsh’s (2000) with the data that I collected from the United States, I found some interesting and matching results.
As was showed in Section 3 both in product innovations as in process innovations the most effective methods of appropriation are secrecy, lead time advantage and complementary manufacturing. Patents only appeared in fourth place out of five as
0 500.000.000 1.000.000.000 1.500.000.000 2.000.000.000 2.500.000.000 3.000.000.000 3.500.000.000 0 200 400 600 800 1000 1200 1400
Figure 15 - Correlation between the number of patent applications and the high technology exports: PT
0 50.000.000.000 100.000.000.000 150.000.000.000 200.000.000.000 250.000.000.000 100000 150000 200000 250000 300000 350000 400000 450000 500000 550000 Figure 16 - Correlation between the number of patent applications and
40
the best mechanisms to appropriate the profits of innovations, used by companies, with 34.8% for product innovations and 23.3% for process innovations.
Looking to these data by industry, and compare it with our sample for U.S. in 1994, is important to highlight that regarding product innovation the industry that highly rated patents as an effective mechanism of appropriation was the medical equipment industry, followed by drugs (54.70% and 50%, respectively). Now, observing the number of patent applications by industry in the U.S. during 1994 it is easy to see that the largest number of patent fillings were exactly in medical equipment6. The same happens to process innovations, which leads me to conclude that, actually, the most effective method to appropriate the profit of an innovation in pharmaceuticals is through patenting.
Although these surveys do not provide data for small firms, analyzing the data for the large firm subsample, it seems to support Mazzoleni and Nelson’s (1998) work, which assumes that small firms and new entrants have more reasons to patent than the large companies, since large firms have other mechanisms to appropriate the return of their innovations. Here, it is important to proceed with careful since there are sectors where small firms and new entrants cannot compete with the large firms, due to the high value of the investments in R&D.
As regards the reasons for the use of patent protection by companies, these surveys also support the majority of the previous literature, as the most important being the prevention of copying by other companies, to appropriate some market power by blocking some potential competitors and, finally, to prevent some possible suits. Therefore, companies do not use patents as a mean of promoting innovation, but exactly the opposite, since one of the main reasons to patent is to exclude some potential innovators of the market. By blocking potential competitors, patents are preventing new entrants to improve previous innovations.
In contrast, the main reasons why companies decide not to use patent protection for their innovations, are the difficulty to fulfill the “novelty” criteria, this happens, because a several number of innovations are just improvements of previous
41
inventions. Other reason is the risk associated to the disclosure of the information – when a company applies for a patent it must disclosure information regarding the process and the method of the new invention, although, as was already explained, not all applications for a patent are conceded with a grant, since they need to pass the tests conducted by the patent offices, therefore there is a risk associated to this disclosure. Finally, since the companies need to reveal the innovation when filed for a patent, the other companies can easily invent around.
Now, considering the patent rights index presented at table 6, it is possible to observe the increase in the strength of patent rights over time, which supports most of the previous literature concerning patent protection.
Comparing them with the number of patent applications, I can observe that there are different trends for the different countries. For example, in the case of Europe between 1980-1995 we assisted to a reduction in the number of patent fillings, but the index of patent rights is increasing through that period, after 1995 we can observe an increase of patent applications and also in patent rights index. This increase in the patent applications after 1995 can be related with the increase of the patent rights index since, the effect of this index is not immediate, the policies taken need time to act and to show some results.
Portugal, indeed, exhibited an increase of almost 100% throughout 1980-1990, and the level of patent rights index did not present any variation, although we have seen an attempt to increase the level of patent protection in 1980, with the discussion for the approval of the “reverse of burden of the proof” in the Portuguese Parliament. In addition, after 1990 until 2010 the level of patent applications registered a decrease of 85% and the patent rights index, on the other hand, raised more than 250%. Yet, we cannot forget that this reduction in the number of patent applications is not real, since the patent applications in Portugal increased over the years in analysis, but after 1992, the majority of applications for patents were filled at the EPO, thus they do not count for the INPI data.
Regarding the U.S., there is a positive correlation between patent rights index and the number of patents filed at the USPTO. Although the increase in the number of patent
42
applications more than triples the increase of patent rights index (370% and 103%, respectively.
5. Main conclusions and limitations of the study
This work supports the majority of theoretical conclusions regarding the relationship between stronger patent protection and the level of innovation, presenting a positive effect between the two. On one hand, the level of patent protection is increasing over the years, this increase not only respects to a higher protection of the patent holders, giving them more exclusive rights, but also in the expansion of the coverage of patent protection and the ease to enforcement patent applications. On the other hand, the number of patent applications follows this increase in the level of patent protection, with the exception for Portugal, but this, as was already explained, is due to Portugal joined the EPO in 1992, and the majority of the innovations are filed at the EPO and not at the INPI.
Regarding the relation between expenditures in R&D and the number of patent application, the model does not fit the data, and here it is important to not forget that the investment in R&D by the company is done years before the company applies for a patent. This happens because the development of the invention takes time and, therefore these two variables are not directly comparable. The same happens to the exports for high technological products, although in this case the data seem to fit the model.
As concerns to the fields of patent applications, the data showed some interesting results. There are some variations across different industries and across different periods of time. For example, in the United States we noted a change in the percentage of computers technology’s patent applications across time. But does this mean that, between 1980 and 1994, the industry of medical technology was more innovative than the computer technology one and that, after 1995, computer technology become more innovative than medical technology? The answer to this question is not linear. The explanation for this increase in patent applications for computer technology is simply due to the exponential development of this industry.
43
The data used from Cohen, Nelson and Walsh’s (2000) surveys, allow to demonstrate the firms’ perspective, regarding the use of patents for protection of their innovations.
Patent protection is especially important for small companies and new entrants that do not have other means to protect their innovations nor the resources to commercialize the innovation; so their only objective is to earn the profits through licensing. Although in cases where the investment in R&D is too high, small companies and new entrants cannot compete with the larger companies.
The data also showed that, for large companies, the use of a patent is not always their first choice of mechanism to protect the profits of their innovations, but this does not mean that they do not use patent protection completely. They can use different methods of appropriation in the different stages of the innovation process. For example, the companies can use secrecy and lead-time advantages in the first stages of the invention, while in the final stages of the development of the innovation, they use patent protection, in order to protect it from copy by rivals.
Certainly, when other methods of appropriation are used, the diffusion of information required by the patent application does not exist, which reduces the amount of knowledge available to the public. Thus, methods as trade secrets and lead-time advantages are not expected to raise the diffusion of technology considerably.
Nevertheless, these results are not entirely conclusive; there are some significant limitations to this study that need to be taken into consideration.
First, the number of patent applications provides an imperfect measure of innovative output, since not all innovations are patented. As we could see above, companies, in particularly the larger ones, have other methods to collect the profits of their innovations.
Second, not all patent filed have the approval of the patent offices and are conceded with a grant. And not all granted patents last until the patent protection ends, some proved to be solely redundant invention, and others are only used to block rivals to enter the market.
44
In addition, the relation between innovation and patent protection is not direct, since it takes some years after the policies are implemented for us to see some results in the level of innovation.
Another limitation of this study is that it does not take into account the costs of the patent system, not only in the optic of the firms but also in the economy, in general. Regarding the firms we need to take into account the risk’s cost of the disclosure of the information since there is no guarantee that the innovation will be conceded with a patent grant, also for the invention to be protected is necessary that the company pays the fees to the patent office.
As concerns to the costs of the patent system for the economy, it is easy to see that it is not cheap to sustain a patent system, for the countries. The costs of implementation the patent office, the costs of hire specialists, the analysis and the tests that must be done to verify if an innovation can be granted with a patent grant also have a cost, the costs of the appeals, just to mention some. Therefore, for less developed countries the costs of a patent system can overlap its benefits, but in some cases, these costs are a necessary condition to attract foreign investment to the country.
Further, although this thesis demonstrates a positive relation between stronger patent protection and the level of innovation, I cannot prove that without a patent system the level of innovation would decrease, since I do not have data for the case of an economy with no patent system.
With respect to the surveys used to demonstrate the firm’s perspective, they were only conducted in the United States during a short period of time, therefore they possibly do not translate the European reality, especially if we take into account that the American patent system is different from the European one, and not directly compared.
Finally, none of the data used in this study was generated by me, but was instead collected from third-party sources such as the World Bank, the World Intellectual Property Organization and research papers. While this allows the study to refrain from any potential bias, it limits the ability to reconstruct any missing data. For example, regarding the analysis of the expenditure in R&D, as a percentage of GDP, the lack of