EUROPEAN ORGANIZATION FOR NUCLEAR RESEARCH (CERN)
CERN-EP/2016-016 2017/01/24
CMS-TOP-12-006
Measurements of the tt production cross section in
lepton+jets final states in pp collisions at 8 TeV and ratio of
8 to 7 TeV cross sections
The CMS Collaboration
∗Abstract
A measurement of the top quark pair production (tt) cross section in proton-proton collisions at the centre-of-mass energy of 8 TeV is presented using data collected with the CMS detector at the LHC, corresponding to an integrated luminosity of 19.6 fb−1. This analysis is performed in the tt decay channels with one isolated, high transverse momentum electron or muon and at least four jets, at least one of which is required to be identified as originating from hadronization of a b quark. The calibration of the jet energy scale and the efficiency of b jet identification are determined from data. The measured tt cross section is 228.5±3.8 (stat)±13.7 (syst)±6.0 (lumi) pb. This mea-surement is compared with an analysis of 7 TeV data, corresponding to an integrated luminosity of 5.0 fb−1, to determine the ratio of 8 TeV to 7 TeV cross sections, which is found to be 1.43±0.04 (stat)±0.07 (syst)±0.05 (lumi). The measurements are in agreement with QCD predictions up to next-to-next-to-leading order.
Published in the European Physical Journal C as doi:10.1140/epjc/s10052-016-4504-z.
c
2017 CERN for the benefit of the CMS Collaboration. CC-BY-3.0 license ∗See Appendix A for the list of collaboration members
1
1
Introduction
Top quarks are abundantly produced at the CERN LHC. The predicted top quark pair pro-duction cross section (σtt) in proton-proton (pp) collisions, at a centre-of-mass energy of 8 TeV, is 253 pb, with theoretical uncertainties at the level of 5–6%. A precise measurement of σtt is an important test of perturbative quantum chromodynamics (QCD) at high energies. Further-more, precision tt cross section measurements can be used to constrain the top quark mass mt
and QCD parameters, such as the strong coupling constant αS [1], or the parton distribution
functions (PDF) of the proton [2].
The tt production cross section was measured at the LHC at√s = 7 and 8 TeV [3–25]. In this paper, a measurement of the tt production cross section in the final state with one high trans-verse momentum lepton (muon or electron) and jets is presented using the 2012 data set at √
s = 8 TeV, collected by the CMS experiment at the LHC and corresponding to an integrated luminosity of 19.6 fb−1. To measure the cross section ratio, where several systematic uncer-tainties cancel, the 2011 data set at√s = 7 TeV, corresponding to an integrated luminosity of 5.0 fb−1, has been concurrently analyzed with a similar strategy to the one developed for the cross section measurement at 8 TeV. The new measurement agrees very well with the previ-ously published CMS result [8]. The larger statistical uncertainty of the present measurement with respect to the previous one is due to the simultaneous determination of the b tagging effi-ciency, as discussed in Section 6. Similarly to the 8 TeV analysis, an additional signal modelling uncertainty has been considered in the 7 TeV analysis, as reported in Section 6.
In the standard model, top quarks are predominantly produced in pairs via the strong inter-action and decay almost exclusively into a W boson and a b quark. The event signature is determined by the subsequent decays of the two W bosons. This analysis uses lepton+jets de-cays into muons or electrons, where one of the W bosons dede-cays into two quarks and the other to a lepton and a neutrino. Decays of the W boson into a tau lepton and a neutrino can enter the selection if the tau lepton decays leptonically. The top quark decaying into a b quark and a leptonically decaying W boson is defined in the following as the “leptonic top quark”, while the other top quark is referred to as “hadronic top quark”. For the tt signal two jets result from the hadronization of the b and b quarks (b jets), thus b tagging algorithms are employed for the identification of b jets in order to improve the purity of the tt candidate sample.
The technique for extracting the tt cross section consists of a binned log-likelihood fit of signal and background to the distribution of a discriminant variable in data showing a good separa-tion between signal and background: the invariant mass of the b jet related to the leptonic top quark and the lepton`(M`b). The mass of the three-jet combination with the highest transverse
momentum in the event (M3) is used as a discriminant in an alternative analysis. The M`b
vari-able is related to the leptonic top quark mass, while M3is a measure for the hadronic top quark
mass. Both quantities provide a good separation between signal and background processes. The analysis employs calibration techniques to reduce the experimental uncertainties related to b tagging efficiencies and jet energy scale (JES). The tt topology is reconstructed using a jet sorting algorithm in which the b jet most likely originating from the leptonic top quark is identified. The b tagging efficiency is then determined from a b-enriched sample, in the peak region of the M`bdistribution, correcting for the contamination from non-b jets, following the
method described in Refs. [26, 27]. The rate of jets that are wrongly tagged as originating from a b quark is also measured using data as described in [28]. Independently, the JES is determined using the jets associated with the hadronically decaying W boson by correcting the reconstructed mass of the W boson in the simulation to that determined from the data.
2 3 Data and simulation
The results of the cross section measurements are given both for the visible region, i.e. for the phase space corresponding to the event selection, and for the full phase space. The visible re-gion is defined by requiring the presence in the simulation of exactly one lepton, one neutrino, and at least four jets passing the selection criteria, as presented in Section 5.
This paper is structured as follows: after a description of the CMS detector (see Section 2), the data and the simulated samples are discussed in Section 3, while Section 4 is dedicated to the event selection. The analysis technique and the impact of the systematic uncertainties are addressed in Section 5 and in Section 6. The results of the cross section measurements are discussed in Section 7. Section 8 describes the alternative analysis based on M3, followed by a
summary in Section 9.
2
The CMS detector
The central feature of the CMS apparatus is a superconducting solenoid, of 6 m internal diam-eter, providing an axial magnetic field of 3.8 T. Within the solenoidal field volume are a silicon pixel and strip tracker which measure charged particle trajectories in the pseudorapidity range |η| <2.5. Also within the field volume, the silicon detectors are surrounded by a lead tungstate
crystal electromagnetic calorimeter (|η| < 3.0) and a brass and scintillator hadron calorimeter
(|η| < 5.0) that provide high-resolution energy and direction measurements of electrons and
hadronic jets. Muons are measured in gas-ionization detectors embedded in the steel magnetic flux-return yoke outside the solenoid. The muon detection systems provide muon detection in the range|η| <2.4. A two-level trigger system selects the pp collision events for use in physics
analysis. A more detailed description of the CMS detector, together with a definition of the coordinate system used and the relevant kinematic variables, can be found elsewhere [29].
3
Data and simulation
The cross section measurement is performed using the 8 TeV pp collisions recorded by the CMS experiment in 2012, corresponding to an integrated luminosity of 19.6±0.5 fb−1 [30], and the 2011 data set at√s =7 TeV, corresponding to an integrated luminosity of 5.0±0.2 fb−1[31]. The tt events are simulated using the Monte Carlo (MC) event generators MADGRAPH(version
5.1.1.0) [32, 33] and POWHEG (v1.0 r1380) [34, 35]. In MADGRAPH the top quark pairs are generated at leading order with up to three additional high-pT jets. The POWHEG generator
implements matrix elements to next-to-leading order (NLO) in perturbative QCD, with up to one additional jet. The mass of the top quark is set to 172.5 GeV. The CT10 [36] PDF set is used
byPOWHEGand the CTEQ6M [37–39] by MADGRAPH. ThePYTHIA(v.6.426) [40] andHERWIG
(v.6.520) [41] generators are used to model the parton showering. ThePYTHIAshower matching is done using the MLM prescription [42, 43].
The top quark pair production cross section values are predicted to be 177.3+−4.66.0 (scale)± 9.0(PDF+αS)pb at 7 TeV and 252.9−+8.66.4(scale)±11.7(PDF+αS)pb at 8 TeV, as calculated with
the TOP++ 2.0 program to next-to-next-to-leading order (NNLO) in perturbative QCD,
includ-ing soft-gluon resummation to next-to-next-to-leadinclud-ing logarithmic (NNLL) order (Ref. [44] and references therein), and assuming mt = 172.5 GeV. The first uncertainty comes from
the independent variation of the factorization and renormalization scales, while the second one is associated to variations in the PDF and αS following the PDF4LHC prescription with
the MSTW2008 68% confidence level NNLO, CT10 NNLO, and NNPDF2.3 5f FFN PDF sets (Refs. [37, 38] and references therein, and Refs. [36, 39]).
3
The top quark transverse momentum is reweighted in samples simulated with MADGRAPH
and POWHEG, when interfaced to PYTHIA, in order to better describe the pT distribution
ob-served in the data. Based on studies of differential distributions [45, 46] in the top quark trans-verse momentum, an event weight w = √w1w2 is applied, where the weights wi of the two
top quarks are given as a function of the generated top quark pT values: wi = exp(0.199−
0.00166 piT/GeV)at 7 TeV, and wi = exp(0.156−0.00137 pTi/GeV)at 8 TeV. This reweighting
is only applied to the phase space corresponding to the experimental selections in the muon and electron channels. The agreement between data and samples generated with POWHEG
interfaced withHERWIGis found to be satisfactory, and no reweighting is applied in this case. The W/Z+jets events, i.e. the associated production of W/Z vector bosons with jets, with lep-tonic decays of the W/Z bosons, constitute the largest background. These are also simulated using MADGRAPHwith matrix elements corresponding to at least one jet and up to four jets. The W/Z+jets events are generated inclusively with respect to the jet flavour. Drell–Yan pro-duction of charged leptons is generated for dilepton invariant masses above 50 GeV, as those events constitute the relevant background in the phase space of this analysis. The contribution from Drell–Yan events with dilepton invariant masses below 50 GeV is negligible, as verified with a sample with a mass range of 10–50 GeV. Single top quark production is simulated with
POWHEG. The background processes are normalized to NLO and NNLO cross section
calcula-tions [47–51], with the exception of the QCD multijet background, for which the normalization is obtained from data in the M3 analysis (see Section 8). In the M`banalysis the multijet
back-ground is reduced to a negligible fraction (see Section 4) and thus not considered further. Pileup signals, i.e. extra activity due to additional pp interactions in the same bunch crossing, are incorporated by simulating additional interactions with a multiplicity matching the one inferred from data. The CMS detector response is modeled using GEANT4 [52]. The simulated events are processed by the same reconstruction software as the collision data.
4
Reconstruction and event selection
This analysis focuses on the selection of tt lepton+jets decays in the muon and electron chan-nels, with similar selection requirements applied for the two channels. Muons, electrons, pho-tons, and neutral and charged hadrons are reconstructed and identified by the CMS particle-flow (PF) algorithm [53, 54]. The energy of muons is obtained from the corresponding track mo-mentum using the combined information of the silicon tracker and the muon system [55]. The energy of electrons is determined from a combination of the track momentum in the tracker, the corresponding cluster energy in the electromagnetic calorimeter, and the energy sum of all bremsstrahlung photons associated to the track [56]. The vertex with the largest p2Tsum of the tracks associated to it is chosen as primary vertex.
Candidate tt events are first accepted by dedicated triggers requiring at least one muon or elec-tron. Lepton isolation requirements are applied to improve the purity of the selected sample. At the trigger level the relative muon isolation, the sum of transverse momenta of other parti-cles in a cone of size∆R=√(∆φ)2+ (∆η)2 =0.4 around the direction of the candidate muon
divided by the muon transverse momentum, is required to be less than 0.2. Similarly, for elec-trons, the corresponding requirement is less than 0.3 in a cone of size 0.3. Events with a muon in the final state are triggered on the presence of a muon candidate with pT > 24 GeV and |η| <2.1. Events with an electron candidate with|η| <2.5 are accepted by triggers requiring
an electron with pT >27 GeV.
4 4 Reconstruction and event selection
good quality [55] track with pT > 25 GeV and|η| < 2.1. Electrons are identified using a
com-bination of the shower shape information and track-electromagnetic cluster matching [56], and are required to have pT > 32 GeV and|η| < 2.5, with the exclusion of the transition region
between the barrel and endcap electromagnetic calorimeter, 1.44< |η| < 1.57. Electrons
iden-tified to come from photon conversions [56] are vetoed. Correction factors for trigger and lepton identification efficiencies have been determined with a tag-and-probe method [57] from data/simulation comparison as a function of the lepton pT and η, and are applied to the
simu-lation.
Signal events are required to have at least one pp interaction vertex, successfully reconstructed from at least four tracks, within limits on the longitudinal and radial coordinates [58], and exactly one muon, or electron, with an origin consistent with the reconstructed vertex within limits on the impact parameters. Since the lepton from the W boson decay is expected to be isolated from other activity in the event, isolation requirements are applied. A relative isolation is defined as Irel = (Icharged+Iphoton+ Ineutral)/pT, where pT is the transverse momentum of
the lepton and Icharged, Iphoton, and Ineutralare the sums of the transverse energies of the charged
particles, the photons, and the neutral particles not identified as photons, in a cone ∆R < 0.4(0.3) for muons (electrons) around the lepton direction, excluding the lepton itself. The relative isolation Irelis required to be less than 0.12 for muons and 0.10 for electrons. Events
with more than one lepton candidate with relaxed requirements are vetoed in order to reject Z boson or tt decays into dileptons.
The missing energy in the transverse plane (EmissT ) is defined as the magnitude of the projection on the plane perpendicular to the beams of the vector sum of the momenta of all PF candidates. It is required to be larger than 30 GeV in the muon channel and larger than 40 GeV in the electron channel, because of the larger multijet background.
Jets are clustered from the charged and neutral particles reconstructed with the PF algorithm, using the anti-kT jet algorithm [59] with a radius parameter of 0.5. Particles identified as
iso-lated muons or electrons are not used in the jet clustering. Jet energies are corrected for nonlin-earities due to different responses in the calorimeters and for the differences between measured and simulated responses [60]. Furthermore, to account for extra activity within a jet cone due to pileup, jet energies are corrected [53, 54] for charged hadrons that belong to a vertex other than the primary vertex, and for the amount of pileup expected in the jet area from neutral jet constituents.
At least four jets are required with pT >40 GeV and|η| <2.5. An additional global calibration
factor of the jet energy scale is obtained by fitting the W boson mass distribution in the data and in the simulation. The scale factor is determined as the ratio of the W boson mass reconstructed from non-b-tagged jet pairs in data and in the simulation. This scale correction is applied in the simulation to all jets before the selection requirements are implemented. It largely reduces the systematic uncertainty related to the jet energy scale, discussed in Section 6.
To reduce contamination from background processes, at least one of the jets has to be identified as a b jet. The b tagging algorithm used is the “combined secondary vertex” (CSV) algorithm at the medium working point [26, 27], corresponding to a misidentification probability of about 1% for light-parton jets (mistag rate) and an efficiency for b jets in the range 60–70% depending on the jet pT and pseudorapidity. Figure 1 shows kinematic distributions after applying the
b tagging requirement. Good agreement between data and simulation is observed.
The M`banalysis uses control samples in data for the estimation of the b tagging efficiency, as
5
decaying top quark through a χ2 sorting algorithm using top quark and W boson mass con-straints. The remaining fourth jet is the b jet candidate assigned to the leptonically decaying top quark. The b tagging algorithm is only applied to this b jet candidate.
Owing to differences in the triggers and in the centre-of-mass energies, in the 7 TeV analysis slightly different selection criteria are applied on the lepton pTand ETmiss. The muon transverse
momentum is required to be larger than 26 GeV, while the electron pT has to be larger than
30 GeV. No explicit EmissT requirement is needed in the muon channel. Events with EmissT > 30 GeV are selected in the electron channel.
0 200 400 600 800 1000 1200 CMS 1400 Data signal t t other t t Single t ν l → W/Z+jets (GeV) jet1 T p 0 50 100 150 200 250 300 350 400 450 500 Data / MC Events / 5 GeV 0.6 0.81 1.2 (19.6 fb-18 TeV ) 0 500 1000 1500 2000 CMS 2500 Data signal t t other t t Single t ν l → W/Z+jets (GeV) jet2 T p 0 50 100 150 200 250 300 350 400 450 500 Data / MC Events / 5 GeV 0.6 0.81 1.2 (19.6 fb-1 8 TeV) 0 500 1000 1500 2000 CMS 2500 3000 Data signal t t other t t Single t ν l → W/Z+jetsW 0 50 100 150 200 250 300 350 400 450 500 Data / MC Events / 5 GeV 0.6 0.81 1.2 1 (19.6 fb-18 TeV ) µ T p (GeV) 0 200 400 600 800 1000 1200 CMS 1400 Data signal t t other t t Single t ν l → W/Z+jets 0 50 100 150 200 250 300 Data / MC Events / 3 GeV 0.6 0.81 1.2 (19.6 fb-18 TeV ) (jmiss GeV) E T
Figure 1: Transverse momentum distributions of the first- and second-leading jet (top), the muon and ETmissdistribution (bottom) for all relevant processes in the muon+jets channel with the requirement of at least one b-tagged jet. The simulation is normalized to the standard model cross section values and pT-reweighting is applied to the tt contribution. The
multi-jet background is negligible and not shown. The distributions are already corrected for the b tagging efficiency scale factor. The hashed area shows the uncertainty in the luminosity mea-surement and the b tagging systematic uncertainty. The last bin includes the overflow. The ratio between data and simulation is shown in the lower panels for bins with non-zero entries.
5
Visible and total cross section measurements
The number of tt events is determined with a binned maximum-likelihood fit of distributions (templates), describing signal and background processes, to the data sample passing the final selection, by fitting M`b, the invariant mass distribution of the b jet and the lepton.
6 5 Visible and total cross section measurements
The tt visible (σttvis) and total (σtt) production cross sections are extracted from the number of tt events observed in the data using the equations
σttvis = Ntt
L εtt, σtt =
σttvis
A , (1)
where Nttis the number of tt events (including both signal events from the lepton+jets channel considered and events from other decay channels) extracted from the fit, L is the integrated luminosity, A is the tt acceptance, and εtt is the tt selection efficiency within the acceptance requirements outlined in the next section. Results are presented for both the visible and total cross section, in order to separate experimental uncertainties from theoretical assumptions as much as possible.
One template is used for tt events (both for the tt signal events and the other tt events passing the selection criteria) and one template for all background processes (W/Z+jets and single top quark production). The fit is performed in the range 0–500 GeV. Figure 2 shows the results for the fit to the data distributions in the muon and electron channels.
(GeV) b µ M 0 50 100 150 200 250 300 350 400 450 500 Events / 10 GeV 0 500 CMS 1000 1500 2000 2500 Data t t Background /ndf = 0.92 2 χ Fit (8TeV) s -1 19.6 fb (GeV) eb M 0 50 100 150 200 250 300 350 400 450 500 Events / 10 GeV 0 200 400 CMS 600 800 1000 1200 1400 1600 1800 Data t t Background /ndf = 0.73 2 χ Fit (8 TeV) s -1at 19.6 fb
Figure 2: Distributions of the lepton-jet mass in the muon+jets (left) and electron+jets (right) channels, rescaled to the fit results.
5.1 Acceptance
The tt acceptance A corresponding to the visible phase space depends on the theoretical model and it is determined at the generator level by requiring the presence of exactly one lepton, one neutrino, and at least four jets, passing pT and |η| selection criteria similar to the ones
delineated in Section 4. For simplicity a single acceptance definition, corresponding to the tightest selection criteria, is used for both channels at each centre-of-mass energy: exactly one muon, or electron, with pT>32 GeV and|η| <2.1, one neutrino with pT >40 GeV, and at least
four jets with pT >40 GeV and|η| <2.5.
The acceptance values include contributions from other tt decay channels, in particular from the dilepton channel, at the level of about 9%.
The acceptance values are provided in Table 1 for the two generators used in this analysis,
MADGRAPHandPOWHEG. The acceptance values are in agreement at the 1–2% level at 8 TeV
and at better than 5% at 7 TeV. This different level of agreement is due to the fact that the com-mon acceptance definition described above corresponds the tightest pT criteria, i.e. to the pT
5.2 Selection efficiency 7
as the number of reweighted tt events in the visible phase space, i.e. the sum of the weights, divided by the total number of (non-reweighted) tt events.
The statistical uncertainty in the acceptance calculations is below 3%. The theoretical system-atic uncertainties evaluated by varying the PDFs (Section 6) or the matching thresholds are in the range 0.1–0.2%. Variation of the factorization and renormalization scale induces a varia-tion of up to 2% in the acceptance. These variavaria-tions are already included in the systematic uncertainties quoted in Section 6.
In the following, top quark pT-reweighting [45, 46] is always applied to the visible phase space
as it provides a better agreement between data and simulation. On the other hand, given that the event weights were only determined in the phase space corresponding to the experimental selection, they have not been used for the extrapolation to the total cross section. Therefore, the non-reweighted acceptance is used to determine the total cross section. However, rescaling by the ratio of the values provided in Table 1 would allow a determination of the total cross section with the reweighted acceptance. The visible cross section does not depend on the acceptance A. Table 1: Average acceptance values for the muon and electron channels obtained with MAD
-GRAPHandPOWHEGat√s =7 and 8 TeV, without and with top quark pT-reweighting applied.
The statistical uncertainty is 0.0004, i.e. below 3%. The theoretical uncertainties are at the level of 2%, as discussed in the text.
Generator A ( √
s=7 TeV) A (√s=8 TeV) no rew. with rew. no rew. with rew. MADGRAPH 0.0158 0.0156 0.0166 0.0162
POWHEG 0.0151 0.0149 0.0163 0.0161
5.2 Selection efficiency
The selection efficiency within the acceptance, εtt, is reported in Table 2. It is determined from the pT-reweighted MADGRAPH simulated sample as the number of events passing the
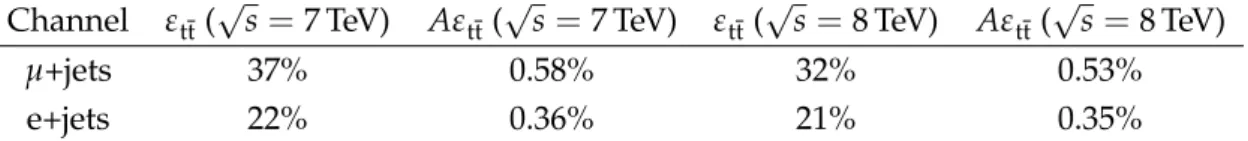
selec-tion criteria outlined in Secselec-tion 4, over the number of events passing the acceptance require-ments defined above. The selection efficiency includes the effects of trigger requirerequire-ments, lep-ton and jet identification criteria, and b tagging efficiency, which is directly determined from data. A signal selection efficiency within acceptance of 32% in the muon channel and 21% in the electron channel is determined. Similar values (37% and 22%, respectively) are obtained at √s = 7 TeV. For the muon channel the common acceptance requirements used for both channels are tighter than the selection requirements, thus the muon channel efficiency is signif-icantly larger than the electron channel efficiency. The tt selection efficiency, Aεtt, is the number of selected tt events out of all produced tt pairs, in all decay channels.
Table 2: Signal selection efficiencies, at√s = 8 TeV, determined from simulation using MAD -GRAPH. The non-reweighted acceptance from Table 1 is used. The relative statistical
uncer-tainty on εttis below 3%. Channel εtt(
√
s =7 TeV) Aεtt(√s=7 TeV) εtt(
√
s=8 TeV) Aεtt(√s =8 TeV)
µ+jets 37% 0.58% 32% 0.53%
8 6 Systematic uncertainties
6
Systematic uncertainties
Systematic uncertainties are determined by varying each source within its estimated uncer-tainty and by propagating the variation to the cross section measurements. Template shapes and signal efficiencies are varied together according to the systematic uncertainty considered. The uncertainty is given by the shift in the fitted cross section and is cross-checked by repeating its estimation with pseudo-experiments using simulation. The systematically varied template shapes are fit to pseudo-data generated using the nominal template shapes and normalizations. The validation with pseudo-experiments shows that the fit performs as expected. All system-atic uncertainties, except the ones related to b tagging and to the estimation of the multijet background, are common to both the M`band the M3measurements.
The effect of uncertainties in the JES is evaluated by varying the JES within the pT- and
η-dependent uncertainties given in Ref. [60]. The final JES of the simulation is matched to that in data by applying an additional global correction factor α to all jet momenta before selection. The α calibration values are individually determined for nominal conditions and for each of the variations related to JES and JER. In addition to the selection described in Section 4, two b-tagged jets are required in order to increase the signal purity. The mass of the hadronically decaying W boson is reconstructed as the dijet invariant mass from all combinations of non b-tagged jets. The dijet invariant mass distributions are fitted in data and in simulation with a function describing the W boson signal peak and the dijet combinatorial background. The
αvalues are determined as the ratios of the fitted W boson masses in data and in simulation.
In the M`banalysis α= 1.011±0.004 is obtained with the nominal samples both in the muon
and electron channels, with variations of the order of±1.5% for the samples with down and up variations of the JES. The same values are determined by the M3analysis. This additional
calibration reduces the size of the JES systematic uncertainty by approximately 60%. The JES uncertainty, reported in Table 3, consists of several sources, all propagated individually. Details of the individual contributions are explained in [61].
Table 3: Components (in %) of the JES uncertainty at 8 TeV in the muon and electron channels. The correlation coefficients used in their combination are also shown.
Source µ+jets e+jets Correlation
Absolute scale ±0.33 ±0.40 0.0 Global jet scale factor α ±0.59 ±0.39 0.0 Relative FSR ±0.46 ±0.41 1.0 Relative pT ±0.67 ±0.57 1.0
Flavour JES ±1.84 ±1.79 1.0 Flavour JES fragmentation ±0.50 ±0.46 1.0 Flavour JES semileptonic BR ±0.11 ±0.16 1.0 High-pTextra ±0.18 ±0.23 1.0
Single pion ±0.21 ±0.27 1.0
Pileup ±0.35 ±0.31 1.0
Time ±0.17 ±0.24 1.0
Total JES ±2.23 ±2.13 0.9
The impact of the jet energy resolution (JER) is estimated by applying η-dependent variations with an average of ±10%. The JES and JER variations are propagated to the ETmiss. In addi-tion, the contribution to ETmiss arising from energy depositions not contained in jets is varied
9
by±10% [60]. The uncertainty related to the pileup modelling is determined by propagating a ±5% variation [62] to the central value of the inelastic cross section. Variations in the compo-sition of the main background processes, W+jets and Z+jets, are conservatively evaluated by varying independently their cross sections by ±30% [63–65]. Additional uncertainties on the heavy flavour component in W/Z+jets production are not explicitly taken into account and are assumed to be covered by the 30% uncertainty. The variation of the normalization of the single top quark background by 30% gives a negligible contribution. The trigger efficiency and lepton identification correction factors are determined with a tag-and-probe method [57] in dilepton events and are varied within their pT- and η-dependent uncertainties.
Uncertainties from the b tagging efficiency and mistag rate are evaluated in the M3 analysis
by varying the correction factors within their uncertainties [26, 27] quoted in Section 8. In the M`banalysis, on the other hand, the b tagging efficiency for b jets is measured from data, using
the technique described in Refs. [26–28], on the same selected event sample as that for the cross section determination, but before b tagging. The M`bvariable is used not only as a cross section
estimator, but also as a b tagging discriminator. The statistical and systematic uncertainties in the b tagging and mistag efficiencies are propagated to the statistical and systematic uncertain-ties in the cross section measurements. For this reason the statistical uncertainty obtained by the M`banalysis is larger than the one of the M3analysis. A systematic uncertainty is assigned
to the choice, based on simulation, of the b-enriched (for M`bvalues below 140 GeV) and of the
b-depleted (for M`b in the range 140–240 GeV) regions, by shifting the windows by±30 GeV.
Since the b tagging efficiency and mistag rate are derived from data and since they are re-determined when evaluating the effect of the various systematic uncertainties, no additional uncertainties are included. The method is shown [26–28] to be stable for different b tagging algorithms and working points.
Theoretical uncertainties are taken from detailed studies performed on simulated samples. They include the common factorization and renormalization scales, which are varied by a fac-tor of 1/4 and 4 from the default value equal to the Q2for the tt or W/Z+jet events. The effect
of the jet-parton matching threshold on tt and W+jets events is studied by varying the thresh-old used for matching the matrix element level to the particles created in the parton showering by a factor of 0.5 or 2. Uncertainties from the choice of PDF are evaluated by using the Hes-sian method [66] with the parameters of the CTEQ6.6 PDF set [67]. Other PDF sets (including their uncertainties) yield very similar results. The PDFs and their uncertainties are determined from a fit to collision data yielding the Hessian matrix. Each of the 22 eigenvectors obtained by diagonalizing the matrix is varied within its uncertainties. The differences with respect to the nominal prediction are determined independently for each eigenvector and are added in quadrature. The systematic uncertainty due to the top quark pT-reweighting procedure
de-scribed in Section 3 is evaluated as the difference with respect to the measurement obtained with the non-reweighted sample. Only the variation due to the template shape is considered, as the correction is meant to modify the shape only.
A “signal modelling” uncertainty is attributed to the choice of the generators. It comprises changes in matrix element and parton shower implementation. The effect of the matrix element generator is evaluated by usingPOWHEG(instead of MADGRAPH) interfaced toPYTHIA, while
the parton shower modelling is evaluated withPOWHEGandHERWIGinstead ofPOWHEGand
PYTHIA. Regarding the two corresponding uncertainties, the former is always positive and
the latter is always negative. For 7 TeV the same values determined for 8 TeV are used. As discussed in Section 7, the “signal modelling” uncertainty is symmetrized by taking the larger of the two contributions (±4.4%).
10 7 Results and combination
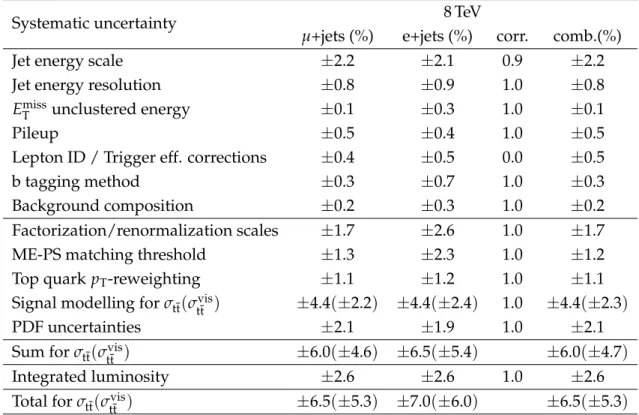
An uncertainty of 2.6% [30] (2.2% [31]) is assigned to the determination of the 2012 (2011) in-tegrated luminosity. The resulting effects from all sources are added in quadrature. Tables 4 and 5 provide an overview of the contributions to the systematic uncertainty on the combined cross section measurements in the M`bmeasurements at 7 and 8 TeV.
Table 4: Overview of the systematic uncertainties in the measurement of the tt cross sections at 8 TeV, both for the total and the visible cross sections. For the “signal modelling” uncertainty the larger between the matrix element (ME) and parton shower (PS) uncertainties is taken, as explained in Section 6. The correlations assumed for the combination of the muon and electron channels are also given.
Systematic uncertainty 8 TeV
µ+jets (%) e+jets (%) corr. comb.(%)
Jet energy scale ±2.2 ±2.1 0.9 ±2.2
Jet energy resolution ±0.8 ±0.9 1.0 ±0.8 EmissT unclustered energy ±0.1 ±0.3 1.0 ±0.1
Pileup ±0.5 ±0.4 1.0 ±0.5
Lepton ID / Trigger eff. corrections ±0.4 ±0.5 0.0 ±0.5
b tagging method ±0.3 ±0.7 1.0 ±0.3
Background composition ±0.2 ±0.3 1.0 ±0.2 Factorization/renormalization scales ±1.7 ±2.6 1.0 ±1.7 ME-PS matching threshold ±1.3 ±2.3 1.0 ±1.2 Top quark pT-reweighting ±1.1 ±1.2 1.0 ±1.1
Signal modelling for σtt(σttvis) ±4.4(±2.2) ±4.4(±2.4) 1.0 ±4.4(±2.3)
PDF uncertainties ±2.1 ±1.9 1.0 ±2.1
Sum for σtt(σttvis) ±6.0(±4.6) ±6.5(±5.4) ±6.0(±4.7)
Integrated luminosity ±2.6 ±2.6 1.0 ±2.6 Total for σtt(σttvis) ±6.5(±5.3) ±7.0(±6.0) ±6.5(±5.3)
7
Results and combination
The results in the muon and electron channels, shown in Tables 6 and 7, are in good agreement. The combination of the channel results is performed using the best linear unbiased estimator (BLUE) method [68–70]. Asymmetric systematic uncertainties are symmetrized for the use with BLUE by taking half of the full range, except for the “signal modelling” uncertainty, where the maximum, 4.4%, is taken for σtt. Full correlation is assumed for all systematic uncertainties between the two channels, except for lepton identification and trigger uncertainties, which are assumed to be uncorrelated.
Owing to the additional jet energy calibration from data, a correlation coefficient of 0.9 is ob-tained for the overall JES uncertainty. This correlation is determined from the correlation coeffi-cients in Table 3 and it is compatible with the value inferred by comparing the combined result with and without the additional calibration. Varying the JES correlation coefficient between 0 and 1 has only a minor effect on the combined results. For example, the total cross section at 8 TeV varies by less than 0.5%, and the cross section ratio varies only by approximately 0.1%. A combination based on the relative statistical precision of the two channels would also yield compatible results. Variations of the correlations of other experimental systematic uncertainties
7.1 Results at√s=8 TeV 11
Table 5: Overview of the systematic uncertainties in the measurement of the tt cross sections at 7 TeV, both for the total and the visible cross sections. For the “signal modelling” uncertainty the larger between the matrix element (ME) and parton shower (PS) uncertainties is taken, as explained in Section 6. The correlations assumed for the combination of the muon and electron channels are also shown.
Systematic uncertainty 7 TeV
µ+jets (%) e+jets (%) corr. comb.(%)
Jet energy scale ±4.8 ±5.2 0.9 ±4.4
Jet energy resolution ±1.4 ±1.1 1.0 ±1.1 Emiss
T unclustered energy <0.05 ±0.3 1.0 ±0.2
Pileup ±0.4 ±0.6 1.0 ±0.5
Lepton ID / Trigger eff. corrections ±1.4 ±1.7 0.0 ±0.8
b tagging method ±0.5 ±0.6 1.0 ±0.6
Background composition ±0.5 ±0.4 1.0 ±0.5 Factorization/renormalization scales ±3.7 ±0.4 1.0 ±2.1 ME-PS matching threshold ±2.0 ±1.7 1.0 ±1.8 Top quark pT-reweighting ±1.1 ±1.2 1.0 ±1.1
Signal modelling for σtt(σttvis) ±4.4(±2.2) ±4.4(±2.4) 1.0 ±4.4(±2.3)
PDF uncertainties ±2.3 ±1.9 1.0 ±2.2
Sum for σtt(σttvis) ±8.4(±7.5) ±7.7(±6.8) ±7.4(±6.4)
Integrated luminosity ±2.2 ±2.2 1.0 ±2.2 Total for σtt(σttvis) ±8.7(±7.8) ±8.0(±7.1) ±7.7(±6.7)
have negligible effect on the combined results.
The integrated luminosity and the pileup uncertainties are assumed to be fully correlated be-tween channels at the same centre-of-mass energy, and uncorrelated bebe-tween 7 and 8 TeV for the cross section ratio.
7.1 Results at
√
s=
8 TeVThe visible cross section obtained from the fit to the M`bdistribution, using MADGRAPHsignal
templates for mt=172.5 GeV, is
σttvis(combined) =3.80±0.06 (stat)±0.18 (syst)±0.10 (lumi) pb.
The statistical uncertainty includes the contribution from the simultaneous determination of the b tagging efficiency (see Section 6). There is excellent agreement with the measurement of the visible cross section using POWHEG for the efficiency within the kinematic acceptance selected by this analysis.
Using the acceptance values of Table 1, the visible cross section measurements in the electron and muon channels are first extrapolated to the full phase space and then combined to obtain the following total cross section measurement
12 7 Results and combination
The measurements are in good agreement with the theoretical prediction
σttth.(8 TeV) =252.9−+8.66.4(scale)±11.7(PDF+αS)pb
(see Section 3), for mt =172.5 GeV.
The BLUE combination yields the following relative weights of the muon and electron chan-nels, and their correlations, respectively. At 8 TeV they are: 1.07 (1.09), −0.07 (−0.09), with correlation coefficient 0.88 (0.91) for the total (visible) cross section, while at 7 TeV they are: 0.50 (0.51), 0.50 (0.49), with correlation coefficient 0.71 (0.65). The negative weights of the electron channel in the combination of the total and visible cross section at 8 TeV depend on the choice of the JES correlation coefficient (0.9) used in the combination. Smaller JES correlation coefficients (0.5 for the total cross section and 0.2 for the visible cross section) would yield positive BLUE weights. The negative weights causes the combined central value, 228.5 pb, to lie outside the interval of the two individual measurements, as summarized in Tables 6 and 7.
Alternatively, usingPOWHEGinstead of MADGRAPH, the combined total cross section at 8 TeV shifts by+8.6 pb. The difference, at the level of less than 4%, is mainly ascribed to the different acceptance for the two generators.
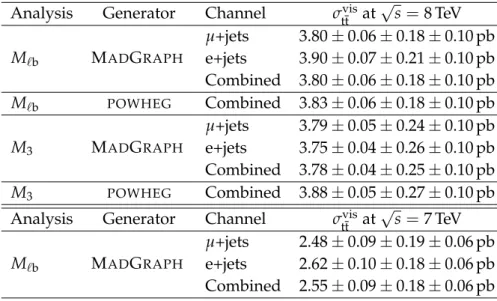
All results are summarized in Tables 6 and 7 for mt=172.5 GeV. ForPOWHEGthe same relative
systematic uncertainties as determined for MADGRAPHare used.
Table 6: Visible cross section measurements at√s =7 and 8 TeV with the reference analysis M`b
and the alternative analysis M3(described in Section 8). Results obtained for mt = 172.5 GeV
with MADGRAPHand withPOWHEGare shown. The uncertainties are in the order: statistical, systematic, and due to the luminosity determination.
Analysis Generator Channel σttvisat
√ s =8 TeV M`b MADGRAPH µ+jets 3.80±0.06±0.18±0.10 pb e+jets 3.90±0.07±0.21±0.10 pb Combined 3.80±0.06±0.18±0.10 pb M`b POWHEG Combined 3.83±0.06±0.18±0.10 pb M3 MADGRAPH µ+jets 3.79±0.05±0.24±0.10 pb e+jets 3.75±0.04±0.26±0.10 pb Combined 3.78±0.04±0.25±0.10 pb M3 POWHEG Combined 3.88±0.05±0.27±0.10 pb
Analysis Generator Channel σttvisat
√ s =7 TeV M`b MADGRAPH µ+jets 2.48±0.09±0.19±0.06 pb e+jets 2.62±0.10±0.18±0.06 pb Combined 2.55±0.09±0.18±0.06 pb
7.2 Dependence on the top quark mass at
√
s=
8 TeVUsing simulation, the dependence of the measured total cross section on the top quark mass is determined to be linear in the mt range from 161.5 to 184.5 GeV. The top quark mass value
used for the central results is 172.5 GeV. The slope values reported in Table 8 can be used to linearly adjust the results in the two channels to other mass values. For mt =173.3 GeV [71] the
adjusted results of the two channels yield a combined cross section value
7.2 Dependence on the top quark mass at√s=8 TeV 13
Table 7: Total cross section measurements at√s =7 and 8 TeV with the reference analysis M`b
and the alternative analysis M3(described in Section 8). Results obtained for mt = 172.5 GeV
with MADGRAPHand withPOWHEGare shown. The uncertainties are in the order: statistical, systematic, and due to the luminosity determination.
Analysis Generator Channel σttat
√ s=8 TeV M`b MADGRAPH µ+jets 228.9±3.4±13.7±6.0 pb e+jets 234.6±3.9±15.2±6.2 pb Combined 228.5±3.8±13.7±6.0 pb M`b POWHEG Combined 237.1±3.9±14.2±6.2 pb M3 MADGRAPH µ+jets 228.7±2.6±19.0±6.0 pb e+jets 225.8±2.4±19.1±5.9 pb Combined 227.1±2.5±19.1±6.0 pb M3 POWHEG Combined 238.4±2.8±20.0±6.2 pb
Analysis Generator Channel σttat
√ s=7 TeV M`b MADGRAPH µ+jets 157.7±5.5±13.2±3.4 pb e+jets 165.8±6.5±12.8±3.6 pb Combined 161.7±6.0±12.0±3.6 pb
Table 8: Slope values for the muon and electron channels obtained with linear fits to the cross section values at√s = 8 TeV as a function of the top quark mass. The MADGRAPH generator is used. The change in sign is due to the acceptance A.
Channel Slope (%/GeV) of σvis
tt Slope (%/GeV) of σtt
µ+jets +0.50±0.06 −0.66±0.05
14 8 Alternative approach at√s=8 TeV using M3
7.3 Results at
√
s=
7 TeV and cross section ratioAt√s=7 TeV the measured cross section, with MADGRAPH, is
σtt(combined) =161.7±6.0 (stat)±12.0 (syst)±3.6 (lumi) pb.
The measurements are in good agreement with the theoretical expectation
σttth.(7 TeV) =177.3−+6.04.6(scale)±9.0(PDF+αS)pb
at 7 TeV, for a top quark mass of 172.5 GeV.
From the measurements of the total cross section at the two centre-of-mass energies, a cross section ratio R8/7 is determined. In the ratio the experimental uncertainties, which are corre-lated between the two analyses (at√s = 7 or 8 TeV, in each channel) cancel out, leading to an improved precision in comparison to the individual measurements at 7 or 8 TeV. The ratio is first determined in the individual muon (1.45±0.09) and electron (1.41±0.09) channels and then combined. The measured ratio is
R8/7 =1.43±0.04 (stat)±0.07 (syst)±0.05 (lumi).
In the combination of the ratios in the two channels the theoretical uncertainties, and the jet-related uncertainties are assumed to be 100% corjet-related, except the JES uncertainty, which is taken as 90% correlated. The other experimental uncertainties are assumed to be uncorre-lated. The expected values of the cross section ratio, for instance R8/7th. =1.429±0.001 (scale)± 0.004(PDF) ±0.001(ffs) ±0.001(mt)[2], for the MSTW08 PDF set and for mt=173.3 GeV, are
in good agreement with the measurement.
8
Alternative approach at
√
s
=
8 TeV using M
3In the M3analysis similar requirements for the selection of tt lepton+jets decays are used, with
slightly different pT-threshold values. Only the differences with respect to the main selection
are summarized in the following.
At least four jets are required within |η| < 2.5 and with pT > 50, 40, 30, and 30 GeV in the
muon channel, and pT > 50, 45, 35, and 30 GeV in the electron channel. Slightly tighter pT
selection criteria are applied in the electron channel because of the larger multijet background. Muons are required to have transverse momentum larger than 26 GeV. In the muon channel no explicit requirement is applied on the missing energy in the transverse plane, while EmissT has to be larger than 20 GeV in the electron channel.
The M3 analysis uses a correction factor of (0.95±0.02) [26, 27] to the simulated events to
reproduce the different b tagging efficiency in data and simulation, and a correction factor of (1.11±0.01±0.12)[26, 27] to take into account the different probability that a light-quark or gluon jet is identified as a b jet. These correction factors are determined following Refs. [26, 27]. No correction factors are applied in the M`banalysis, where these efficiencies are determined
from data.
Different strategies to take into account the multijet background are developed for the M`band
M3 analyses. In the former, this background is reduced to a negligible level thanks to tighter
selection requirements on EmissT and on the transverse momenta of the third and fourth jets. In the M3analysis, looser selection cuts are chosen and the multijet background is considered
15
further in the analysis. Since MC simulation can not adequately reproduce the shape and nor-malization of multijet events, this background is thus estimated from data.
Selected multijet events mostly consist of semileptonic heavy-flavour decays and, in the elec-tron channel, events in which pions in jets are misidentified as elecelec-trons. Such events feature lepton candidates not coming from W boson decays and thus not truly isolated. The shape of the accepted multijet background is extracted from a sideband data sample where leptons have large relative isolation, greater than 0.17 in the muon channel and 0.2 in the electron channel. The data sample is selected such that it is rich in multijet background and poor in tt signal and in other processes such as W+jets. The remaining tt, W+jets and Z+jets contamination is estimated and subtracted using simulation. Other backgrounds, for example single top quark production, are neglected because of their smaller contributions. The nominal multijet shape is taken as the distribution measured in the sideband after subtracting the components described above.
The template fit is performed with the M3 distribution in the range 0–1400 GeV. One single
template is used for tt events (both for the tt signal events and the other tt events passing the selection requirements) and individual templates are used for each background process. The tt, single top quark, W+jets, and Z+jets templates, used in the likelihood maximization, are taken from simulation, while the multijet template is estimated from data as described above. Because of the similarity between the single top quark and the tt templates, the single top quark contribution is constrained by a Gaussian distribution of 30% width to its expected value. The choice of the constraint has a negligible effect on the final result. The normalization of the signal and background processes, including the multijet background, is determined by the fit itself. The muon and electron channels are combined with the BLUE method to obtain the quoted combined result.
The measured cross section with the M3template fit is
σtt(combined) =227.1±2.5 (stat)±19.1 (syst)±6.0 (lumi) pb.
The M3 distributions in the muon and electron channels are shown in Fig. 3. Good
agree-ment is observed between data and the templates. The results are compatible with those of the M`banalysis and are summarized in Tables 6 and 7. The main contributions to the systematic
uncertainties of the combined result are, in decreasing order: signal modelling (4.4%), factor-ization and renormalfactor-ization scales (2.9%), multijet background subtraction (2.2%), JES (2.1%), PDF (1.6%), and b tagging efficiency and mistag rate (1.5%). The uncertainty related to the mul-tijet background subtraction is estimated by evaluating two effects. The subtracted tt, W+jets, and Z+jets contaminations are varied by 50%. In addition, we assign an uncertainty to the as-sumption that the M3 shape does not vary in different regions of relative lepton isolation, by
repeating the analysis in six different intervals of the relative lepton isolation.
9
Summary
A measurement of the tt production cross section at √s = 8 TeV is presented, using the data collected with the CMS detector and corresponding to an integrated luminosity of 19.6 fb−1. The analysis is performed in the tt lepton+jets decay channel with one muon or electron and at least four jets in the final state with at least one b-tagged jet. The tt cross section is extracted using a binned maximum-likelihood fit of templates from simulated events to the data sample. The results from the two lepton+jets channels are combined using the BLUE method.
16 9 Summary 19.6 �b-1 (8 TeV) Ev en ts/25 Ge V M3 (GeV) CMS (μ + jets) Data tt W/Z+jets Single t QCD 19.6 �b-1 (8 TeV) Ev en ts/25 Ge V M3 (GeV) CMS (e + jets) Data tt W/Z+jets Single t QCD
Figure 3: Distributions of the M3 mass in the 8 TeV data, for the muon+jets (left) and
elec-tron+jets (right) channels, rescaled to the template likelihood fit results. The last filled bin includes the overflow.
Techniques based on control samples in data are used to determine the b tagging efficiency and to calibrate the jet energy scale. These techniques allow for a better determination of the corresponding systematic uncertainties, particularly for the JES, which is a dominant source of experimental uncertainty.
In the kinematic range defined in the simulation with exactly one muon, or electron, with pT > 32 GeV and|η| < 2.1, one neutrino with pT > 40 GeV, and at least four jets with pT >
40 GeV and|η| <2.5, the measured visible tt cross section at
√
s = 8 TeV is 3.80±0.06 (stat)± 0.18 (syst)±0.10 (lumi) pb.
Using the MADGRAPHgenerator for the extrapolation to the full phase space, the total tt cross section at 8 TeV is 228.5±3.8 (stat)±13.7 (syst)±6.0 (lumi) pb. The result of an alternative anal-ysis, which makes use of the observable M3, is in good agreement with this value.
Furthermore, the analysis performed using data at √s = 7 TeV, yields a total cross section measurement of 161.7±6.0 (stat)±12.0 (syst)±3.6 (lumi) pb. The measured cross section ratio, where a number of experimental uncertainties cancel out, is 1.43±0.04 (stat)±0.07 (syst)± 0.05 (lumi).
All measurements are in agreement with the NNLO theoretical predictions.
Acknowledgments
We congratulate our colleagues in the CERN accelerator departments for the excellent perfor-mance of the LHC and thank the technical and administrative staffs at CERN and at other CMS institutes for their contributions to the success of the CMS effort. In addition, we grate-fully acknowledge the computing centres and personnel of the Worldwide LHC Computing Grid for delivering so effectively the computing infrastructure essential to our analyses. Fi-nally, we acknowledge the enduring support for the construction and operation of the LHC and the CMS detector provided by the following funding agencies: the Austrian Federal Min-istry of Science, Research and Economy and the Austrian Science Fund; the Belgian Fonds de la Recherche Scientifique, and Fonds voor Wetenschappelijk Onderzoek; the Brazilian Fund-ing Agencies (CNPq, CAPES, FAPERJ, and FAPESP); the Bulgarian Ministry of Education and Science; CERN; the Chinese Academy of Sciences, Ministry of Science and Technology, and Na-tional Natural Science Foundation of China; the Colombian Funding Agency (COLCIENCIAS);
17
the Croatian Ministry of Science, Education and Sport, and the Croatian Science Foundation; the Research Promotion Foundation, Cyprus; the Ministry of Education and Research, Esto-nian Research Council via IUT23-4 and IUT23-6 and European Regional Development Fund, Estonia; the Academy of Finland, Finnish Ministry of Education and Culture, and Helsinki Institute of Physics; the Institut National de Physique Nucl´eaire et de Physique des Partic-ules / CNRS, and Commissariat `a l’ ´Energie Atomique et aux ´Energies Alternatives / CEA, France; the Bundesministerium f ¨ur Bildung und Forschung, Deutsche Forschungsgemeinschaft, and Helmholtz-Gemeinschaft Deutscher Forschungszentren, Germany; the General Secretariat for Research and Technology, Greece; the National Scientific Research Foundation, and Na-tional Innovation Office, Hungary; the Department of Atomic Energy and the Department of Science and Technology, India; the Institute for Studies in Theoretical Physics and Mathe-matics, Iran; the Science Foundation, Ireland; the Istituto Nazionale di Fisica Nucleare, Italy; the Ministry of Science, ICT and Future Planning, and National Research Foundation (NRF), Republic of Korea; the Lithuanian Academy of Sciences; the Ministry of Education, and Uni-versity of Malaya (Malaysia); the Mexican Funding Agencies (CINVESTAV, CONACYT, SEP, and UASLP-FAI); the Ministry of Business, Innovation and Employment, New Zealand; the Pakistan Atomic Energy Commission; the Ministry of Science and Higher Education and the National Science Centre, Poland; the Fundac¸˜ao para a Ciˆencia e a Tecnologia, Portugal; JINR, Dubna; the Ministry of Education and Science of the Russian Federation, the Federal Agency of Atomic Energy of the Russian Federation, Russian Academy of Sciences, and the Russian Foun-dation for Basic Research; the Ministry of Education, Science and Technological Development of Serbia; the Secretar´ıa de Estado de Investigaci ´on, Desarrollo e Innovaci ´on and Programa Consolider-Ingenio 2010, Spain; the Swiss Funding Agencies (ETH Board, ETH Zurich, PSI, SNF, UniZH, Canton Zurich, and SER); the Ministry of Science and Technology, Taipei; the Thailand Center of Excellence in Physics, the Institute for the Promotion of Teaching Science and Technology of Thailand, Special Task Force for Activating Research and the National Sci-ence and Technology Development Agency of Thailand; the Scientific and Technical Research Council of Turkey, and Turkish Atomic Energy Authority; the National Academy of Sciences of Ukraine, and State Fund for Fundamental Researches, Ukraine; the Science and Technology Facilities Council, UK; the US Department of Energy, and the US National Science Foundation. Individuals have received support from the Marie-Curie programme and the European Re-search Council and EPLANET (European Union); the Leventis Foundation; the A. P. Sloan Foundation; the Alexander von Humboldt Foundation; the Belgian Federal Science Policy Of-fice; the Fonds pour la Formation `a la Recherche dans l’Industrie et dans l’Agriculture (FRIA-Belgium); the Agentschap voor Innovatie door Wetenschap en Technologie (IWT-(FRIA-Belgium); the Ministry of Education, Youth and Sports (MEYS) of the Czech Republic; the Council of Science and Industrial Research, India; the HOMING PLUS programme of the Foundation for Polish Science, cofinanced from European Union, Regional Development Fund; the Compagnia di San Paolo (Torino); the Consorzio per la Fisica (Trieste); MIUR project 20108T4XTM (Italy); the Thalis and Aristeia programmes cofinanced by EU-ESF and the Greek NSRF; the National Pri-orities Research Program by Qatar National Research Fund; the Rachadapisek Sompot Fund for Postdoctoral Fellowship, Chulalongkorn University (Thailand); and the Welch Foundation.
18 References
References
[1] CMS Collaboration, “Determination of the top-quark pole mass and strong coupling constant from the tt production cross section in pp collisions at√s= 7 TeV”, Phys. Lett. B
728(2014) 496, doi:10.1016/j.physletb.2013.12.009, arXiv:1307.1907. [Corrigendum: doi:10.1016/j.physletb.2014.08.040].
[2] M. Czakon, M. L. Mangano, A. Mitov, and J. Rojo, “Constraints on the gluon PDF from top quark pair production at hadron colliders”, JHEP 07 (2013) 167,
doi:10.1007/JHEP07(2013)167, arXiv:1303.7215.
[3] CMS Collaboration, “First measurement of the cross section for top-quark pair production in proton-proton collisions at√s=7 TeV”, Phys. Lett. B 695 (2011) 424, doi:10.1016/j.physletb.2010.11.058.
[4] CMS Collaboration, “Measurement of the tt production cross section and the top quark mass in the dilepton channel in pp collisions at 7 TeV”, JHEP 07 (2011) 049,
doi:10.1007/JHEP07(2011)049, arXiv:1105.5661.
[5] CMS Collaboration, “Measurement of the tt production cross section in pp collisions at√ s =7 TeV using the kinematic properties of events with leptons and jets”, Eur. Phys. J. C 71 (2011) 1721, doi:10.1140/epjc/s10052-011-1721-3.
[6] CMS Collaboration, “Measurement of the tt production cross section in pp collisions at 7 TeV in lepton+jets events using b-quark jet identification”, Phys. Rev. D 84 (2011) 092004, doi:10.1103/PhysRevD.84.092004, arXiv:1108.3773.
[7] CMS Collaboration, “Measurement of the tt production cross section in the dilepton channel in pp collisions at 7 TeV”, JHEP 11 (2012) 067,
doi:10.1007/JHEP11(2012)067, arXiv:1208.2671.
[8] CMS Collaboration, “Measurement of the tt production cross section in pp collisions at√ s =7 TeV with lepton+jets final states”, Phys. Lett. B 720 (2013) 83,
doi:10.1016/j.physletb.2013.02.021, arXiv:1212.6682.
[9] CMS Collaboration, “Measurement of the tt production cross section in the all-jet final state in pp collisions at√s =7 TeV”, JHEP 05 (2013) 065,
doi:10.1007/JHEP05(2013)065, arXiv:1302.0508.
[10] CMS Collaboration, “Measurement of the tt production cross section in the τ+jets channel in pp collisions at√s =7 TeV”, Eur. Phys. J. C 73 (2013) 2386,
doi:10.1140/epjc/s10052-013-2386-x, arXiv:1301.5755.
[11] CMS Collaboration, “Measurement of the tt production cross section in pp collisions at√ s =7 TeV in dilepton final states containing a τ”, Phys. Rev. D 85 (2012) 112007, doi:10.1103/PhysRevD.85.112007, arXiv:1203.6810.
[12] ATLAS Collaboration, “Measurement of the top quark-pair production cross section with ATLAS in pp collisions at√s=7 TeV”, Eur. Phys. J. C 71 (2011) 1577,
doi:10.1140/epjc/s10052-011-1577-6, arXiv:1012.1792.
[13] ATLAS Collaboration, “Measurement of the tt production cross section in the tau+jets channel using the ATLAS detector”, Eur. Phys. J. C 73 (2013) 2328,
References 19
[14] ATLAS Collaboration, “Measurement of the top quark pair production cross-section with ATLAS in the single lepton channel”, Phys. Lett. B 711 (2012) 244,
doi:10.1016/j.physletb.2012.03.083, arXiv:1201.1889.
[15] ATLAS Collaboration, “Measurement of the top quark pair cross-section with ATLAS in pp collisions at√s =7 TeV using final states with an electron or a muon and a
hadronically decaying τ lepton”, Phys. Lett. B 717 (2012) 89,
doi:10.1016/j.physletb.2012.09.032, arXiv:1205.2067.
[16] ATLAS Collaboration, “Measurement of the cross section for top-quark pair production in pp collisions at√s=7 TeV with the ATLAS detector using final states with two high-pTleptons”, JHEP 05 (2012) 059, doi:10.1007/JHEP05(2012)059,
arXiv:1202.4892.
[17] ATLAS Collaboration, “Measurement of the top quark pair production cross section in pp collisions at√s =7 TeV in dilepton final states with ATLAS”, Phys. Lett. B 707 (2012) 459, doi:10.1016/j.physletb.2011.12.055, arXiv:1108.3699.
[18] ATLAS Collaboration, “Measurement of the tt production cross section using eµ events with b-tagged jets in pp collisions at√s =7 and 8 TeV with the ATLAS detector”, Eur. Phys. J. C 74 (2014) 3109, doi:10.1140/epjc/s10052-014-3109-7,
arXiv:1406.5375.
[19] CMS Collaboration, “Measurement of the tt production cross section in the dilepton channel in pp collisions at√s =8 TeV”, JHEP 02 (2014) 024,
doi:10.1007/JHEP02(2014)024, arXiv:1312.7582. [Erratum: doi:10.1007/JHEP02(2014)102].
[20] CMS Collaboration, “Measurement of the tt production cross section in pp collisions at√ s =8 TeV in dilepton final states containing one τ lepton”, Phys. Lett. B 739 (2014) 23, doi:10.1016/j.physletb.2014.10.032, arXiv:1407.6643.
[21] CMS Collaboration, “Measurement of the tt production cross section in the all-jet final state in pp collisions at√s =8 TeV”, Eur. Phys. J. C 76 (2016) 128,
doi:10.1140/epjc/s10052-016-3956-5.
[22] ATLAS Collaboration, “Simultaneous measurements of the tt, W+W−, and Z/γ∗→ττ
production cross section in pp collisions at√s =7 TeV with the ATLAS detector”, Phys. Rev. D 91 (2015) 052005, doi:10.1103/PhysRevD.91.052005.
[23] ATLAS Collaboration, “Measurement of the top pair production cross section in 8 TeV proton-proton collisions using kinematic information in the lepton+jets final states with ATLAS”, Phys. Rev. D 91 (2015) 112013, doi:10.1103/PhysRevD.91.112013, arXiv:1504.04251.
[24] ATLAS Collaboration, “Measurement of the top quark branching ratios into channels with leptons and quarks with the ATLAS detector”, Phys. Rev. D 92 (2015) 072005, doi:10.1103/PhysRevD.92.072005.
[25] CMS Collaboration, “Measurement of the tt production cross section in the eµ channel in proton-proton collisions at√s=7 and 8 TeV with the CMS experiment”, (2016).
20 References
[26] CMS Collaboration, “Identification of b-quark jets with the CMS Experiment”, JINST 08 (2013) P04013, doi:10.1088/1748-0221/8/04/P04013, arXiv:1211.4462. [27] CMS Collaboration, “Performance of b tagging at√s=8 TeV in multijet, tt and boosted
topology events”, CMS Physics Analysis Summary CMS-PAS-BTV-13-001, 2013.
[28] M. Maes, “Measurement of the top quark pair production cross section at the LHC with the CMS experiment”. PhD thesis, Vrije Universiteit Brussels, 2013.
[29] CMS Collaboration, “The CMS experiment at the CERN LHC”, JINST 3 (2008) S08004, doi:10.1088/1748-0221/3/08/S08004.
[30] CMS Collaboration, “CMS luminosity based on pixel cluster counting — Summer 2013 update”, CMS Physics Analysis Summary CMS-PAS-LUM-13-001, 2013.
[31] CMS Collaboration, “Absolute Calibration of the Luminosity Measurement at CMS: Winter 2012 Update”, CMS Physics Analysis Summary CMS-PAS-SMP-12-008, 2012. [32] J. Alwall et al., “MadGraph 5: going beyond”, JHEP 06 (2011) 128,
doi:10.1007/JHEP06(2011)128, arXiv:1106.0522.
[33] J. Alwall et al., “The automated computation of tree-level and next-to-leading order differential cross sections, and their matching to parton shower simulations”, JHEP 07 (2014) 079, doi:10.1007/JHEP07(2014)079, arXiv:1405.0301.
[34] S. Alioli, P. Nason, C. Oleari, and E. Re, “NLO vector-boson production matched with shower in POWHEG”, JHEP 07 (2008) 060,
doi:10.1088/1126-6708/2008/07/060, arXiv:0805.4802.
[35] S. Frixione, P. Nason, and C. Oleari, “Matching NLO QCD computations with parton shower simulations: the POWHEG method”, JHEP 11 (2007) 070,
doi:10.1088/1126-6708/2007/11/070, arXiv:0709.2092.
[36] J. Gao et al., “The CT10 NNLO global analysis of QCD”, Phys. Rev. D 89 (2014) 033009, doi:10.1103/PhysRevD.89.033009, arXiv:1302.6246.
[37] S. Alekhin et al., “The PDF4LHC Working Group interim report”, (2011). arXiv:1101.0536.
[38] M. Botje et al., “The PDF4LHC Working Group interim recommendations”, (2011). arXiv:1101.0538.
[39] R. D. Ball et al., “Parton distributions with LHC data”, Nucl. Phys. B 867 (2013) 244, doi:10.1016/j.nuclphysb.2012.10.003, arXiv:1207.1303.
[40] T. Sj ¨ostrand, S. Mrenna, and P. Z. Skands, “PYTHIA 6.4 physics and manual”, JHEP 05 (2006) 026, doi:10.1088/1126-6708/2006/05/026, arXiv:hep-ph/0603175. [41] G. Corcella et al., “HERWIG 6.5: an event generator for hadron emission reactions with
interfering gluons (including supersymmetric processes)”, JHEP 01 (2001) 010, doi:10.1088/1126-6708/2001/01/010, arXiv:hep-ph/0011363.
[42] M. L. Mangano, M. Moretti, F. Piccinini, and M. Treccani, “Matching matrix elements and shower evolution for top- quark production in hadronic collisions”, JHEP 01 (2007) 013, doi:10.1088/1126-6708/2007/01/013, arXiv:hep-ph/0611129.
References 21
[43] J. Alwall, S. de Visscher, and F. Maltoni, “QCD radiation in the production of heavy colored particles at the LHC”, JHEP 02 (2009) 017,
doi:10.1088/1126-6708/2009/02/017, arXiv:0810.5350.
[44] M. Czakon, P. Fiedler, and A. Mitov, “Top++: a program for the calculation of the top-pair cross-section at hadron colliders”, Comp. Phys. Commun. 185 (2014) 2930,
doi:10.1016/j.cpc.2014.06.021, arXiv:1112.5675.
[45] CMS Collaboration, “Measurement of differential top-quark pair production cross sections in pp collisions at√s =7 TeV”, Eur. Phys. J. C 73 (2013) 2339,
doi:10.1140/epjc/s10052-013-2339-4, arXiv:1211.2220.
[46] CMS Collaboration, “Measurement of the differential cross section for top quark pair production in pp collisions at√s =8 TeV”, Eur. Phys. J. C 75 (2015) 542,
doi:10.1140/epjc/s10052-015-3709-x, arXiv:1505.04480.
[47] R. Gavin, Y. Li, F. Petriello, and S. Quackenbush, “FEWZ 2.0: A code for hadronic Z production at next-to-next-to-leading order”, Comp. Phys. Commun. 182 (2011) 2388, doi:10.1016/j.cpc.2011.06.008, arXiv::1011.3540.
[48] R. Gavin, Y. Li, F. Petriello, and S. Quackenbush, “W physics at the LHC with FEWZ 2.1”, Comput. Phys. Commun. 184 (2013) 208, doi:10.1016/j.cpc.2012.09.005,
arXiv:1201.5896.
[49] J. M. Campbell and R. K. Ellis, “MCFM for the Tevatron and the LHC”, Nucl. Phys. Proc. Suppl. 205-206 (2010) 10, doi:10.1016/j.nuclphysbps.2010.08.011,
arXiv:1007.3492.
[50] J. M. Campbell and F. Tramontano, “Next-to-leading order corrections to Wt production and decay”, Nucl. Phys. B 726 (2005) 109,
doi:10.1016/j.nuclphysb.2005.08.015, arXiv:hep-ph/0506289. [51] J. M. Campbell, R. K. Ellis, and F. Tramontano, “Single top production and decay at
next-to-leading order”, Phys. Rev. D 70 (2004) 094012,
doi:10.1103/PhysRevD.70.094012, arXiv:hep-ph/0408158.
[52] GEANT4 Collaboration, “GEANT4: a simulation toolkit”, Nucl. Inst. Meth. A 506 (2003) 250, doi:10.1016/S0168-9002(03)01368-8.
[53] CMS Collaboration, “Particle–flow event reconstruction in CMS and performance for jets, taus, and EmissT ”, CMS Physics Analysis Summary CMS-PAS-PFT-09-001, 2009.
[54] CMS Collaboration, “Commissioning of the particle-flow reconstruction in minimum-bias and jet events from pp collisions at 7 TeV”, CMS Physics Analysis Summary CMS-PAS-PFT-10-002, 2010.
[55] CMS Collaboration, “Performance of CMS muon reconstruction in pp collision events at√ s =7 TeV”, JINST 7 (2012) P10002, doi:10.1088/1748-0221/7/10/P10002, arXiv:1206.4071.
[56] CMS Collaboration, “Performance of electron reconstruction and selection with the CMS detector in proton-proton collisions at√s=8 TeV”, JINST 10 (2015) P06005,
22 References
[57] CMS Collaboration, “Measurement of the inclusive W and Z production cross section in pp collisions at√s =7 TeV with the CMS experiment”, JHEP 10 (2011) 070,
doi:10.1007/JHEP10(2011)007, arXiv:1108.0566.
[58] CMS Collaboration, “Description and performance of track and primary-vertex reconstruction with the CMS tracker”, JINST 9 (2014) P10009,
doi:10.1088/1748-0221/9/10/P10009, arXiv:1405.6569.
[59] M. Cacciari, G. P. Salam, and G. Soyez, “The anti-ktjet clustering algorithm”, JHEP 04
(2008) 063, doi:10.1088/1126-6708/2008/04/063, arXiv:0802.1189.
[60] CMS Collaboration, “Determination of jet energy calibration and transverse momentum resolution in CMS”, JINST 06 (2011) P11002,
doi:10.1088/1748-0221/6/11/P11002, arXiv:1107.4277.
[61] CMS and ATLAS Collaboration, “Jet energy scale uncertainty correlations between ATLAS and CMS”, CMS Physics Analysis Summary CMS-PAS-JME-14-003,
ATLAS-PHYS-PUB-2014-020, 2014.
[62] TOTEM Collaboration, “First measurement of the total proton-proton cross section at the LHC energy of√s=7 TeV”, Europhys. Lett. 96 (2011) 21002,
doi:10.1209/0295-5075/96/21002, arXiv:1110.1395.
[63] CMS Collaboration, “Measurement of the W+W−and ZZ production cross section in pp collisions at√s=8 TeV”, Phys. Lett. B 721 (2013) 190,
doi:10.1016/j.physletb.2013.03.027.
[64] CMS Collaboration, “Measurement of the W+W−cross section at√s=7 TeV and limits on anomalous WWγ and WWZ couplings”, Eur. Phys. J. C 73 (2013) 2610,
doi:10.1140/epjc/s10052-013-2610-8.
[65] CMS Collaboration, “Measurement of the ZZ production cross section and search for anomalous couplings in 2``0final states in pp collisions at√s=7 TeV”, JHEP 01 (2013) 063, doi:10.1007/JHEP01(2013)063.
[66] J. Pumplin et al., “Uncertainties of predictions from parton distribution functions II: the Hessian method”, Phys. Rev. D 65 (2001) 014013,
doi:10.1103/PhysRevD.65.014013, arXiv:hep-ph/0101032.
[67] P. M. Nadolsky et al., “Implications of CTEQ global analysis for collider observables”, Phys. Rev. D 78 (2008) 013004, doi:10.1103/PhysRevD.78.013004,
arXiv:0802.0007.
[68] L. Lyons, D. Gibaut, and P. Clifford, “How to combine correlated estimates of a single physical quantity”, Nucl. Inst. Meth. A 270 (1988) 110,
doi:10.1016/0168-9002(88)90018-6.
[69] A. Valassi, “Combining correlated measurements of several different physical quantities”, Nucl. Inst. Meth. A 500 (2003) 391, doi:10.1016/S0168-9002(03)00329-2.
[70] A. Valassi and R. Chierici, “Information and treatment of unknown correlations in the combination of measurements using the BLUE method”, Eur. Phys. J. C 74 (2014) 2717, doi:10.1140/epjc/s10052-014-2717-6, arXiv:1307.4003.
[71] ATLAS, CDF, CMS, and D0 Collaborations, “First combination of Tevatron and LHC measurements of the top-quark mass”, (2014). arXiv:1403.4427.