STUDY OF THE FE UPTAKE SYSTEMS IN TWO DIFFERENT RICE CULTIVARS
by
Ana Margarida Patrício Pereira
STUDY OF THE FE UPTAKE SYSTEMS IN TWO DIFFERENT RICE CULTIVARS
Thesis presented to Escola Superior de Biotecnologia of the Universidade Católica Portuguesa to fulfill the requirements of Master of Science degree in Applied Microbiology
by
Ana Margarida Patrício Pereira
Place: Escola Superior de Biotecnologia da Universidade Católica Portuguesa
Supervision: Doctor Marta Wilton de Vasconcelos Co-supervision: Prof. Doctor Ana Gomes
iii RESUMO
O arroz (Oryza sativa L.) alimenta mais de metade da população do mundo e é rico em diversidade genética, com milhares de variedades cultivadas em todo o mundo. A deficiência de ferro (Fe) constitui um dos principais stresses abióticos na produção agrícola dado que, em solos calcários, que abrangem cerca de 30 % dos solos cultivados do mundo, o Fe forma complexos solúveis e não está prontamente disponível para absorção pelas plantas. Durante muito tempo, as plantas foram divididas em dois grupos distintos, pela sua capacidade de absorção de Fe: dicotiledóneas, que utilizam a Estratégia I e utilizam um sistema de redução e transporte de Fe2+; e as monocotiledóneas gramíneas, plantas da Estratégia II, que usam um sistema baseado nos fitosideróforos (PS). Recentemente, evidências sugerem que o arroz, além de usar a Estratégia II, pode também usar um transportador de Fe2+, típico das plantas de Estratégia I, conferindo vantagem em solos alagados onde o Fe2+ está mais disponível.
O objetivo deste estudo foi compreender se as plantas de arroz têm ou não a capacidade de sobre expressar mecanismos relacionados com a Estratégia I para a absorção de Fe. De forma a cumprir estes objetivos, duas cultivares diferentes de arroz com suscetibilidades diferentes para a deficiência de Fe foram cultivadas em sistema hidropónico, nomeadamente, Nipponbare (cujo genoma foi já sequenciado) e Bico Branco (nunca antes estudada), para analisar vários parâmetros ao nível fisiológico e molecular.
Os resultados obtidos mostraram que a cultivar Bico Branco acumulou mais minerais nas raízes e a Nipponbare na parte aérea e que, quando a absorção de Fe é reduzida, há um aumento na absorção de outros minerais, principalmente de zinco (Zn), manganês (Mn) e cobre (Cu). No que diz respeito aos pigmentos fotossintéticos, a cultivar Bico Branco mostrou-se mais suscetível à deficiência de Fe do que Nipponbare, por ter desenvolvido maior clorose. Além disso, teve maior atividade da enzima reductase de Fe sob deficiência de Fe e apresentou níveis elevados de expressão do gene OsFRO2 nas raízes, gene responsável pela redução de Fe. Esta nova descoberta mostra que certas cultivares de arroz podem beneficiar do sistema de redução de Fe, principalmente porque o arroz é conhecido por produzir PS em baixas quantidades e crescer em solos aeróbicos/terras altas, onde o Fe3+ é abundante.
Foram também identificados novos genes candidatos no arroz, nomeadamente, OsFPN1, OsFPN2, OsMYB2 e OsMYBS3, que revelaram ser importantes na homeostase do Fe em arroz.
v ABSTRACT
Rice (Oryza sativa L.) feeds more than half of the world’s population and is rich in genetic diversity, with thousands of varieties grown throughout the world. Iron (Fe) deficiency is a major abiotic stress in crop production, since in calcareous soils, which account for about 30% of the world’s cultivated soils, Fe form soluble complexes and is not readily available for uptake. For a long time plants have been divided into two distinct groups, by their capacity for Fe uptake: dicotyledoneas, that belong to Strategy I and utilize an Fe reduction and Fe2+ transporter system; and graminaceous monocotyledoneas, strategy II plants, that use an phytosiderophore (PS)-based system. Recently, evidences suggest that rice, in addition to use Strategy II, can also use an Fe2+ transporter, typical in Strategy I plants, that could confer advantage in flooded soils where Fe2+ is more available.
The aim of this study was to understand if rice plants have or not the capacity to up-regulate Strategy I mechanisms for Fe uptake. To meet these purposes, two different rice cultivars with different susceptibilities to Fe deficiency, were grown hydroponically, namely, Nipponbare (whose genome has already been sequenced) and Bico Branco (never studied before) to analyze various parameters at a physiological and molecular level.
The results obtained showed that Bico Branco cultivar accumulated more minerals in roots and Nipponbare in shoots and that when Fe uptake is decreased there is an increase on the uptake of some other minerals, mainly zinc (Zn), manganese (Mn) and copper (Cu). In what concerns the photosynthetic pigments, the Bico Branco cultivar showed to be more susceptible to Fe deficiency than the Nipponbare cultivar, as the first developed more chlorosis than the latter. Furthermore, the Nipponbare cultivar revealed the highest Fe-reductase activity under Fe deficient conditions and revealed higher levels of expression of OsFRO2 gene in the roots, a gene that is responsible for Fe reduction. These new findings show that some rice cultivars may utilize the Fe-reduction system, mainly because rice is known for producing PS in low amounts and grow in aerobic/upland where Fe3+ is more available.
Also, new candidate genes in rice were identified, namely OsFPN1, OsFPN2, OsMYB2 and OsMYBS3, and they revealed to be important in Fe homeostasis in rice.
vii ACKNOWLEDGMENTS
First of all, I want to thank my parents for the opportunity they gave me to complete my studies at a graduate level, for always supporting my decisions and for always being by my side.
I would also like to express my sincere gratitude to my thesis supervisors, Marta Wilton Vasconcelos, for the guidance, support and constructive advice throughout my entire research work; and Ana Gomes, for the encouragement in this stage of my academic life. I thank both for the review of the scientific writing and for giving me the opportunity to complete my master's degree under your guidance.
To “my” research group, Plantech, I would like to thank for all the support, friendship, knowledge and brainstorming that we have shared, and for the help they gave me whenever I needed, especially to Carla Santos, my sincere appreciation.
I am also thankful to my boyfriend, António, and to my friends Patrícia, Filipa, Venessa, Ana Vaz, Marta, Joana and Vicente, for their unconditional support, patience, help, for their love and friendship, and for always believing in me!
Finally, my thanks to all the people who have crossed my path and those who, in some way or another, allowed this work to take place.
ix CONTENTS
RESUMO………...iii
ABSTRACT……….…...v
ACKNOWLEDGMENTS………...vii
LIST OF FIGURES………..……….………....xi
LIST OF TABLES………..xiii
ABBREVIATIONS………...xv
1. INTRODUCTION………...1
1.1History and production………...1
1.2 Rice growing habits and grain types..………...3
1.3 Nutritional Characteristics of Rice………...5
1.4 Iron deficiency, a global problem……….………..…….…...7
1.5 Iron deficiency in plants……….………..9
1.6 New candidate genes………...13
2. OBJECTIVES……….15
2.1 General objectives……….15
2.2Specific objectives………...………….15
3.MATERIAL AND METHODS………...16
3.1 Cultivars selection………...16
3.1.1 Germination rate………...17
3.1.2 Seed mineral analysis………...17
3.2 Plant growth………...17
3.3 Photosynthetic pigments extraction ………...18
3.4 Root Fe-reductase activity assay………...19
3.5 Total RNA extraction……….19
3.6 cDNA Synthesis……….20
3.7 Gene expression analysis..….….….….……..………….…….………….……….21
3.8 Elemental analysis………...22
x
4. RESULTS AND DISCUSSION………...22
4.1 Rice cultivars selection………...24
4.2Physiological responses to Fe deficiency.………..26
4.2.1 Photosynthetic pigment accumulation……...………...27
4.2.2 Mineral Accumulation in shoots and roots………...29
4.2.3 Root Fe reductase activity assay………...32
4.3Molecular responses to Fe deficiency………...34
4.3.1 Strategy I-related genes………...34
4.3.2 Strategy II-related genes………..37
4.3.3 New candidate genes in rice………41
5.CONCLUSIONS………...45
6.FUTURE WORK……….47
7.ANNEXES………...48
xi LIST OF FIGURES
Figure 1.1.1 A) Percent of global rice production by region in 2012; B) Rice production in Europe in 2012 (data from FAO, 2012)………..2 Figure 1.2.1 Distribution map of irrigated rice, rainfed lowland rice and rainfed upland rice in different world regions (from IRRIa, 2009)………..………..4 Figure 1.4.1 Strategies for Fe uptake from the soil. (A) Strategy I; (B) Strategy II (adapted from Sperotto et al., 2012b; Walker and Connolly, 2008)…………11 Figure 4.1.1 Germination rate of 21 rice (Oryza sativa L.) cultivars at seven and 14 days after germination.……….……….……….……….……..24 Figure 4.1.2 Concentration of Fe in seeds of 21 rice (Oryza sativa L.) cultivars. Data are mean±standard error. Data are mean±standard error An average of three technical replicates was analyzed……….25 Figure 4.2.1.1 Fe deficiency chlorosis in shoots of (A) Bico Branco and (B) Nipponbare cultivars after three weeks under Fe deficiency (Fe-) (0 μM Fe(III)-EDDHA) ) (left panels) and Fe sufficiency (Fe+) (20 μM Fe(III)-EDDHA) (right panels) hydroponic conditions..27 Figure 4.2.1.2 Anthocyanin (Anth), chlorophyll a (Cha) and b (Chb), total chlorophyll (ChT) and carotenoid (Cart) concentrations in shoots of (A) Bico Branco and (B) Nipponbare cultivars. Plants were grown in 0 μM EDDHA (Fe-) and 20 μM Fe(III)-EDDHA (Fe+) conditions for three weeks. Results show the mean+SEM of five plants. Significant differences are indicated by asterisk (p<0.05)...……….28 Figure 4.2.2.1 Micronutrient concentrations (µg/g dry weight) of shoots (, ) and roots (, ) of (A) Bico Branco and (B) Nipponbare cultivars, using ICP-OES. Rice plants were grown for three weeks in Fe deficient (0 μM Fe(III)-EDDHA) (, ) and Fe sufficient (20 μM Fe(III)-EDDHA) (, ) hydroponic conditions. Results show the mean±SEM of three plants. Significant differences between Fe treatments for each species are indicated by an asterisk (p<0.05)……….………..30 Figure 4.2.3.1 Roots Fe reductase activity of Bico Branco and Nipponbare cultivars, when grown for three weeks under Fe deficient (0 μM Fe(III)-EDDHA) () and Fe sufficient (20 μM Fe(III)-EDDHA) () hydroponic conditions. Results show mean±SEM of five plants. Significant differences are indicated by asterisk (p<0.05)………33 Figure 4.3.1.1 Quantitative RT-PCR analysis of genes related with Strategy I and Strategy II of Fe uptake, in (A) Bico Branco and (B) Nipponbare cultivars. Total RNA was extracted
xii
from shoots and roots of plants grown hydroponically for three weeks under Fe deficient (0 μM Fe(III)-EDDHA) and Fe sufficient (20 μM Fe(III)-EDDHA) conditions. A pool of three plants of each condition was used. The results were normalized using the housekeeping gene 18S (-rRNA)………...………...36 Figure 4.3.2.1 Schematic diagram integrating the expression data of Strategy I and II-related genes in both rice cultivars obtained with quantitative RT-PCR analyses (please see text for further details)………...41 Figure 4.3.3.1. Quantitative RT-PCR analysis of new candidate genes in (A) Bico Branco and (B) Nipponbare cultivars. Total RNA was extracted from shoots and roots of plants grown hydroponically for three weeks under Fe deficient (0 μM Fe(III)-EDDHA) (Fe-) and Fe sufficient (20 μM Fe(III)-EDDHA) (Fe+) conditions. A pool of three plants of each condition was used. The results were normalized using the housekeeping gene 18S (-rRNA).………...…42
xiii LIST OF TABLES
Table 1.3.1 Nutrient composition of rice grain varieties (adapted from FAO, 2004; Agricultural Engineering Unit and IRRI, 2013)……..………...6
Table 3.1.1 Oryza sativa L. ecotypes, cultivar names, and country of origin …………16 Table 3.7.1 Accession orthologs used in qRT-PCR………48 Table 3.7.2 Accession numbers and primer sequences used in qRT-PCR analysis……49
xv ABBREVIATIONS
Al Aluminum
At Arabidopsis thaliana
ATP Adenosine triphosphate
B Boron
B.C. Before Christ
bHLH Basic helix-loop-helix
BPDS Bathophenanthroline disulfonic acid
CaCl2 Calcium chloride
Ca(NO3)2 Calcium nitrate
cDNA Complementary deoxyribonucleic acid
Cd Cadmium
Cl Chlorine
cm Centimeters
Co Cobalt
Cu Copper
CuSO4 Copper sulphate
DMA Deoxymugineic acid
DMAS Deoxymugineic acid synthase
dNTP Deoxyribonucleotide triphosphate
DW Dry weight
Dw Dendrobium Woo Leng
EDDHA Ethylenediamine-N,N'-bis(2-hydroxyphenylacetic acid EDTA Ethylenediamine tetraacetic acid
Fe Iron
Fe2+ Ferrous iron
Fe3+ Ferric iron
FIT1 Fe-deficiency induced transcription factor 1
FPN Ferroportin
FRO Ferric reductase-oxidase
FW Fresh Weight
g Gram
GUS β-Glucuronidase
h Hours
H+ Hydrogen ion
H2MoO4 Molybdic acid
H3BO3 Boric acid
Ha Hectare
HNO3 Nitric acid
I Iodine
ICP-OES Inductively Coupled Plasma- Optical Emission Spectroscopy
xvi IRO2 Iron-related transcription factor 2
IRT Iron-regulated transporter
K Potassium
K2SO4 Potassium sulphate
KH2PO4 Potassium dihydrogen orthophosphate
KNO3 Potassium nitrate
MA Mugineic acid
Mb Mega base pairs
MES 2,4-morpholino-ethane sulfonic acid
mg Milligrams
min Minutes
mL Milliliters
mM Millimolar
Mn Manganese
MnSO4 Manganese sulphate
Mo Molybdenum
Mx Malus xiaojinensis
N Nitrogen
NA Nicotianamine
Na Sodium
NAAT1 Nicotianamine amino transferase 1
NAS Nicotianamine synthase
Ni Nickel
NiSO4 Nickel sulfate
nm Nanometer
Os Oryza sativa L.
P Phosphorus
Pb Lead
PS Phytosiderophores
qRT-PCR Real Time quantitative Reverse Transcription polymerase chain reaction
RNA Ribonucleic acid
UV Ultra-violet
WHO World Health Organization
YSL Yellow stripe-like
ZIP Zinc Regulated Transport/Iron Regulated Transport-like Protein
Zn Zinc
ZnSO4 Zinc sulphate
1 1. INTRODUCTION
1.1 History and production
Rice is the oldest food of the world and at the same time the most current (Maclean et al., 2002). Its origins have been debated for some time, but it is thought that rice plant remains from 10,000 B.C. were discovered in a Spirit Cave on the Thailand-Myanmar border. Migrant people from southern China or perhaps northern Vietnam carried the traditions of wetland rice cultivation to the Philippines during the second millennium B.C. (Maclean et al., 2002). The crop may well have been introduced in Europe, more accurately in Greece and the neighboring areas of the Mediterranean by Alexander Magno in expedition to India around 344-324 B.C. From central positioning in Greece and Sicily, rice gradually spread throughout southern Europe and to a few locations in northern Africa (Maclean et al., 2002).
The Arabs introduced rice in the Iberian Peninsula in the 8th century (771), but it was during the reign of D. Dinis, O Lavrador (1279-1325), that the first references to rice cultivation appear in Baixo Mondego, in the area of Montemor-o-Velho. After his reign, rice growing was abandoned and then restored in the 18th century (MADRP, 2002). During World War I, rice consumption was strongly increased and became embedded in Portuguese agriculture (Lains, 2003). In 1929, under the dictatorial regime of Salazar, began a strong regulatory protectionist stance for cereals, known as the "Wheat Campaign" where wetland areas were reclaimed and these arable lands that were unproductive, were chosen to plant rice (MADRP, 2002). In 1972 the total amount of land harvested for rice reached its maximum at 43.487 ha, showing the great success of Salazar's protectionist policies (Vianna Silva, 1975). The first reform in 1995 (COUNCIL REGULATION (EC) 3072/1995) provided further stimulus to grow rice, the production-dependent subsidies were seen as an incentive for greater improvement in yields that led to an unexpected increase in rice production (Commission of the European Communities, 2002). Currently, rice is grown in the basins of Mondego (Figueira da Foz, Coimbra), Sado (Alcácer do Sal), Tejo, Beira Baixa and other regions in smaller scale (Panzone et al., 2009).
2 Africa 3,80% Americas 4,98% Asia 90,49% Europe 0,60% Oceania 0,13% Italy 35% Greece 6% Russian Federation 24% Spain 21% Ukraine 4% Portugal 4% Others 6%
Rice is grown in more than a hundred countries, with a total harvested area in 2012 of approximately 163 million ha (FAO, 2012), producing more than 700 million tons annually. The main producer in the world is Asia, which accounts for over 90 % of the world production of rice (Figure 1.1.1A), with China and India producing the most, according to the latest data provided by FAO (2012). Thailand is the world largest exporter of milled rice, with about 10 million tons exported in 2011, followed by Vietnam, India and Pakistan.
Rice production in Europe is indicated in Figure 1.1.1B. Italy and the Russian Federation, in that order, are the largest producers with about 1,500,000.00 and 1,051,891.00 tons in 2012, respectively, followed closely by Spain with a production of 881,000.00 tons. Portugal is currently the sixth producer in Europe with 184,100.00 tons produced in 2012, supplying more than 236 million tons of rice in 2009, more exactly 151 Kcal/capita/day. In 2011, Portugal exported about 25,609.00 tons of rice (FAO, 2012).
Figure 1.1.1 A) Percent of global rice production by region in 2012; B) Rice production in Europe in 2012 (data from FAO, 2012)
In addition to being the most important staple food in the world, rice is also part of many cultures and traditions, being used in several religious ceremonies and festivals (Maclean et al., 2002). In 2004 the United Nations declared it the International Year of Rice, as a "symbol of cultural identity and unity among peoples".
B) A)
3 1.2 Rice growing habitats and grain types
Rice, as a very diverse plant, can grow in a wide range of environments where other crops would fail. Currently, rice-growing environments throughout the world (Figure 1.2.1) include irrigated rice, rain-fed lowland and rain-fed upland (IRRIa, 2013), as follows:
Irrigated rice is grown in fields with 5–10 centimeters (cm) of water (“floodwater”) in the field, receiving about 40 % of the water from irrigation. This anaerobic environment is the most common method used worldwide, having about 80 million ha of this cultivation providing 75 % of the world’s rice production;
Rainfed lowland rice is grown in bunded fields that are flooded with rainwater for at least part of the cropping season. This can originate multiple abiotic stresses and high uncertainty in timing duration, and intensity of rainfall. About 60 million ha of rainfed lowlands supply about 20 % of the world’s rice production. This technique predominates in areas of greatest poverty: parts of Southeast Asia, South Asia, and essentially all of Africa. Thus, yields are very low (1–2.5 t/ha) which leads to poverty of these families;
Upland rice is grown under dry land conditions in mixed farming systems without irrigation and without puddling. These aerobic environments are highly variable in terms of moisture and soil fertility and sometimes there are problems of nutrient deficiencies, in particular of Fe-deficiency. Although this method constitutes around 13 % of the total rice area worldwide, it is the predominant rice-growing method Latin America and West Africa, where poverty is widespread.
4
Figure 1.2.1 Distribution map of irrigated rice, rainfed lowland rice and rainfed upland rice in different world regions (from IRRIa, 2009).
Rice belongs to the family Gramineae, that includes other cereals such as wheat, corn or barley (IRRIb, 2009), and to the genus Oryza, which includes 21 wild species and 2 cultivated species, Oryza glaberrina Steur and O. sativa L. (Ge et al., 1999). While O. glaberrina is cultivated in restricted areas of western Africa, O. sativa is cultivated all over the world (Londo et al., 2006).
Oryza sativa L. was the first fully sequenced crop genome, and besides having the smallest genome (430 Mb across 12 chromosomes), it is easy to genetically modify and it is a model organism used for research in cereals and other monocotyledonous plants (Ohnishi et al., 2011). In 1928, the pioneering work of Kato et al. showed the existence of two main variety types, designated as indica and japonica. In ecogeographical terms, the first one is produced in Southern Asia, while the second is typically found in upland areas of Southeast Asia, temperate East Asia, and high elevations in South Asia (IRRIb, 2013). However, more recent studies to interpret the evolutionary relationships between groups revealed a total of five distinct groups known, corresponding to aus, aromatic, indica, tropical japonica, and temperate japonica, where group differences were explained through contrasting demographic histories (Garris et al., 2005). It is estimated that about 120,000 rice cultivars
5
exist in the world (Khush, 1997). This ecological diversity is result of natural and human selection, diverse seasons, climates and soils, and varied cultural practices (Maclean et al., 2002).
Rice has physical characteristics that distinguish one variety from others. It can be of short, medium or long grain size. Its pericarp can also vary in terms of color, including brown, red, purple and black (FAO, 2004). Three different types of rice are produced, namely white rice, which has long grain without the hull and bran; brown rice, which retains most of the cuticle that covers the grain, having a certain brown tone, and a fiber content higher than that of other varieties; and the steamed rice, which has the same nutritional value and a golden color similar to the "integral" rice (Decree-Law nr. 62/2000).
In Europe, the most cultivated variety is japonica, with a medium round grain. In Portugal the main types produced are japonica (or Carolino) and indica (Agulha) (Pacheco Dias and Nunes da Rocha, 2012; ANIA, 2006), and the Decree-Law number 62/2000 establishes the classification of varieties, the methods of analysis, types of commercial class, and rules of their marketing, packaging and labeling. The indica variety, with long grain, despite being preferred in the Nordic countries constitutes 80 % of world rice.
1.3 Nutritional characteristics of rice
Rice feeds more than half of the world’s population, most of whom in developing countries, predominating in 17 countries in Asia and the Pacific, nine countries in South and North America and eight countries in Africa (FAO, 2004) where this food is, at least during certain seasons, their sole source of nutrients (Sautter et al., 2007). Unpolished rice is rich in nutrients, fibers, vitamins and minerals (Maclean et al., 2002) that supply the majority of daily dietary nutrients for billions of people (FAO, 2004). Rice also contains all of the amino acids essential for humans except lysine (Maclean et al., 2002). It is a source of complex carbohydrates, and provides 21 % of global human per capita energy and 15 % per capita protein (Maclean et al., 2002), while wheat supplies 19 % and maize 5 % of energy (FAO, 2004).
6
Table 1.3.1 summarizes the nutritional composition of brown (unpolished) rice when compared to white (polished) rice.
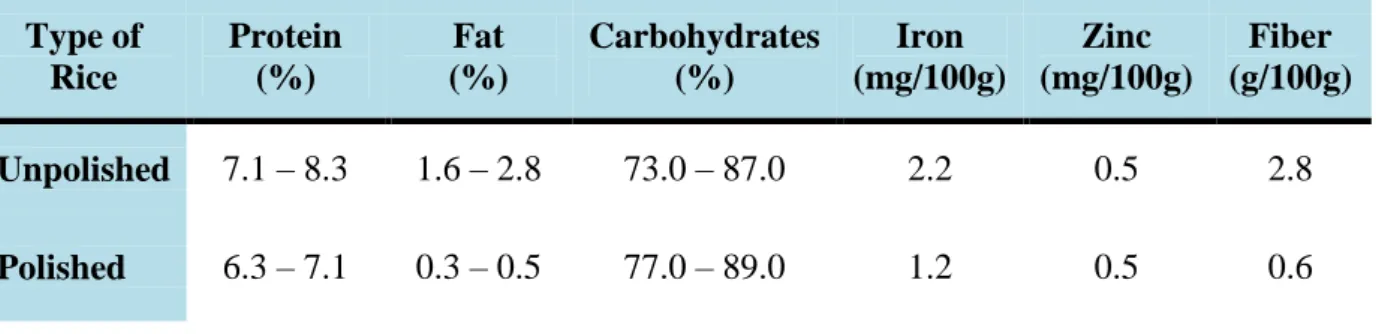
Table 1.3.1 Nutrient composition of rice grain types (adapted from FAO, 2004; Agricultural Engineering Unit and IRRI, 2013).
Most rice is consumed in its polished form and in this process some important nutrients such as iron (Fe), zinc (Zn) and Vitamin A are lost. White rice alone is not enough to provide the nutrient needed in each meal, being very important to compensate these shortages of nutrients by consuming other vegetables, fish and meat, to prevent nutritional deficiencies and other problems (Maclean et al., 2002).
The major portion of minerals in the rice seeds are likely supplied through continuous uptake and translocation during reproductive growth to developing seeds (Hocking and Pate, 1977; Sperotto et al., 2012a). Environmental factors (soil fertility, wet or dry season, solar radiation, temperature during grain development) and crop management (added N fertilizer, plant spacing) can affect rice nutrient content. When rice grows in calcareous soils with low amount of available Fe, nutrient content is also lower in rice seeds (Grusak and Dellapenna, 1999). Previous studies show that when rice is grown in solutions with different Fe concentrations, this is reflected in the content of minerals in the rice seeds (Sperotto et al., 2012a). Type of Rice Protein (%) Fat (%) Carbohydrates (%) Iron (mg/100g) Zinc (mg/100g) Fiber (g/100g) Unpolished 7.1 – 8.3 1.6 – 2.8 73.0 – 87.0 2.2 0.5 2.8 Polished 6.3 – 7.1 0.3 – 0.5 77.0 – 89.0 1.2 0.5 0.6
7 1.4 Iron deficiency, a global problem
Human metabolism requires various nutrients to function properly, and all of them can be supplied by an appropriate diet (Welch and Graham, 2004; White and Broadley, 2009). This diet should not only supply the energy nutrients but also the essential amino acids, particularly the uncommon S-rich amino acids, lysine, methionine, vitamins A, C, D and E, B vitamins, folic acid and ionic elements such as iodine (I), Fe, Zn and sodium (Na) (Sautter et al., 2007).
When physiological requirements cannot be met through the absorption of nutrients in the diet, mineral malnutrition can occur (Zimmermann and Hurrell, 2007). Mineral malnutrition is considered to be the most serious global challenge to humankind (White and Broadley, 2009). Nearly two-thirds of all deaths of children are associated with nutritional deficiencies, many from micronutrients deficiencies (Caballero, 2002; Walker and Waters, 2011), which increases the risk of death from common diseases such as acute gastroenteritis, pneumonia and measles (Caballero, 2002).
Fe deficiency is one of the most widespread dietary challenges in human health (Lee et al. 2009b), affecting about 30% of the world population. It is the only nutrient deficiency which is also significantly prevalent in industrialized countries (WHO, 2013).
Dietary Fe is usually divided into two types (Theil, 2004): heme Fe, found almost exclusively in meat, and non-heme Fe, found in animal and plant tissues as Fe2+ bound to insoluble proteins, phytates, oxalates, phosphates and carbonates, which are inhibitors of Fe absorption (Reddy et al., 1992). The first one is 2-6 times more available for absorption from the diet than non-heme Fe (SACN, 2010). In human metabolism, Fe plays important roles, namely in the synthesis of heme found in hemoglobin, which distributes oxygen around the body and in myoglobin, which stores oxygen in muscles and tissue. It also serves as a transport medium for electrons within cells (FAO and WHO, 2001).
According to the World Health Organization (WHO), anemia is considered the main consequence of Fe deficiency (WHO, 2013). It can affect anyone at any part of the world, however, it is more prevalent in developing countries as South Asia and Africa, where young children and pregnant women are the most affected (WHO, 2005). Anemia is associated with clinical symptoms such as weakness, decreased respiratory capacity and dizziness. In areas with limited resources, this is frequently exacerbated by infectious diseases, because of a
8
depressed immune function. Even in the absence of anemia, Fe deficiency can cause neuro-cognitive disorders.
Mineral malnutrition can be addressed through dietary diversification, increasing mineral concentrations in edible crops, Fe supplements, food fortification and/or biofortification (Zhao and Shewry, 2011). However, dietary diversification and Fe supplements by tablets are not easily available in developing countries (Gillespie and Haddad, 2001) and in spite of food fortification being considered the best long-term strategy for prevention, Fe compounds of relatively high Fe availability, such as ferrous sulfate, often originate unacceptable color and flavor changes, whereas those compounds which are organoleptically inert, such as elemental Fe, are usually poorly absorbed (Hurrell, 1992).
For various reasons, none of these intervention strategies has been very successful in reducing the prevalence of Fe deficiency anemia in developing countries. Nutritional health and well-being of humans are entirely dependent on plant foods. Plant foods contain almost all of the mineral and organic nutrients established as essential for human nutrition, as well as organic phytochemicals that have been linked to the promotion of good health (Grusak and Dellapenna, 1999). Because the concentrations of many of these constituents are often low in edible plant sources, studies have been done to understand the physiological, biochemical and molecular mechanisms that contribute to their synthesis, transport and accumulation in plants (Grusak and Dellapenna, 1999). Thus, to improve the nutrition and health of rice consumers, development of high-quality rice varieties seems to be an alternative approach which is more sustainable (Duan and Sun, 2005).
The use of plant breeding and/or transgenic approaches to develop new cultivars with the potential to increase the nutrient concentration of edible portions of crop plants is named biofortification (White and Broadley, 2005). Currently, two of the various techniques that are being used in rice to improve the nutritional status of populations are the following:
use of traditional plant breeding techniques to select rice varieties with superior nutrients content and breed these with the most commonly grown varieties to enhance the nutrient content of the grains (FAO, 2004);
develop more nutritional rice using genetic modification techniques. The best-known example of this technology is “Golden Rice”. This variety was incorporated with beta-carotenoids, precursors of vitamin A, whose deficiency causes irreversible blindness.
9
This rice is being tested in nutrition trials before it can be approved by national authorities (Barry, 2013).
However, before increasing the mineral content of plants, it is necessary to understand not only how minerals are obtained from the rhizosphere, but also how the minerals are then distributed throughout the plant (Krämer et al., 2007). There is a lack of knowledge about how minerals are moved into or out of vascular tissues, translocated to vegetative tissues and accumulated in seeds, the edible portion of the rice plant (Colangelo and Guerinot, 2006). Fe translocation and Fe homeostasis in rice has already begun to be understood at the molecular level (Masuda et al., 2012), but the mechanisms behind these processes still need deep research in order to be clearly comprehended.
1.5 Iron deficiency in plants
Similar to humans, Fe is essential for plant growth and plays important roles in general plant metabolism (Clark, 1983). Since Fe accepts and donates electrons it serves as a cofactor of several proteins that are involved in a number of physiological processes in plants, such as respiration, chlorophyll biosynthesis and photosynthetic electron transport, hormone biosynthesis, production and scavenging of reactive oxygen species and pathogen defense (Jeong and Guerinot, 2009).
Plants must maintain Fe homeostasis, and to achieve this they developed complex mechanisms to regulate the acquisition, storage and distribution of Fe to the specific compartments (Puig et al., 2007; Walker and Connolly, 2008), providing the necessary amounts of this micronutrient and preventing internal cation excess (Zimmermann and Hurrell, 2007). Fe deficiency is a major problem for plants that grow in aerobic soils at neutral or alkaline pH (calcareous soils), which cover approximately 30% of world land. Under these conditions, Fe forms insoluble complexes and despite its abundance in the soil, it is not readily bioavailable for uptake (Jeong and Guerinot, 2009). Fe deficiency is a widespread agricultural problem and one of the main symptoms is chlorosis, usually called “Fe deficiency chlorosis” (IDC) (Curie and Briat, 2003) IDC is associated with decreased photosynthetic rate and inhibition of chlorophyll biosynthesis (Belkhodia et al., 1998), and if
10
severe, it can lead to reduction of plant growth and crop yield or even complete crop failure (Guerinot and Yi, 1994).
Fe stress alters chloroplast ultrastructure (Spiller and Terry, 1980), protein and lipid composition of thylakoid membranes (Nishio et al., 1985), reduces electron transport capacity (Spiller and Terry, 1980), diminishes noncyclic ATP formation (Terry, 1980) and leaf ATP levels (Arulanantham, 1990). Morphological and physiological characteristics of roots are also modified under Fe deficiency in dicotyledonous and monocotyledonous (non-graminaceous) plants. Fe deficiency is associated with inhibition of root elongation, increased diameter of the root apical zone and abundant root hair formation (Romheld and Marschner, 1981; Chaney et al., 1992).
Another major class of plant pigments are the anthocyanins, a group in the diverse flavonoid family, responsible for the red-blue coloration of berries, red grapes, purple maize and vegetables, and are found in the cell vacuole of flowers, fruits, leaves, stems, and roots (Harbone, 1993; Escribano-Bailón et al., 2004). Anthocyanins serve multiple eco-physiological functions, and it has been shown that their accumulation in leaves can be induced by diverse environmental and anthropogenic stressors, such as high light, UV-exposure, chilling, pathogen infection, wounding, osmotic stress, pollution, and nutrient deficiencies, such as N and P, however, correlation with Fe deficiency has not yet been reported (Neill, 1994; Hodges and Nozzolillo, 1995).
To cope with Fe deficiency, plants developed sophisticated and tightly regulated mechanisms to mobilize Fe in the rhizosphere and take it up across the plasma membrane of root cells (Puig et al., 2007). These acquisition strategies are based on two distinct mechanisms, namely, Strategy I and II which are depicted in Figure 1.4.1 (Grotz and Guerinot, 2006; for reviews please see Palmer and Guerinot (2009) and Gross et al., (2003)).
11
Figure 1.4.1 Strategies for Fe uptake from the soil. (A) Strategy I; (B) Strategy II (adapted from Sperotto et al., 2012b; Walker and Connolly, 2008).
The Strategy I response (Figure 1.4.1A) is used by all dicotyledonous species such as Arabidopsis, and by non-graminaceous monocotyledonous species (Mukherjee et al., 2006; Jeong and Connolly, 2009), and involves the release of protons into the rhizosphere to acidify the soil and increase Fe3+ solubility (Fox and Guerinot, 1998). Ferric iron (Fe3+) is subsequently reduced to ferrous iron (Fe2+) in the plasma membrane of root epidermal cells, by a ferric reductase-oxidase (FRO) (Robinson, 1999) and the Fe2+ is moved across the plasma membrane into root cells by IRT, an Fe-regulated transporter member of the large ZIP family (Vert et al., 2002). The Fe3+-chelate reductases genes, FROs ( Wu et al., 2005; Mukherjee et al., 2006), and the Fe2+ transporters, IRT1 and IRT2 (Vert et al., 2001), have been isolated and characterized in Arabidopsis. The FRO2 gene encodes an enzyme thought to pass electrons across the plasma membrane to reduce ferric Fe chelates using two intramembrane heme groups (Yi and Guerinot, 1996) and is expressed primarily in the outer layers of roots in response to deficiency (Grusak et al., 1990). IRT1 is the main Fe-regulated transporter that is induced in response to Fe-deficient conditions and is also capable of transporting Zn, Mn, Co and Cd (Vert et al., 2002).
The Strategy II response (Figure 1.4.1B) is used by the monocotyledonous species (grasses, graminaceous), such as rice, wheat, corn and barley, in which phytosiderophores (PS), that have a high affinity for Fe3+, are released into the rhizosphere by OsTOM1/OsZIFL4 (Nozoye et al., 2011). The Fe3+-PS complex is taken up into root cells by transmembrane proteins of the yellow-stripe like (YSL) family, such as OsYSL15 (Ishimaru et al., 2006; Inoue et al., 2009). PS are synthesized from methionine and belong to the mugineic acid family (MAs) (Nozoye et al., 2011). Nicotianamine (NA) and
2′-12
deoxymugineic acid (DMA, product resultant from NA conversion), compounds obtained by the subsequent action of nicotianamine synthase (NAS) and deoxymugineic acid synthase (DMAS), are biosynthesis precursors of PS which chelate with metals, such as Fe, to transport them through the plant (Mori et al., 1991; Inoue et al., 2003).
Different gramineae species produce different types and amounts of PS (Bashir et al., 2006). The quantity of PS released into the soil is correlated with the ability of the plant to tolerate Fe deficiency (Bashir and Nishizawa, 2006). Unlike barley and rye, rice secretes PS in relatively smaller amounts in response to Fe deficiency and is, thus, susceptible to low Fe availability, especially in the earlier stages of rice development (Marschner and Hohenheim, 1990; Bashir et al., 2006).
Although responses to Fe deficiency in graminaceous plants, such as increased secretion and production of MAs have been described, the mechanisms of gene regulation related to these responses are largely unknown (Ogo et al., 2007). Recently, Ogo et al. (2006) isolated and identified in rice a basic helix-loop-helix (bHLH) transcription factor, OsIRO2, involved in the response to Fe deficiency in graminaceous plants. OsIRO2 was demonstrated to be strongly expressed in roots and shoots under Fe-deficiency and to be involved in the regulation of several genes responsible for DMA biosynthesis, including OsNAS1, OsNAS2, OsDMAS1 and OsNAAT1, as well as OsYSL15 (Ogo et al., 2007).
OsIRO2 is positively regulated by IDEF1. IDEF1 is a transcription factor that also plays a crucial role in regulating other Fe-deficiency-induced genes involved in Fe homeostasis, such as OsTOM1, OsYSL15, OsYSL2, OsIRT1, OsNAS1 and OsNAS2 (Kobayashi et al., 2009). Kobayashi et al. (2012) suggested that OsIDEF1 is essential to sense the cellular Fe status in rice, especially at early stages, but not necessarily at subsequent stages.
Until recently, Strategy II plants were thought to only use the above-described response to obtain Fe from the soil (Ishimaru et al., 2006). However, an ortholog of the major root Fe transporter in Arabidopsis, IRT1, has already been identified in rice, and unlike other grasses, rice seems to have an efficient Fe2+ uptake mechanism (Ishimaru et al., 2006; Cheng et al., 2007). In accordance to that, a loss-of-function mutation in OsNAAT1 results in less DMA secretion and decreased growth in media with Fe3+. However, this mutant is still able to grow
13
under waterlogged conditions or when Fe2+ is provided (Cheng et al., 2007), which supports the hypothesis that rice has combined features of both strategies.
On the other hand, previous studies suggested that rice does not have the ability to reduce Fe3+ (Ishimaru et al., 2006), a limiting-step of Strategy I plants (Grusak et al., 1990). Moreover, attempts to produce rice with the ability to create more Fe available for absorption in conditions of Fe deficiency by introducing the gene AtFRO2 in rice failed (Vasconcelos et al., 2004). However, the evidences of Fe2+ uptake in rice, suggests that it could benefit from an increased activity of the ferric chelate reductase to generate more available Fe when the plants are grown in upland conditions (aerobic soils), where Fe is often less available and insufficient to sustain proper development of the plant (Vasconcelos et al., 2004).
1.6 New candidate genes
After uptake from the soil, Fe is transported into the roots and is loaded in the xylem. Citrate seems to be the major Fe chelator in the xylem (Abadía et al., 2002). AtFRD3 is a plasma membrane transporter that mediates citrate efflux into the root xylem, a process important for Fe translocation to shoots (Durrett et al., 2007). However, relatively little is known about how metals such as Fe are effluxed from cells, an indispensable step for transport from the root to the shoot (Durrett et al., 2007). Ferroportin (FPN) is the sole Fe efflux protein identified to date in mammals, functioning in both Fe absorption in the intestine and Fe recycling in macrophages (Muckenthaler et al., 2008). Recently, two closely related orthologs were identified in Arabidopsis: IRON REGULATED1 (IREG1/FPN1) and IREG2/FPN2 (Morrissey et al., 2009).
Morrissey et al. (2009) showed that FPN2 is localized in the vacuole and is expressed in the two outermost layers of the root in response to Fe deficiency, transporting Fe and Co into the vacuole. No orthologs for FPN have been described in rice. Evidence of direct Fe transport is still lacking, and while FPN1 could be a good candidate to mediate Fe efflux to the xylem, FPN2 seems to have a role in buffering metal influx (Morrissey et al., 2009).
Other candidate genes for Fe homeostasis in rice belong to the MYB transcription factor family. Previously, it was shown that the expression of two MYB genes was upregulated by
14
Fe deficiency (Colangelo and Guerinot, 2004), suggesting that MYB genes perhaps also play a role in Fe metabolism. In plants, MYB transcription factors play a key role in plant development, hormone signal transduction, secondary metabolism, abiotic stress tolerance and disease resistance (Stracke et al., 2001).
This family of genes was identified in a number of monocotyledonous and dicotyledonous plants (Yanhui et al., 2006). In Dendrobium hybrid Woo Leng, one of the most popular cut orchids in Southeast Asia, was described a MYB gene, DwMYB2, related with Fe deficiency (Chen et al., 2006). Moreover, the expression of DwMYB2 in Arabidopsis promoted Fe uptake and impaired the Fe transportation from roots to shoots. This gene was never identified in rice.
OsMYBS3 is another transcription factor belonging to the MYB transcription factors family described to be regulated by sugars, where its expression is increased in the absence of sugars (Lu et al., 2002). OsMYBS3 is the homologous of MxMYB1, isolated in one apple species in genus Malus, which is induced under Fe deficient conditions in Arabidopsis (Shen et al., 2008). There are no studies to show whether OsMYBS3 plays a role in Fe homeostasis in rice plant or not.
15 2. OBJECTIVES
2.1 General objectives
There has been some controversy about the mechanisms used by rice plant for Fe uptake from the rhizosphere. The aim of this study was to understand if in fact rice plants have or not the capacity to up-regulate Strategy I mechanisms for Fe uptake, and if its capacity is dependent on the rice cultivar. Thus, two different rice cultivars, namely Nipponbare (cv. japonica) and Bico Branco (cv. tropical japonica) were studied at the physiological and molecular level when grown hydroponically under Fe deficiency (0 μM Fe(III)EDDHA) and Fe sufficiency (20 μM Fe(III)EDDHA).
2.2 Specific objectives
Nipponbare and Bico Branco cultivars were selected and grown for three weeks under Fe sufficiency and Fe deficiency conditions in order to,
- analyze the effect of Fe concentration in the growth medium on the accumulation of Fe and other micro micronutrients in different tissues (roots and shoots);
- understand the impact of Fe deficiency on photosynthetic pigment accumulation in rice shoots;
- understand if rice plants induce the Fe reductase enzyme in roots (a typical mechanism of Strategy I plants);
- analyze the expression of previously described mineral-related genes involved in Strategy I and II of Fe uptake, in different tissues (roots and shoots) and understand if their expression is cultivar dependent;
- identify new candidate genes that may be important in regulating Fe uptake in plants.
16 3. MATERIALS AND METHODS
3.1 Cultivars selection
Two major parameters were considered for cultivar selection: germination rate and Fe concentration. Table 3.1.1 shows the seven ecotypes of Oryza sativa L. and respective cultivars used in the present work.
Table 3.1.1 Oryza sativa L. ecotypes, cultivar names and country of origin
Ecotype Cultivar Names Country of Origin
Tropical Japonica
Carolina Gold United States
Peh-Pi-Nuo China
Bico Branco Brazil
Temperate Japonica
Shinchiku-iku 103 Taiwan
Aichi Asahi Aichi Asahi
Preto Regado 142 Morocco
Aromatic
Dom-Zard Iran
Lambayque 1 Peru
Mana Muri Nepal
Japonica
Eh-ia-Chiu Taiwan
Nipponbare Japan
Kalo Moni Bangladesh
Aus
Sada Solay Pakistan
Hasawi Saudi Arabia
Dhali Khama Bangladesh
Indica
Wie Malasya
Pin Kaeo Thailand
Padi Oro Indonesia
Admix-Aus-Indica
Sareina India
Tak Siah Pakistan
17 3.1.1 Germination rate
For determination of the germination rate, between nine and ten seeds of each variety were germinated in germination bags. The seeds were maintained at room temperature under natural light (~20 ºC, 8 h light), and watered every three days. At seven and 14 days, the germination rate was calculated using the following equation:
3.1.2 Seed mineral analysis
For seed Fe concentration analysis, 200 mg of each variety, ca. ten seeds, were manually peeled and digested with five mL of 65 % HNO3 in five steps: 1-130 °C/10 min; 2-160 °C/15 min; 3-170 °C/12 min; 4-100 °C/7 min; and 5-100 °C/3 min in Teflon reaction vessels and heated in a SpeedwaveTM MWS-3+ (Berghof, Germany) microwave system.
After digestion, the resulting clear solutions were diluted to 20 mL with ultrapure water. Mineral concentrations were measured using inductively coupled plasma atomic emission spectrometry (Optima 7000 DV ICP-OES, PerkinElmer) (Massachusetts, USA). The element was quantified using the axial alternate method.
3.2 Plant growth
Rice (Oryza sativa L.) seeds of two cultivars, cv. Bico Branco (tropical japonica) and cv. Nipponbare (japonica), were germinated on filter paper moistened with deionized water, wrapped in silver paper and incubated in a greenhouse at 25 ºC in the dark. They were watered with CaCl2 250 mM every three days. After three weeks of germination, ten seeds of each variety were transferred to a nutrient solution. The composition of the nutrient solution was 3 mM KNO3, 1 mM Ca(NO3)2, 0.5 mM KH2PO4, 0.75 mM K2SO4, 0.5 mM MgSO4, 25
18
mM CaCl2, 25 mM H3BO3, 2 mM MnSO4, 2 mM ZnSO4, 0.5 mM CuSO4, 0.5 mM H2MoO4, 0.1 mM NiSO4 and 0.1 mM K2SiO3. All nutrients were buffered with 1 mM MES, pH 5.5.
Five rice plants were transferred to an Fe-free nutrient solution (Fe deficiency) and another five plants were transferred to a nutrient solution containing 20 μM Fe(III)-EDDHA (Fe sufficiency) as control, for more three weeks. The hydroponic experiments were carried out in an environmental growth chamber (Aralab Fitoclima 10000EHF), with relative humidity of 75 % and with a photoperiod of 16 h day (with photosynthetic active radiation of 490 μmol m-2
s-1 and temperature of 24–26 °C) and 8h night (with temperatures of 19 – 20 °C). Growth solutions were changed weekly.
3.3. Photosynthetic pigment extraction
Anthocyanin, chlorophyll and carotenoid concentrations were measured in plants grown in Fe deficient and Fe sufficient conditions, as described previously. The referred compounds were extracted and quantified according to a modified protocol of Sims et al. (2002). Briefly, 0.1 g of shoot samples were grinded with a mortar and pestle using liquid nitrogen. Photosynthetic pigments were extracted with 0.4 mL of a cold acetone/Tris buffer solution (80:20 vol:vol, pH = 7.8). After homogenization, samples were incubated at 4 ºC for 1h. The supernatants were transferred to a new tube and diluted fivefold with additional acetone/Tris buffer to measure absorbance at 470, 537, 647 and 663 nm with a spectrophotometer (Implen, Isaza, Portugal).
The amount of anthocyanins, chlorophyll a and b and carotenoids were determined through the following equations (3.3.1):
(3.3.1) (3.3.1)
19 3.4. Root Fe-reductase activity assay
Root capacity to reduce Fe(III)-EDTA in Bico Branco and Nipponbare cultivars, was analyzed according to Vasconcelos et al. (2006), via the spectrophotometric measurement of Fe2+ chelated to BPDS (bathophenanthroline disulfonic acid). Roots of each single intact (Fe sufficient or Fe deficient) rice plant were submerged in an assay solution containing: 1.5 mM KNO3, 1 mM Ca(NO3)2, 3.75 mM NH4H2PO4, 0.25 mM MgSO4, 25 µM CaCl2, 25 µM H3BO3, 2 µM MnSO4, 2 µM ZnSO4, 0.5 µM CuSO4, 0.5 µM H2MoO4, 0.1 µM NiSO4, 100 µM Fe(III)-EDTA and 100 µM BPDS. The solution was buffered with 1 mM MES, pH 5.5. The assays were conducted in the dark at room temperature and were terminated after 45 minutes by removal of the roots. The absorbances were obtained spectrophotometrically (Implen, Isaza, Portugal) at 535 nm, and an aliquot of the solution that had no roots during the assay was used as blank. The amount of Fe3+ reduced was calculated using the molar extinction coefficient of 22.14 mM-1 cm-1.
The contribution of root-released soluble reductants to overall root Fe reduction was determined by conducting additional assays with plants grown in the same conditions described before. Roots were placed for 45 min in buffered nutrient solution with no Fe source or BPDS. An aliquot of the solution from each root system was added to a solution containing 100 µM Fe(III)-EDTA and 100 µM BPDS and left for 30 min; absorbance was then read at 535 nm as described above.
3.5 Total RNA extraction
Rice shoots and roots of Bico Branco and Nipponbare cultivars were collected after three weeks growing under Fe sufficient and Fe deficient conditions and immediately frozen in liquid nitrogen. A pool of three plants from each treatment were grinded thoroughly with a mortar and pestle until a fine powder was obtained and stored at – 80 ºC for RNA extraction. Total RNA was extracted using a Qiagen RNeasy Plant Mini Kit (USA, Nr. #74904), according to the manufacturer's instructions with some modifications, and treated with RNase-free DNase I to remove contaminating genomic DNA.
20
Briefly, about 50 mg of shoots and 100 mg of roots were weighed, and placed in an eppendorf tube containing 750 μL and 450 μL of RLC and RLT extraction buffer, respectively, with 1 % of β-mercaptoethanol. Samples were vigorously vortexed and, while shoots samples were incubated at room temperature for six min, root samples were incubated for three min at 56 ºC. The lysates were transferred to a QIAshredder spin column placed in a two mL collection tube, and centrifuged for five min at full speed. Then, the supernatants were carefully transferred to a new microcentrifuge tube to which was added 0.5 volume of 100 % ethanol to the cleared lysate, mixed immediately by pipetting and transferred to an RNeasy spin column placed in a two mL collection tube and centrifuged for 15 seconds at 10,000 rpm. After discarding the flow through, 700 μL of RW1 buffer was added to the RNeasy spin column of each sample and centrifuged for 15 seconds at 10,000 rpm. The column was washed with 500 μl Buffer RPE twice in shoots samples and three times in roots samples, centrifuging for 15 seconds at 10,000 rpm between each addition and discarding the flow-through. Lastly, each spin column was transferred to another sterile tube and 30 μl of RNase-free water was added and centrifuged for one min at 10,000 rpm to elute the RNA. The previous step was repeated, passing the eluate through the membrane again and submitting the tubes to a new centrifugation to ensure maximal yield. RNA quality and quantity were checked by UV-spectrophotometry, using a nanophotometer (Implen, Isaza, Portugal). Samples were stored at – 80 ºC for further analyses.
3.6. cDNA Synthesis
Single-stranded cDNA was synthesized from extracted RNA using the First Strand cDNA Synthesis Kit (Fermentas UAB, Cat. Nr. #K1612), according to manufacturer’s instructions. Briefly, about 1000 ng of RNA was added one µL of Random Hexamer Primer and nuclease-free water to a final volume of 11 µL. To this mixture four µL of 5x Reaction Buffer, one µL of RiboLock RNase Inhibitor (20 u/ µL), two µL of ten mM dNTP Mix and M-MuLV Reverse Transcriptase (20 u/µL) were added. This mixture was incubated in a Thermal cycler (VWR, Doppio, Belgium) for five min at 25 °C followed by 60 min at 37 °C. The reaction was terminated by heating at 70 °C for five min.
21
cDNA quantity and quality were checked by UV-spectrophotometry, using a nanophotometer (Implen, Isaza, Portugal). cDNA samples were stored for further analyses.
3.7 Gene expression analysis
Accession numbers of genes identified in Fe nutrition in rice plants were chosen using NCBI databases. Accession orthologs to AtTOM1, AtFPN1/IREG1, AtFPN2/IREG2 and DwMYB2 were identified using the TBLASTN tool against the GenBank databases with search specifications for Oryza sativa [Organism]. The new sequences in rice were named Oryza sativa TOM1 (OsTOM1), OsFPN1 and OsMYB2. Only sequences that showed an e-value < 6e-14 were considered significant (Annexes, Table 3.7.1).
Primer sequences were designed for 11 genes, using Primer-BLAST software (Ye et al., 2012) with the following criteria: primer size between 18 and 20 base pairs and primer annealing temperatures between 57 °C and 60 °C. Accession numbers and the respective sequences are presented in Table 3.7.2 (Annexes). The primers used were hydrated according manufacturer’s instructions.
cDNA, extracted from roots and shoots of Bico Branco and Nipponbare cultivar growing under Fe sufficient and Fe deficient conditions, was amplified by qRT-PCR in a Chromo4 Thermocycler (Bio-Rad, CA, USA).
Amplifications were carried out using 100 ng of cDNA, 1.25 μL of each primer, 1.5 L of molecular biology grade water and mixed to 12.5 μL of 2×PCR iQ SYBR Green Supermix (Bio-Rad) in a final volume of 25 μl. Three technical replicates were performed for each gene tested in qPCR reactions, as well as for controls. Thermal cycling conditions were: initial 2 min denaturation at 50 ºC and then 10 min at 95 ºC, followed by 39 cycles of 15 s at 95 ºC and 1 min at 57 ºC, and a final dissociation step of 1 min at 72 ºC.
Melting curve from 50.0 ºC to 65 ºC was read every 1 ºC holding 1 s. Then, melt curves profiles were analyzed for each gene tested. The comparative CT method (ΔΔCT) (Livak and Schmittgen et al., 2001) for the relative quantification of gene expression was used for assessing the normalized expression value using the 18S rRNA as the housekeeping gene and for normalization of expression of each gene (Opticon Monitor 3 Software, Bio-Rad). Data
22
were transferred to Excel files and plotted as histograms of normalized fold expression of target genes.
3.8 Elemental analysis
To determine mineral concentrations, Bico Branco and Nipponbare cultivars were grown under Fe deficient and Fe sufficient conditions for three weeks. Roots and shoots were separately harvested, washed to exclude the contamination of Fe from the hydroponic solution and then dried at 65 ºC. Samples were reduced to a fine powder digested and analyzed with ICP-OES, as described in section 3.1.2
3.9 Statistical analysis
Data processing and statistical analysis of ICP-OES data, root Fe reductase activity assay, anthocyanins, chlorophyll a and b, total chlorophylls and carotenoids analyses were performed using Microsoft Excel and GraphPad Software. Differences between treatments were tested with an unpaired t-test.
23 4.RESULTS AND DISCUSSION
One important gap in the understanding of Fe allocation to the rice grain is the knowledge about how Fe is acquired from the environment (Sperotto et al, 2012). When plants are grown in aerobic conditions, where Fe is not available, they induce a set of mechanisms that function at the root–soil interface to solubilize Fe and subsequently transfer it across the plasma membrane of root cells (Palmer and Guerinot, 2009).
Dicotyledonous plants use Strategy I for Fe uptake from the soil under Fe deficiency, and Strategy II was described to be used by all grasses (Romheld, 1987). However, even though rice (Oryza sativa L.) is a Strategy II plant, reports suggest that it could have the ability to use both strategies for Fe uptake. Ishimaru et al. (2006) showed that rice has an efficient Fe2+ uptake system, since its genome encodes two proteins - OsIRT1 and OsIRT2 - which are higly similar to the Strategy I transporter IRT1. This could be an adaptation of rice plants to flooded/anaerobic soils, where low redox conditions occur and Fe3+ is reduced to Fe2+, being the latter directly transported through OsIRT1 (Ishimaru et al., 2006). On the other hand, in upland rice, where aerobic conditions prevail, Fe3+ is present in greater quantity than in anaerobic soils. Since rice is, of all grasses, the one which produces lower amounts of PS (Mori, 1991), one could hypothesize that the utilization of Strategy I mechanisms would represent an environmental advantage to compensate for the lack of available Fe in aerobic conditions.
In strategy I plants, it is known that Fe deficiency induces an increase in root Fe3+- reductase activity (Kochian and Lucas, 1991), but Strategy II plants were described to not possess this reduction capacity. Ishimaru et al. (2006) measured the Fe3+-chelate reductase activity in the surface of rice roots under Fe deficient conditions and showed that rice has very low Fe3+ reductase activity. They also found increased chlorosis of the fully expanded youngest rice leaves showing, like others, that Fe deficiency inhibits the biosynthesis of chlorophyll (Belkhodia et al. 1998).
Besides altering chlorophyll synthesis, mineral deficiencies were described to increase the production of anthocyanins pigments, that are thought to protect plants from this type of stress conditions (Neill, 1994; Hodges and Nozzolillo, 1995; Gould, 2004). However, there are no studies available to demonstrate the relationship between this pigment in rice and Fe deficiency stress.
24 0 20 40 60 80 100 120 C ar o lin a Go ld P eh -Pi -Nu o B ico B ran co Sh in ch ik u -i k u 1 0 3 A ich i A sah i P reto R eg ad o 1 4 2 Do m -Z ar d L am b ay q u e 1 Ma n a Mu ri Eh -ia -C h iu Nip p o n b ar e Kalo Mo n i Sad a So lay Hasaw i Dh ali Kh am a W ie P in Kae o P ad i Or o Sar ein a T ak Siah B h ad o ia 6 8 5 Tropical Japonica Temperate Japonica
Aromatic Japonica Aus Indica Admix-Aus-Indica Ge rmina ti on R ate (% ) 7 days 14 days To sum up, due to the major enigma surrounding the Fe uptake mechanisms utilized by rice, in this report, a focus on physiological and molecular parameters was taken to elucidate the question behind rice strategies alternation. Oryza sativa L. cv. Nipponbare and cv. Bico Branco were grown under Fe deficient and Fe sufficient conditions to evaluate mineral concentration, photosynthetic pigment accumulation, Fe-reductase activity and expression of Fe metabolism related genes.
4.1 Rice cultivar selection
Given the high degree of variability in molecular and physiological responses between cultivars, an initial screening stage was conducted in order to select two cultivars with contrasting responses to Fe deficiency. The criteria for selection were a high germination capacity, as well as a good nutritional Fe status of the seeds, and an optimum growth in hydroponic conditions. Moreover, we were interested in selecting two cultivars with different ecotypes, as growth habitats may influence the plants response to Fe deficiency.
The germination rates of 21 rice cultivars were evaluated at seven and 14 days, as shows Figure 4.1.1
Figure 4.1.1 Germination rate of 21 rice (Oryza sativa L.) cultivars at seven and 14 days after germination.
25 0 5 10 15 20 25 30 C ar o lin a Go ld P eh -Pi -Nu o B ico B ran co Sh in ch ik u -i k u 1 0 3 A ich i A sah i P reto R eg ad o 1 4 2 Do m -Z ar d L am b ay q u e 1 Ma n a Mu ri Eh -ia -C h iu Nip p o n b ar e Kalo Mo n i Sad a So lay Hasaw i Dh ali Kh am a W ie P in Kae o P ad i Or o Sar ein a T ak Siah B h ad o ia 6 8 5
Tropical J. Temperate J. Aromatic Japonica Aus Indica Admix-Aus-Indica F e C onc entra ti on ( μg / g DW )
In general, Bico Branco, Dom-Zard, Lambayque 1, Mana Muri, Nipponbare, Padi Oro, Hasawi and Tak Siah had the highest germination rate, ranging from 89 to 100 %. Cultivars of temperate japonica ecotype revealed the lowest germination rates, with values reaching only 10 % for Aichi Asahi and for Preto Regado 142, and no germination of Shinchiku-iku 103 (Figure 4.1.1).
Another criterium utilized was the seed Fe concentration. This enabled us to understand the nutritional variability of our cultivars, and to select the varieties to use in the subsequent analyses.
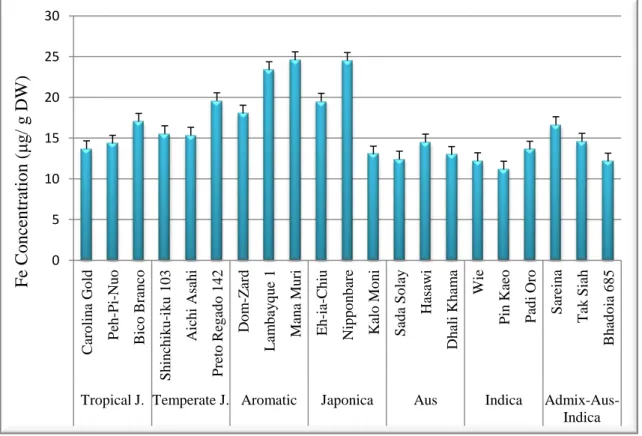
Figure 4.1.2 shows that, in general, Mana Muri seeds had the highest concentration of Fe, followed by Nipponbare and Lambayque 1. The cultivars with lowest Fe concentrations were Pin Kaeo, an indica-type, and Bhadoia 685, an admix-aus-indica-type.
Figure 4.1.2 Concentration (μg/g dry weight (DW)) of Fe in seeds of 21 rice (Oryza sativa L.) cultivars. Data are mean±standard error. An average of three technical replicates were analyzed.
26
The values obtained ranged from 11 μg/g DW to 24 μg/g DW in seeds, from Pin Kaeo to Mana Muri, respectively. In other studies, Fe concentration in rice grains had the lowest levels when compared to other cereals, ranging from 6 to 22 μg/g compared to 10 to 160 μg/g in maize and 15 to 360 μg/g in wheat (Gómez-Galera et al., 2010). Gregorio et al. (2000) evaluated the genetic variability of Fe concentration in other rice varieties and, among the 1,138 samples analyzed, the Fe concentration in brown rice ranged from 6.3 to 24.4 ppm. The highest grain-Fe concentrations (ranging from about 18 to 22 μg/g) were found in several aromatic rice varieties, such as Zuchem, Jalmagna and Xua Bue Nuo.
Excluding Padi Oro and Tak Siah, the cultivars with highest germination rates also had higher seed Fe concentrations. Therefore, experimentally, the seven cultivars with highest germination rates were grown under Fe deficient and Fe sufficient hydroponic conditions to evaluate their growth capacity in Fe limiting conditions. In this work we aimed at understanding the physiological molecular response to Fe deficiency in two rice cultivars with different growth habitats and ecotypes. As Bico Branco and Nipponbare were the cultivars that grew better and also had good nutritional value and high germination rates these were the ones selected for further studies.
4.2 Physiological responses to Fe deficiency
When plants are under mineral stress conditions, they develop a range of mechanisms to cope with these fluctuations, such as storage and remobilization of mineral nutrients and changes in morphology and physiology (Marschner, 1995). In aerobic conditions, Fe is highly unavailable for plant uptake, and its deficiency can be severe in plants grown in calcareous soils (Jeong and Guerinot, 2009).
Here, the photosynthetic pigment accumulation in shoots, as well as micronutrients concentration in rice tissues and root Fe-reductase activity of two different rice plants grown hydroponically under Fe deficient and Fe sufficient conditions will be analyzed.
27 4.2.1 Photosynthetic pigment accumulation
As referred in the Introduction section, IDC is one of the earliest symptoms observed in the leaves of plants growing in soils with low Fe availability (Abadía et al., 1999). In rice, Sperotto et al. (2007) visualized the first symptoms of chlorosis after 11–13 days of Fe deficient treatment, which was well established after 18 days, with significant decreases in chlorophyll concentration.
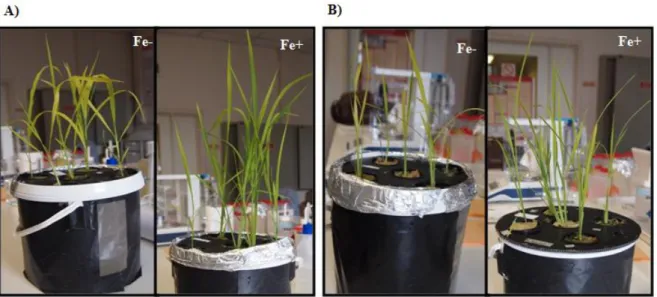
Figure 4.2.1.1 shows the growth differences between shoots of plants after three weeks under Fe deficient and Fe sufficient conditions, where shoots of Fe deficient plants showed more yellowing than under Fe sufficient ones. Abbott (1967) previously described an evident difference in the size of shoots between treatments that was also observed in this study.
Figure 4.2.1.1 Fe deficiency chlorosis in shoots of (A) Bico Branco and (B) Nipponbare cultivars after three weeks under Fe deficiency (Fe-) (0 μM Fe(III)-EDDHA) (left panels) and Fe sufficiency (Fe+) (20 μM Fe(III)-EDDHA) (right panels) hydroponic conditions.
IDC has been usually attributed to inhibition of chlorophyll synthesis, since Fe plays a role in the biosynthesis of this photosynthetic pigment and its precursors in leaves (Pushnika et al., 1984). Thus, under Fe deficiency, the loss of chlorophylls as well as carotenoids, are the primary responses associated with the unavailability of this element (Belkhodia et al., 1998; Hendry and Price, 1993). On the contrary, anthocyanins, which are natural pigments belonging to the flavonoid family and are responsible for the red-blue coloration (Pascual-Teresa and Sanchez-Ballesta, 2008), are known to accumulate in leaves with nutrient