The transformation of Lanxess:
a successful response to a
changing industry
Nelli Stoyanova
152117310
Dissertation written under the supervision of
Gonçalo Saraiva
Dissertation submitted in partial fulfilment of requirements for the International
MSc in Management, at the Universidade Católica Portuguesa,
ABSTRACT
Dissertation Title: The transformation of Lanxess: a successful response to a changing industry
Author: Nelli Stoyanova
Keywords: Business transformation, turnaround strategy, strategic plan, industry challenges, overcapacity, joint venture
In today's globalized world, companies are constantly exposed to changes in their environment. These changes can be highly diverse and serious. Changes in certain factors can affect the attractiveness of an industry and have an impact on the profitability of companies. Factors such as new competitors, capacity expansions, and a decline in demand can provoke overcapacity, leading to an unattractive industry. Overcapacity is a problem that frequently occurs in mature and capital -intensive industries, such as the chemical one. This typically results in increased competition and thus to reduced profitability for companies in the industry. Players who want to survive need to act against the declining profitability and transform to competitive companies. Literature and practice have shown that a joint venture can significantly improve the competitive position of companies and thus allow them to become profitable again. In order to combine literature and practice, the real-life example Lanxess was used to illustrate the emergence of overcapacity, its consequences and how to deal with them. Lanxess has achieved a successful transformation. A joint venture that helped Lanxess to integrate itself backwards and provide it with competitive prices for its raw materials, has been the main contributor to its success. As a result, Lanxess has successfully positioned itself and experienced an upturn in profitability.
SUMÁRIO
Título da dissertação: A transformação da Lanxess: uma resposta bem-sucedida a uma indústria em mudança
Autor: Nelli Stoyanova
Palavras-chave: Transformação de negócios, estratégia de recuperação, plano estratégico, desafios da indústria, excesso de capacidade, joint venture
No mundo globalizado de hoje, as empresas estão constantemente expostas a mudanças no ambiente em que estão inseridas. Essas mudanças podem ser bastante diversas e críticas. Mudanças em determinados fatores podem afetar a atratividade de uma indústria e ter impacto na lucratividade das empresas. Fatores como novos competidores, expansões de capacidade e declínio na procura podem provocar um excesso de capacidade, o que pode formar uma indústria pouco atraente. O excesso de capacidade é um problema que frequentemente ocorre em indústrias desenvolvidas e indústrias de capital intensivo, como a indústria química. Isto normalmente leva ao aumento da concorrência e, portanto, à redução da lucratividade das empresas do setor. Aqueles que querem sobreviver precisam de agir contra a diminuição da lucratividade e transformar-se em empresas competitivas. A literatura e a prática mostraram que uma joint venture pode melhorar significativamente a posição competitiva das empresas e, deste modo, permitir que elas voltem a ter lucro.
Para associar a literatura existente e a prática, o exemplo real da Lanxess foi usado com o objetivo de demonstrar o surgimento do excesso de capacidade, as suas consequências e como lidar com as mesmas. A Lanxess conseguiu uma transformação bem-sucedida. Uma joint venture que ajudou a Lanxess a integrar-se ao contrário e a oferecer preços competitivos para as suas matérias-primas, foi o principal factor para o seu sucesso. Por este motivo, a Lanxess posicionou-se bem no mercado e experienciou um aumento na sua lucratividade.
ACKNOWLEDGEMENTS
In the first, place I would like to express my gratitude to my dissertation advisor Gonçalo Saraiva. At all time I could rely on him and receive valuable feedback. He was able to satisfy all my expectations regarding support and knowledge transfer at any time. He enabled me to write a thesis according to my ideas and at the same time, he put me back on the right path, if I lost the thread.
I would also like to thank my family. Without them, I would not have had the opportunity to enjoy this special education. I am convinced that this foundation will help me on my further way.
Finally, I would like to thank my friends for their unique support during my studies and especially during my thesis.
TABLE OF CONTENTS
ABSTRACT ... II SUMÁRIO ... III ACKNOWLEDGEMENTS ... IV TABLE OF CONTENTS ... V TABLE OF FIGURES ... VI GLOSSARY ... VII CHAPTER 1: INTRODUCTION ... 1CHAPTER 2: LITERATURE REVIEW ... 3
2.1INDUSTRY ATTRACTIVENESS ... 3
2.2OVERCAPACITY ... 6
CHAPTER 3: CASE STUDY ... 12
3.1LANXESS BACKGROUND AND HISTORY FROM 2005-2012 ... 12
3.2DEVELOPMENT OF THE WORLD SYNTHETIC RUBBER INDUSTRY UNTIL 2013 ... 13
3.3WORLD SYNTHETIC RUBBER INDUSTRY IN 2013 AND 2014 ... 16
3.4STEPS TAKEN BY LANXESS 2014-2017 ... 17
3.5WOULD THE PLAN WORK? ... 19
3.6EXHIBITS CASE ... 21
ENDNOTES ... 27
CHAPTER 4: TEACHING NOTES ... 30
4.1SYNOPSIS ... 30
4.2TARGET AUDIENCE ... 30
4.3LEARNING OBJECTIVES ... 30
4.4ROADMAP FOR DISCUSSION ... 31
4.5DISCUSSION QUESTIONS ... 32
4.6WRAP UP ... 38
CHAPTER 5: MAIN CONCLUSION AND FUTURE RESEARCH ... 39
MAIN CONCLUSION ... 39
FUTURE RESEARCH ... 39
TABLE OF FIGURES
Figure 1: Porter's five forces ... 3 Figure 2: GE and McKinsey matrix ... 4 Figure 3: Finding the right path ... 11
GLOSSARY
GE General Electrics
EBITDA Earnings before interest, taxes, depreciation and amortization JVs
M&As
Joint Ventures
Mergers and Acquisitions SR
ICIS CIS USA
Synthetic Rubber
International Chemical Information System Commonwealth of Independent States United States of America
EU EUR
European Union Euro
CHAPTER 1: Introduction
In an increasingly globalized world, companies have to observe changes in their industry and the environment continuously. Changes can include the sudden occurrence of new competitors, new technologies or price changes. These can lead to shifts in the supply and procurement side and ultimately to structural changes in the industry. Such developments can intensify competition on a sustained basis. Companies that want to stay in the market have to react quickly in order to keep up with their competitors and remain profitable. This can include strategic measures that lead to a better positioning of vis-à-vis competitors.
Scholars and companies have examined how certain alterations of factors can influence the attractiveness of industries. The frameworks of Porter’s five forces and the General Electrics and McKinsey matrix (Hax & Majluf, 1983), have been particularly investigating this topic. Porter (2008) argues that a raise in capacity results in increased competition and thus reduces profitability, leading to the industry’s deterioration of attractiveness. Gulati et al (2000) and Kogut (1988), identified that a joint venture can be seen as a strategic behaviour. An improved positioning can be associated with a joint venture in a highly competitive industry and improve the company's profitability.
The problem this thesis strives to understand is how companies can act when they face an increase in the capacity of an industry. In order to find a solution, the following research questions will be answered:
1. How can industry attractiveness be assessed and what are the key influencing factors? 2. Why does overcapacity reduce the attractiveness of industries?
3. What measures can be taken to counter the negative consequences of overcapacity? A real-life example will be used in order to demonstrate how a company that faced overcapacity in the industry managed to successfully transform itself. Lanxess suffered a decline in profitability due to overcapacity and imposed a three-stage program as a result. Whereas the first stage included measures to create a more efficient organizational structure, the second one dealt with the optimization of processes and plant closures. Particular focus will be given to the joint venture in the third stage, which ensured the success in strengthening its competitive position and returning to profitability.
This work is structured in four parts. The first part covers the literature review, where industry attractiveness frameworks and threats to industry profitability are presented. Secondly, overcapacity, its consequences, and options to deal with it are discussed. The second part of the thesis comprises the teaching case, in which the successful transformation of Lanxess is presented. The third part includes the teaching notes, which serves as a guideline for the instructor to discuss the case in class. The fourth part provides the main conclusion of this thesis and depicts considerations for future research.
CHAPTER 2: Literature Review
The literature review presents several academic topics in order to provide a theoretical basis for the case study. It discusses the two major topics: industry attractiveness and overcapacity.
2.1 Industry attractiveness
Industry attractiveness frameworks
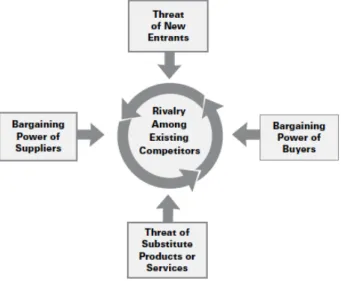
Scholars have developed frameworks to analyse the attractiveness of industries. The most known one was developed by Michael E. Porter: Porter’s five forces. The five forces that shape industry competition and profitability are shown in figure 1 (Porter, 2008).
Figure 1: Porter's five forces Source: Porter, 2008
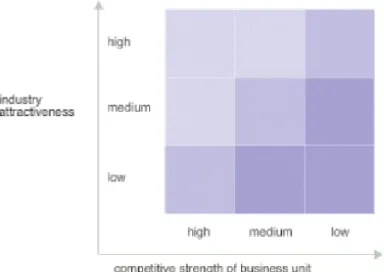
Whereas the industry attractiveness - business strength matrix of General Electric (GE) and McKinsey (Figure 2) assesses the industry attractiveness by 14 external factors (Hax & Majluf, 1983).
Figure 2: GE and McKinsey matrix Source: McKinsey&Company, 2008
These external factors cannot be controlled by the firms. These include market size, market growth rate, cyclically, competitive structure, barriers to entry, industry profitability, technology, inflation, regulation, manpower availability, social issues, environmental issues, political issues, and legal issues (Hax & Majluf, 1983). Several factors such as barriers to entry, industry profitability and competitive structure do overlap with considerations of Porter. Compared to Porter, the GE and McKinsey matrix divides the factors into two groups (Hax & Majluf, 1983). One group includes factors that affect companies and competitors in the industry equally, such as industry profitability or market growth rate. The second group includes factors that affect all participants differently, such as demographic factors or currency parity (Hax & Majluf, 1983). Furthermore, in contrast to Porter, it is determined how much the factors will contribute to the attractiveness of the industry by grading them according to a five-point scale (Hax & Majluf, 1983). Finally, the factors are categorized according to the three levels high, medium and low.
However, in the study of Wernerfelt and Montgomery (1986), the conventional business portfolio planning techniques are criticised. While these techniques consider industry attractiveness as a universal dimension, the two scholars are determining the attractiveness on the basis of relative advantages. They suggest that the cost position of the individual firms affects the industry’s profitability. Andrews (1971, as cited in Wernerfelt and Montgomery, 1986) admits, that the success of these business portfolio planning tools is due to its simplicity. However, he argues against Porter and the GE and McKinsey matrix and proposes that the attractiveness of an industry depends on the nature of a company's resources.
Dyer and Singh (1998) introduced a whole new concept analysing the firm’s competitive advantage and profitability. It is no longer only the individual company that is considered in the analysis as e.g. Porter does, but the connections in which this company stands. The profitability and competitive advantage are based on the firm’s alliances. This can be achieved, among other things, through complementary resource endowments. The importance of strategic network as part of the competition and profitability is also emphasized by Gulati, Nohria, and Zaheer (2000). This is an important complement and extent to the existing frameworks of Porter and GE and McKinsey. The following threats to profitability are derived from these frameworks.
Threats to industry profitability
According to Porter (2008), the threat of entry represents a danger to profitability. The capacity in the industry raises by increasing the number of players which seek for market share. Another reason for an increased industry capacity is derived by the buyer’s backwards diversification in the supply chain, if the profitability of the sellers it too high (Porter, 2008). Consequentially, prices, costs, and the required amount of investment to compete in the industry are under pressure. Prevailing capabilities and cash flows can be used to disturb competition especially by new players which are diversifying from other markets (Porter, 2008). This force can limit the profit potential. Particularly when it’s high, existing players must keep prices down and push investments in order to frighten new entrants. Current players are likely to drop prices as they have to defend their market share at any price. Porter emphasises, that it is not the entrance that matters, but the threat, that lowers profitability. Gulati et al. (2000) consider the threat of entry as a danger to profitability as well. Although they regard network ties as entry barriers in the industry. Structural network characteristics such as network density have an influence on profitability. Connections to low-cost suppliers can hinder or limit other firms to access those and therefore allow them to receive higher returns. Hence, the profitability in an industry can also be affected by the prevailing networks (Gulati et al., 2000).
The extent to which rivalry limits the profitability depends on the intensity and basis of the competition (Porter, 2008). The degree of intensity, among others, is high when the number of competitors is high or when they are similar in size and power. The need for large capacity expansions due to high rivalry, upsets the balance between supply and demand in the industry and often results in long and recurring periods of overcapacity and price cuts. However, rivalry is typically getting more intense when time passes and as industries mature the growth slows down (Porter, 2008).
2.2 Overcapacity
Frameworks to assess industry attractiveness have shown that overcapacity threatens the profitability. In this sense, overcapacity has the right to be analysed more closely. This section discusses the implications of overcapacity. Building on this, options are discussed on how to deal with the negative consequences of overcapacity, with particular emphasis on joint ventures.
Implications of overcapacity
In the scope of this work, overcapacity is also referred to as excess capacity. Overcapacity and poor returns are often results of companies that tend to plan their capacity expansions poorly by investing at the same time as their competitors (Henderson & Cool, 2003). Industry-wide optimism that develops due to tight industry capacity utilization and good cash flows, is often the main reason for investments in new capacity (Achi et al., 1996 as cited in Henderson & Cool, 2003). Considerable sales potential can arise from investments in plants. However, if too many companies are investing at the same time, this would result in overcapacity (Henderson & Cool, 2003).
Henderson and Cool (2003), Bower (2011) and Schuler et al. (2014) agree that overcapacity is common in older capital-intensive industries such as automotive, steel, and petrochemical. The overcapacity and low margins in the steel industry resulted from “a combination of overinvestment, a slowdown in fixed asset investment, the global economic crisis, and changes in the raw-materials pricing schemes” (Schuler et al., p.2, 2014). A typical situation where overcapacities are present is when the environment is competitive. In particular, two processes play a role here (Porter, 1980). There are a number of existing companies that have the resources and strength to add capacity in order to maintain market power. In the second process, new players add capacity that strive for a good market position (Porter, 1980).
The negative consequence of excess capacity is that firms that suffer from it tend to lower the price in order to sell more of its capacity and to attract new businesses (Kim, Shi, & Srinivasan, 2004; Grant, p.73, 2016). The competitors that are afraid of being undersold tend to charge a lower price as well. As a result, these industries are subject to intense price competition in times of low demand (Kim et al., 2004). This typically happens in commodity industries and is the reason for dramatic drops in profitability (Grant, p.73, 2016). Porter (2008) agrees that overcapacity can considerably intensify the competition, cut prices and therefore considerably
affect the profitability. This has been the case in the steel industry where overcapacity had a considerable influence on profitability and EBITDA (Schuler et al., 2014). It was shown that there is a clear inverse relationship between overcapacity and profitability. Moreover, overcapacity negates the targeted added value of companies (Henderson & Cool, 2003), it leads to long-term value destruction (Schuler et al., 2014) and most often endures for a long time (Porter, 1980). The next section examines options to deal with overcapacity, focusing on the relative merits of joint ventures (JVs).
Characteristics of joint venture
Practice and literature have shown that JVs can be used in order to improve competitive positioning and thus return to profitability. In this context, scholars have made an effort in investigating how JVs can be used to improve the competitiveness of firms and receive a competitive advantage (Tong & Reuer, 2010). As already mentioned, firms that are operating in industries that show overcapacity often suffer from increased competition and decreased profitability. In this situation firms face the pressure of consolidation (Porter, 2008) and a joint venture may relieve this pressure.
JV is a type of strategic alliance, such as licensing agreements, distribution and supply agreements, research and development partnerships, and technical exchanges (Inkpen & Currall, 2004). The activities covered by strategic alliances are very diverse, including buyer-supplier partnerships or shared manufacturing agreements (Grant & Baden-Fuller, 2004). Equity JVs pools the resources of more than one company to create a new organizational unit. This unit is considered as the child that is different from its parents (Inkpen & Currall, 2004), manages assets together and achieves strategic objectives (Yin & Shanley, 2008). Further, it can be distinguished between horizontal and vertical JVs, whereas vertical ones are bringing together companies operating in different but vertically related sectors (Oxley, Sampson, & Silverman, 2009). However, there is little harmony among scholars on the types of alliances, which is reflected in the wide range of typologies proposed in research on alliances and JVs (Yin & Shanley, 2008).
Reasons to engage in a joint venture
As overcapacity poses pressure on competition and profitability, companies face the need to act in the right way (Sanders et al., 2015). Restructuring is a process of strategic choice and is driven by maximizing value, transforming a weak company or increasing the value of a strong business (Hurry, 1993). Besides Mergers and Acquisitions (M&As), part of this process can be the involvement of partners in new alliances. As global competitiveness changes over time, the
patterns in restructuring may change as well. The history of automotive restructuring reveals that alliances became more and more popular vis-à-vis to M&As. JVs and vertical integration in order to access raw material, became the centre of attention (Hurry, 1993). Since alliances have been established in practice, it has been of great interest to scientists to investigate how they can improve the profitability of companies (Oxley et al., 2009).
One of the first scholars were Porter and Fuller, which posited that the benefits of alliances include learning, access to specialised resources, risk sharing, and the design of the competition (Porter & Fuller, 1986 as cited in Oxley et al., 2009). As already mentioned, according to Dyer and Singh (1998) alliances can be the source of competitive advantage and profitability. Especially, the complementary resource endowments allow to earn abnormal profits.
In the literature, the strategic point of view is strongly mentioned with regard to alliances. That is, JVs have a strategic significance for companies and provide access, among other things, to resources (Gulati et al., 2000). For instance, a strong relational tie to suppliers can clearly contribute to profitability as shown in the Japanese automotive industry (Cusumano, 1985 as cited in Gulati et al., 2000). Another example is container shipping companies which could benefit from the added value through synergies created by alliances, e.g. in joint procurement (Sanders et al., 2015).
Kogut (1988) presents strategic behaviour as one of the three approaches that explain the motivation for JV and why it is chosen over alternatives such as acquisitions, supply contract, licensing, or spot market purchase. Strategic behaviour means that companies will act in a way that maximizes their profits by improving their competitive position vis-à-vis competitors. JVs might be more costly but more profitable compared to other alternatives. Kogut (1988) explains that, potentially, any model of imperfect competition that explains vertical integration is applicable to JVs since it deprives competitors of raw materials. JV partners are selected to improve the competitive position, that happens either through collusion or by hindering other competitors to find a strong partner (Kogut, 1988).
Another way of investigating JVs is to examine the industry closely, especially in terms of market power and efficiency (Kogut, 1988; Fusfeld, 1958; Hagedoorn, 1993). It was found that strategic behaviour improves both market power and efficiency. The efficiency improvements yield from the cost reduction that results from a better competitive position. The improvements in market power aim to create monopoly rents (Schwartz, 1987). With respect to vertical alliances, the efficiency benefits are due to the deepened specialisation, learning by doing and reduction of information asymmetry in the non-horizontal chain (Reuer & Koza, 2000; Dyer & Singh, 1998).
Moreover, scholars have tried to explain the motivation for JVs by increased profitability for the parents (Kogut, 1988). McConnell and Nantell (1985) came to the conclusion that JVs were conducted to improve efficiency as they identified in their study that the parents' stock returns had improved. More specifically, the stock return of the smaller partner was greater whereas the average cash gain was equally distributed.
However, Tong and Reuer (2010) found in their studies that non-horizontal JVs improve industry competition and reduce industry profitability, which is in align with Duncan (1982). This effect is stronger for international industries than for domestic and for concentrated ones. Moreover, Tong and Reuer (2010) emphasises that an increased firm performance does not necessarily result from an increased firm competitiveness. It may be that such companies that are engaged in a joint venture have weakened competition in the industry. Gulati et al. (2000) also considers negative sides from another point of view. Strategic networks such as JVs can tie companies to unproductive relationships or rule out the partnership with other viable companies. Thus, JVs can represent not only opportunities but also constraints.
Conclusively, strategic behaviour serves an informative framework for investigating how JVs influence the competitive positioning of a firm (Kogut, 1988). However, negative effects may also be associated with a JV.
Relative merits of joint venture
M&As are often used as a mean to reduce capacity and duplication in industries that suffer from overcapacity (Bower, 2011; Schuler et al., 2014). However, reducing overcapacity by closing inefficient facilities through M&As only works if real synergies are created, which makes the new company more efficient and profitable (Schuler et al., 2014). Porter (2008) agrees that M&As are not always the best decision. He emphasises that the strategy of eliminating competitors and stop intense competition can be risky. Porter’s five forces teach that the decline in profits due to the removal of current rivals frequently attracts new players and causes setbacks from customers and suppliers. New players could in return increase the capacity in the industry again.
The decision whether to engage in a M&A or alliance is complex and the context of the firms plays a major role (Yin & Shanley, 2008). M&As typically have ownership control of all the assets which is missing in alliances. This implies that M&As are preferred where uniform ownership and control rights allow more extensive use of common organisational resources than otherwise possible (Yin & Shanley, 2008). This exploitation is at the expense of higher investments. Alliances generally do not allow such intensive use of shared assets as M&As, but they are easier to leave when needed and they benefit from lower costs of sharing power.
Hennart (1991), agrees by saying that JVs represent a good alternative to full acquisitions or replication as it is less expensive. Moreover, Dyer suggests that under market uncertainty alliances are preferred as they limit their exposure compared to M&As (Dyer et al., 2004 as cited in Shanley & Yin, 2015). Hence, the risk sharing, the flexibility, and the lower costs are in favour of alliances compared to M&As.
Alliances are also preferred where continuous cooperation between partners is advantageous and where centralised control could compromise cooperation and destroy the value of a combination (Yin & Shanley, 2008). Yin and Sahnley also found that mature manufacturing industries, such as petrochemicals, characterized by high requirements for commitment, low requirements for flexibility, and high structural and institutional constraints might be in favour of JVs than any other type of alliance.
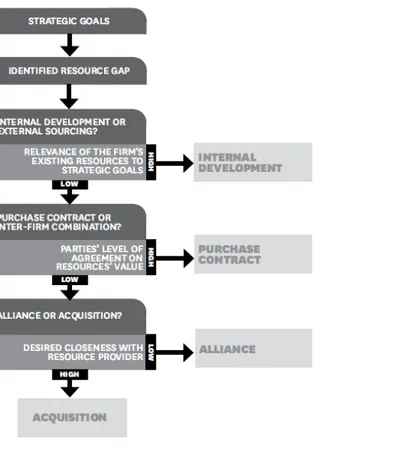
Capron and Mitchell (2010) developed a framework which takes those considerations into account, starting their analysis at an earlier stage. Thereby it is possible to find out the best way for growth through resource developing. The steps that need to be taken can be retrieved from figure 3. An alliance is preferred over an acquisition if the existing resources of the company are not relevant to the ones desired, it is not easy to agree with the provider on the value of the resource and to generate the wanted resources, does require the participation of only a few people and units (Capron & Mitchell, 2010).
However, the literature does not provide several concepts to assess whether a M&A or alliance is more appropriate. As already mentioned, the decision must always be made in the context of the companies.
Figure 3: Finding the right path Source: Capron & Mitchell, 2010
CHAPTER 3: Case Study
Matthias Zachert was appointed CEO of Lanxess AG on April 1, 2014.1 At that time Lanxess
faced a dramatic decline in profitability, especially in the rubber segment. Zachert had been forced to act.2 Therefore, he hired the consulting company EX to draw up a restructuring plan.
During 2014 and 2015, several steps of the three-stage restructuring plan had already been successfully implemented. The first phase focused on the competitiveness of the business and administrative structure resulted, among other things, in a simplified organizational structure and a smaller number of business units.3 The second phase focused on the operational
competitiveness and reduced production capacities, for example.4 However, the big step was
yet to come. On 15 September 2015, Zachert received a proposal to engage in a Joint Venture (JV) with Saudi Aramco from the transaction department of EX, besides all the other steps of the efficiency program. Saudi Aramco as the world's largest oil and energy company can thus offer access to the important raw material oil.5 Saudi Aramco set a time limit of 1 week for
Lanxess to decide whether they wanted to engage. Only 1 week! After 6 long days of careful deliberations, Zachert opted for a 50:50 JV with Saudi Aramco which was announced in Cologne, Germany, on 22 September 2015.6 After the announcement he sat in front of his
computer and read the global press release about the JV asking himself: Was this the right decision?
3.1 Lanxess background and history from 2005-2012
Zachert looked back to Lanxess, a speciality chemicals company based in Cologne (Germany), that emerged at the beginning of 2005 from a strategic realignment of the Bayer Group's chemicals and plastics businesses. In the same year, the shares of the companies were admitted to the Frankfurt Stock Exchange and to the MDAX and in 2012 to the DAX 30.7 Moreover,
Lanxess was included in the leading sustainability indices Dow Jones Sustainability Index (DJSI World and Europe) and FTSE4Good.8 The global petrochemical company distinguished
itself from its competitors by flexible asset structures, a diversified customer base, a global presence, and an entrepreneurial management structure.9
Lanxess elaborated its core business as the development, manufacturing and sale of plastics, rubber, specialty chemicals, and intermediates.10 Synthetic rubber is the name given to elastic
polymers produced on the basis of petrochemical raw materials. Synthetic rubber is the starting material for rubber production.11 Lanxess high-performance rubbers are used primarily in the
customers are companies from the automotive and tire industries, but also companies from the construction industry and the oil and gas industry.12 From the outset, Lanxess has applied its
specific core competencies of application know-how, chemical expertise, flexible asset management and close cooperation with its customers.13 In March 2009, Lanxess celebrated
100 years of synthetic rubber (SR) since its invention by the former Bayer Group employee Hofmann. With a portfolio of more than 100 types of synthetic rubber, Lanxess built on Hofmann's heritage to bring it into a successful future. In honour of his invention, Lanxess has decided to undertake a number of activities at its rubber sites around the world.14
Despite the financial crisis, Lanxess was named "Company of the Year" by ICIS (International Chemical Information System) in 2009 for its outstanding financial performance in 2008. On 1st in February 2010, the opening price of Lanxess stock was EUR 27.42. This was an increase
of 74% compared to the first price of EUR 15.75 in 2005. From the perspective of 2012, Lanxess continued its path of growth and achieved record sales and earnings in 2011. EBITDA increased by 25% to EUR 1,146 million. This was remarkable as EUR 1 billion was exceeded for the first time.15
Thanks to Lanxess's global production network and long-standing customer relationships, the company was particularly well positioned with its SR activities.16 It is of vast importance for
the SR industry to have a reliable, sufficient and secure supply and competitive prices in raw materials.17 The market for oil is the feedstock for petrochemical products. When it comes to
SR, the feedstock accounts for 75% of the total production costs in addition to energy.18
3.2 Development of the world synthetic rubber industry until 2013
In order to understand the causes of Lanxess’s problems, Zachert took a close look at the industry. He observed that although the chemical industry was highly mature, it was still a growing industry. It achieved growth rates worldwide, some of which were significantly higher than the general growth of the global economy. Nevertheless, it was increasingly challenging for European chemical companies, in particular, to profit from these fundamentally positive conditions in the medium term. This was due to far-reaching processes of change, some of which have taken place over decades in established market structures and mechanisms. These processes of change took place in the industry, such as substantial investments or changes in raw material prices.19 Change was not an unknown phenomenon in the chemical industry. Over
the last century, the industry has shown its ability and willingness to change. In this way, the chemical industry was able to play a decisive role in shaping technical and social progress or even make it possible.20 Zachert noted that changes have occurred mainly in the global rubber
market, especially on the supply and procurement side. However, the structural problems of the industry were in the market and not in the product itself.21
Investments in capacity
The commissioning of large new plants for SR has created overcapacities in the market. This has intensified the already existing price pressure worldwide.22 Since its foundation, Lanxess
has invested heavily in the production of SR to meet growing demand. The first step was the capacity expansion of the rubber additives facility in India in 2006. One year later the expansion of SR worldwide continued, in particular by expanding capacity of plants in Canada. As a result, the capacity for SR was increased by 42%. This was followed in 2008 by the purchase of Petroflex S.A., one of the world's largest manufacturers of SR (Exhibit 1). This complemented Lanxess's product portfolio and improved the company's position in one of the world's most important growth markets. In the following year, Lanxess strengthened its presence in Russia and CIS (Commonwealth of Independent States) markets. In these markets, Lanxess increasingly marketed high-performance rubber.23 Axel C. Heitmann (former Chairman of the
Board of Management) said, that the “commitment to Russia represents a major step in the long-term growth strategy of our company, especially in the BRIC countries, which already account for about 15 percent of Group sales”24. Since 2010, Lanxess has had a new production
facility in India, which supplied the global rubber market and the growing tire and rubber industry in India. Two acquisitions were made in the following year. With the acquisition of DSM Elastomers in the Netherlands and Darmex S.A. in Argentina, Lanxess further strengthened its position as the world's leading SR company. In 2012, Lanxess and the Taiwanese TSRC Corporation established a 50:50 JV in Greater China. The two companies were jointly investing USD 50 million in a new SR plant. One year later, a new production facility for SR in Singapore was completed. At EUR 400 million, this represented the largest single investment in its history in Singapore. Further, Lanxess opened its first production facility in Russia in the same year. Rubber for the markets in Russia and the CIS, especially for the automotive and tire industries, was produced there.25
Competitive raw material prices and continuous cost optimization
There were also changes in the industry with regard to the cost position of companies. Access to competitive raw material prices and continuous cost optimization became increasingly decisive. Producers from emerging markets, the Middle East and the USA were able to benefit from cost advantages in the price-sensitive SR business. Those countries often had better access to cheaper raw materials and energy.26 As a result, the European chemical industry and thus
also Lanxess suffered ever greater cost disadvantages. In addition to the already higher wage costs in the European Union (EU), the costs for raw materials and energy supply had risen disproportionately.27 This could not be compensated by higher efficiency and German
companies were particularly hit by this development.28 In 2013, German companies have paid
22% more for electricity costs than the average in the EU.29
Pressure on the European chemical industry
The European chemical industry also came under increasing pressure due to the continuous expansion of production capacities worldwide. Especially expanding competitors from Asia and China contributed to this development. In addition, producers from the USA and the Middle East also penetrated the world markets with low prices. This penetration even applied to higher-quality products. As a result, these countries switched from importers to exporters, which led to a decline in export opportunities for European companies in the global growth regions.30
New technologies and competitors
New technologies and competitors have also changed the market conditions lastingly. State-owned or at least supported suppliers from emerging markets penetrated established markets. In doing so, they often did not only pursue economic goals, which reduced the pressure to make a profit. These competitors were often former customers of Lanxess. Instead of buying from them, they now competed against Lanxess. Furthermore, the USA had increasingly better access to shale gas in the USA resulting in lower energy costs. Both developments increased import pressure on the European markets.31
The main growth market China
On the demand side, changes in the market have already been observed. It has become more and more clear that China would remain the main growth market in the future. Through 2030 it was expected that 40% of the worldwide demand for chemicals would come from China, but a significant part of this would be served from the domestic market. In the future, producers would not only have to set up individual plants but complete value chains in order to profit from this growth.32
Focus on innovation
Furthermore, the focus on innovation in the industry has increasingly shifted to another level. The concentration was no longer on molecules but on applications and processes. In the past, innovation was defined as new chemical compounds with improved or new properties. This
changed due to the enormous scientific progress and the high costs associated with registering new substances. Chemical companies had to focus on new areas of application for established products and try to make production processes safer and more efficient.33
Environmental awareness
After all, environmental awareness has increased more and more in recent years. Companies are forced to raise the standards for sustainable production to meet regulatory requirements. This can be remedied by consolidations. In particular as competitors in the growth markets are not able to raise the necessary investments for this.34
3.3 World synthetic rubber industry in 2013 and 2014
For Lanxess the year 2013 was challenging. It was characterized by a weak economic market environment, particularly in Europe. Volatile raw material prices and increasing competition, partly due to the new producers, had a negative impact on business development. Especially the synthetic rubber business suffered from those developments (Exhibit 2) with a continuing weakness of demand as already shown in 2012. In addition, the effects of a supply overhang triggered by higher production capacities became visible in the rubber business in 2013. The decline in sales is attributable to declining sales prices due to increasing competition, especially for rubber products. Furthermore, the price development followed the declining raw material prices. For 2014, the market situation for synthetic rubber was expected to remain challenging in view of the competitive and capacity situation. Even stronger price competition and more overcapacity could result from new producers or capacities. Risks could also arise here due to the dependence of the rubber business on the tire and automotive industries, which lead to volatility in sales.35 As expected, the year 2014 continued to be characterized by overcapacities
combined with price pressure, a cost structure with only limited competitiveness and high investment obligations. As a result, no further major investments were planned for the construction of new production facilities in the following years, as idling and start-up costs also had to be taken into account. It also had to be assumed that procurement costs for petrochemical raw materials, which are essential for the synthetic rubber products, would remain volatile.36
In order to better understand the situation in the rubber business, Zachert analysed it more closely. Structural changes in pricing developed because, in addition to new suppliers, established suppliers also expanded existing capacities in the rubber business, to which Lanxess itself made a significant contribution.37 By 2014, there was already production overcapacity of
around 20% in the rubber business.38 Increased supply flows of rubber from Asia and USA
increased price pressure as well. The success of investments in Asia was therefore severely influenced by the difficult competitive market conditions for SR.39 Moreover, the
underutilization of production facilities led to rising costs for unused capacity in Asia.40 So one
can say, growing capacities led to increasing price pressure, while at the same time the competitive position vis-à-vis American producers, who have a more favourable raw material and energy supply due to shale gas, deteriorated. These changes resulted in a significant decline in business. All regions were affected by sales declines. The most robust region was Asia/Pacific, which was able to outperform the other reporting regions with a low single-digit percentage decline.41
As Zachert analysed the year 2013, he observed only negative developments in terms of numbers. Lanxess suffered a significant 8.7% decline in sales, mainly due to lower prices, with all regions falling short of the prior-year level (Exhibit 3). Further, EBITDA pre exceptionals decreased by about 40% to EUR 735 million and the EBITDA margin pre exceptionals decreased to 8.9% (previously 13.4%). The changes in the competitive environment for the rubber business resulted in impairment charges of EUR 257 million. These write-downs resulted in a net loss of EUR 159 million. The performance of the Lanxess shares has also declined significantly (Exhibit 4).42
Revenues in 2014 continued to fall by 3.5%. EBITDA pre exceptionals, on the other hand, rose by almost 10% from EUR 735 million in the previous year to EUR 808 million in 2014. Moreover, the EBITDA margin pre exceptionals increased to 10.1%. However, earnings were negatively impacted by low selling prices due to the challenging competitive situation for synthetic rubbers, partly as a result of overcapacities. The performance of Lanxess stock continued to decline considerably as in the previous year. Further, rating agencies have downgraded creditworthiness, partly because of the recent weaker financial ratios as a result of the persistently difficult business environment in the rubber sector.43
3.4 Steps taken by Lanxess 2014-2017
After carefully and self-critically analysing the challenging year 2013 and the first quarters of 2014, Zachert knew he had to act. In response, Zachert and his team launched the three-stage efficiency program "Let's LANXESS again" in 2014 (Exhibit 5) with the objective to become more competitive and profitable.44
We have been working at full steam over the past few months to create the foundation for our realignment. We, as a team, will significantly improve our competitiveness by systematically implementing our program. We have started talks with the employee representatives on the implementation process, and we expect to quickly reach constructive solutions 45,
said Matthias Zachert, Chairman of the Board of Management of Lanxess AG. Phase I
Phase I focused on the competitiveness of the business and administrative structure. As part of the first step, the number of business units from 14 to 10 were consolidated effective January 1st, 2015. The reasons for this were intersections in the customer structure, regional overlaps in
the established markets, and additions in the emerging markets. It should also provide access to new customers and markets. The responsible employee representatives were involved in the process. Zachert has also streamlined the administration through global cross-functional headcount reductions and the consolidation of group functions. With a more efficient organizational structure, Lanxess did not only promote their proximity to the market and customers but also sustainably improve their cost position. Moreover, a reduction of around 1,000 of the 17,000 jobs worldwide was realized.46 Conclusively, the measures included a
simplified organizational structure, a smaller number of business units, the reduction of overlaps in customers and regional markets, staff reductions and the consolidation of administrative functions. These measures in the short-term served to finance the realignment.47
Phase II
Phase II was dedicated to the operational competitiveness with two excellence initiatives. In a "production optimization initiative", temporary or permanent plant shutdowns, as well as all production processes, were examined. Moreover, the goal was to implement best-practice approaches as comprehensively as possible. Another initiative was focusing on the optimization of sales and supply chain.48 In summary, Lanxess has adjusted its production capacity,
especially for the SR segment. Plants were closed, some permanently other temporarily. Facilities were sold, and operational processes were improved at the remaining sites. To align capacity with demand, sales, distribution and value chain functions were improved through automated order processing. This enabled management to have a better demand transparency and efficiency in the value chain.49 In the medium-term, these initiatives were expected to save
Phase III
Phase III concentrated on the competitiveness of the business portfolio. The focus was on improving access to raw materials and sales markets, also through strategic partnerships. One possible option was to secure the long-term supply of important raw materials through vertical cooperation with a company from the petrochemical industry and thus strengthen the cost position.51
On 22 September 2015, Zachert announced that Lanxess and Saudi Aramco would enter into a JV for synthetic rubber. The world's largest producer of synthetic rubber and the world's largest oil and energy group were thus entering into a strategic alliance. The joint venture was valued at EUR 2.75 billion. 52 Saudi Aramco has an unbeatable cost advantage by having access to the
world's largest and most accessible oil and gas reserves and the associated ownership of low-cost natural resources.53 Lanxess contributed its rubber business and Saudi Aramco provided
competitive and reliable access to strategic raw materials in the medium term. Zachert said “this alliance will enable us to give the rubber business a very strong competitive position and the best possible future perspectives” 54. Both companies each hold 50% of the EUR 2.75 billion
JV, which is consolidated at Lanxess. Saudi Aramco paid for its 50 percent stake, approximately EUR 1.2 billion, in cash. Zachert planned to use the proceeds for debt reduction, a share buyback program and growth investment.55 The rubber JV between Lanxess and Saudi Aramco
began operations on April 1st in 2016 under the name Arlanxeo after the relevant antitrust
authorities approved the transaction. The JV was created for the development, production, marketing and sale of SR.56
Zachert’s opinion was that Lanxess can only remain sustainable with synthetic rubber products if they were just as strongly positioned as their competitors. And most of them were backward integrated, i.e. they produce the necessary raw materials for the rubber themselves. Through the JV, Lanxess integrated itself backward for the first time. This finally remedied the weakness of limited access to important raw materials. In a material-intensive business such as rubber production, more favourable purchasing conditions mean noticeably lower manufacturing costs - and thus greater price competitiveness on the sales side.57
3.5 Would the plan work?
Zachert had deliberately chosen the joint venture. But typically, when it comes to investments, only time can tell whether they were worth it or not.
Phase I and II
In 2015, the rating agencies Standard & Poor's and Moody's have raised its outlook for Lanxess and commented positively on their measures.58 At the beginning of 2017, Zachert looked back
on the well-developed year 2016. He noted that phase I not only improved market and customer proximity, but also the cost position over the long term. Lanxess achieved annual savings of around EUR 150 million already in 2015 and was thus able to benefit from the savings earlier than expected. With regard to phase II, Lanxess has also made progress in optimising its production sites faster than planned. This was possible because some measures already could be completed in 2016 instead of 2017.59
Phase III
The JV with Saudi Aramco made it possible to initiate the growth phase at Lanxess already in 2016. EBITDA pre exceptionals were EUR 995 million, the third consecutive increase. Lanxess had previously forecast earnings of between EUR 880 million and EUR 930 million. In addition, for the year 2016 as a whole, the Lanxess share achieved a price gain of around 46%. Lanxess also increased dividend payments in 2016. The dividend increase of 17 % was a sign of the Group's increased profitability and financial soundness.60 In addition, as of 2016, the JV
contributed around 35% to Lanxess' sales (Exhibit 6). Since 2013 sales have stabilised and EBITDA margins have increased by more than 40% (Exhibit 7).61 As well profitability and
stability have improved in 2016 (Exhibit 8).62
The JV also proved successful in 2017. Arlanxeo successfully positioned its synthetic rubber business between positions 1-3 worldwide. In 2017, Lanxess achieved the best result in its corporate history. Lanxess was a reorganized global group that became profitable, stable and fast-growing. Moreover, Lanxess stock reached a new high on 9 June 2017 and passed the EUR 70 mark for the first time. Sales increased by 19,2% and EBITDA pre exceptionals increased by 3,2 % for Arlanxeo in 2017 compared to 2016 (Exhibit 9), despite the still challenging competitive situation for synthetic rubbers. Arlanxeo made a significant contribution to revenue growth, particularly in North America, Latin America, and Asia/Pacific. In any case, sales were higher than in the previous year for all regions. Moreover, the cash flow of Arlanxeo also developed extremely positively (Exhibit 10).63
3.6 Exhibits Case
Exhibit 1:
Successful Implementation of Lanxess Acquisitions from 2006-2013
Source: Lanxess AG. (2014). Annual Report 2013. Retrieved on November 7, 2018, from https://Lanxess.com/uploads/tx_Lanxessmatrix/lxs_gb13_final_e_web.pdf
Exhibit 2:
Position Lanxess’s Businesses
Source: Lanxess AG. (2015a). Annual Report 2014. Retrieved on November 10, 2018, from https://Lanxess.com/uploads/tx_Lanxessmatrix/lxs_gb2014_e_01.pdf
Exhibit 3:
Key Financial Data Lanxess 2012-2013
Source: Lanxess AG. (2014). Annual Report 2013. Retrieved on November 7, 2018, from https://Lanxess.com/uploads/tx_Lanxessmatrix/lxs_gb13_final_e_web.pdf
Exhibit 4:
Lanxess Stock Performance 2005-2015
Source: Lanxess AG. (2016a). Annual Report 2015. Retrieved on November 15, 2018, from https://Lanxess.com/uploads/tx_Lanxessmatrix/lxs_gb2015_e.pdf
Exhibit 5:
Three-stage efficiency program "Let's LANXESS again"
Source: Lanxess AG. (2017). Annual Report 2016. Retrieved on November 13, 2018, from https://Lanxess.com/fileadmin/user_upload/lxs_gb2016_e_Stand_1705.pdf
Exhibit 6: Sales by Segment
Source: Lanxess AG. (2018). Annual Report 2017. Retrieved on November 16, 2018, from https://Lanxess.com/fileadmin/user_upload/LXS_GB2017_E_web.pdf
Exhibit 7:
EBITDA margin 2011-2016
Source: Baeza et.al. (2017). LANXESS : FORGING STRATEGIC PARTNERSHIPS. Retrieved on September 22, 2018, from https://www.bcg.com/publications/2017/transformation-value-creation-strategy-Lanxess-forging-strategic-partnerships.aspx
Exhibit 8:
Profitability and Stability
Source: Lanxess AG. (2018). Annual Report 2017. Retrieved on November 16, 2018, from https://Lanxess.com/fileadmin/user_upload/LXS_GB2017_E_web.pdf
Exhibit 9:
Key data Arlanxeo
Source: Lanxess AG. (2018). Annual Report 2017. Retrieved on November 16, 2018, from https://Lanxess.com/fileadmin/user_upload/LXS_GB2017_E_web.pdf
Exhibit 10:
Cash Flow Arlanxeo
Source: Lanxess AG. (2018). Annual Report 2017. Retrieved on November 16, 2018, from https://Lanxess.com/fileadmin/user_upload/LXS_GB2017_E_web.pdf
Endnotes
1 Lanxess AG. (2014c). Matthias Zachert to become Chairman of the Board of Management of LANXESS AG on
April 1, 2014. Retrieved on November 3, 2018, from https://lanxess.com/en/corporate/investor-relations/ir-releases/ir-news-matthias-zachert-matthias-zachert-to-become-chairman/
2 Lanxess AG. (2015a). Annual Report 2014. Retrieved on November 10, 2018, from
https://lanxess.com/uploads/tx_lanxessmatrix/lxs_gb2014_e_01.pdf
3 Baeza et.al. (2017). LANXESS : FORGING STRATEGIC PARTNERSHIPS. Retrieved on September 22, 2018,
from https://www.bcg.com/publications/2017/transformation-value-creation-strategy-lanxess-forging-strategic-partnerships.aspx
4 Moldenahuer, R., Beyer, G., Kruse, F., & Möller, T. (2017). Comeback Kids - Die Gheimnisse nachhaltiger
Wertschaffung in Unternehmen. (The secrets of sustainable value creation in companies.). Retrieved on September 15, 2018, from https://www.bcg.com/Images/Report_Comeback Kids_tcm108-158622.pdf
5 Lanxess AG. (2015b). LANXESS and Saudi Aramco create world-leading joint venture for synthetic rubber.
Retrieved on November 9, 2018, from https://lanxess.com/en/corporate/investor-relations/ir-releases/ir-news-lanxess-and-saudi-aramco-create-joint-venture/
6 Lanxess AG. (2015b). LANXESS and Saudi Aramco create world-leading joint venture for synthetic rubber.
Retrieved on November 9, 2018, from https://lanxess.com/en/corporate/investor-relations/ir-releases/ir-news-lanxess-and-saudi-aramco-create-joint-venture/
7 Lanxess AG. (n.d.). TIMELINE. Retrieved on November 6, 2018, from
https://lanxess.com/corporate/about-lanxess/history/
8 Lanxess AG. (n.d.). LANXESS AT A GLANCE. Retrieved on November 7, 2018, from
https://lanxess.com/corporate/about-lanxess/who-we-are/
9 Lanxess AG. (n.d.). SEGMENTS. Retrieved on November 6, 2018, from
https://lanxess.com/corporate/products-solutions/segments/
10 Lanxess AG. (n.d.). SEGMENTS. Retrieved on November 6, 2018, from
https://lanxess.com/corporate/products-solutions/segments/
11 Lanxess AG. (2014a). Annual Report 2013. Retrieved on November 7, 2018, from
https://lanxess.com/uploads/tx_lanxessmatrix/lxs_gb13_final_e_web.pdf
12 Lanxess AG. (2015b). LANXESS and Saudi Aramco create world-leading joint venture for synthetic rubber.
Retrieved on November 9, 2018, from https://lanxess.com/en/corporate/investor-relations/ir-releases/ir-news-lanxess-and-saudi-aramco-create-joint-venture/
13 Lanxess AG. (n.d.). SEGMENTS. Retrieved on November 6, 2018, from
https://lanxess.com/corporate/products-solutions/segments/
14 Lanxess AG. (n.d.). TIMELINE. Retrieved on November 6, 2018, from
https://lanxess.com/corporate/about-lanxess/history/
15 Lanxess AG. (n.d.). TIMELINE. Retrieved on November 6, 2018, from
https://lanxess.com/corporate/about-lanxess/history/
16 Lanxess AG. (2013). Annual Report 2012. Retrieved on November 7, 2018, from
https://lanxess.com/uploads/tx_lanxessmatrix/lxs_gb2012_e_schutz.pdf
17 Rubber Asia. (2017). Overcapacity Biggest challenge for SR. Retrieved on November 18, 2018, from
https://www.rubberasia.com/2017/02/16/overcapacity-biggest-challenge-sr/
18 Baeza et.al. (2017). LANXESS : FORGING STRATEGIC PARTNERSHIPS. Retrieved on September 22, 2018,
from https://www.bcg.com/publications/2017/transformation-value-creation-strategy-lanxess-forging-strategic-partnerships.aspx
19 Lanxess AG. (2016a). Annual Report 2015. Retrieved on November 15, 2018, from
https://lanxess.com/uploads/tx_lanxessmatrix/lxs_gb2015_e.pdf
20 Lanxess AG. (2018). Annual Report 2017. Retrieved on November 16, 2018, from
https://lanxess.com/fileadmin/user_upload/LXS_GB2017_E_web.pdf
21 Lanxess AG. (2016a). Annual Report 2015. Retrieved on November 15, 2018, from
https://lanxess.com/uploads/tx_lanxessmatrix/lxs_gb2015_e.pdf
22 Lanxess AG. (2016a). Annual Report 2015. Retrieved on November 15, 2018, from
https://lanxess.com/uploads/tx_lanxessmatrix/lxs_gb2015_e.pdf
23 Lanxess AG. (n.d.). TIMELINE. Retrieved on November 6, 2018, from
https://lanxess.com/corporate/about-lanxess/history/
24 Lanxess AG. (n.d.). TIMELINE. Retrieved on November 6, 2018, from
https://lanxess.com/corporate/about-lanxess/history/
25 Lanxess AG. (n.d.). TIMELINE. Retrieved on November 6, 2018, from
https://lanxess.com/corporate/about-lanxess/history/
26 Lanxess AG. (2016a). Annual Report 2015. Retrieved on November 15, 2018, from
https://lanxess.com/uploads/tx_lanxessmatrix/lxs_gb2015_e.pdf
27 Lanxess AG. (2015a). Annual Report 2014. Retrieved on November 10, 2018, from
https://lanxess.com/uploads/tx_lanxessmatrix/lxs_gb2014_e_01.pdf
28 Lanxess AG. (2015a). Annual Report 2014. Retrieved on November 10, 2018, from
https://lanxess.com/uploads/tx_lanxessmatrix/lxs_gb2014_e_01.pdf; Lanxess AG. (2016a). Annual Report 2015. Retrieved on November 15, 2018, from
https://lanxess.com/uploads/tx_lanxessmatrix/lxs_gb2015_e.pdf
29 Baeza et.al. (2017). LANXESS : FORGING STRATEGIC PARTNERSHIPS. Retrieved on September 22, 2018,
from https://www.bcg.com/publications/2017/transformation-value-creation-strategy-lanxess-forging-strategic-partnerships.aspx
30 Lanxess AG. (2015a). Annual Report 2014. Retrieved on November 10, 2018, from
https://lanxess.com/uploads/tx_lanxessmatrix/lxs_gb2014_e_01.pdf; Lanxess AG. (2016a). Annual Report 2015. Retrieved on November 15, 2018, from
https://lanxess.com/uploads/tx_lanxessmatrix/lxs_gb2015_e.pdf
31 Lanxess AG. (2015a). Annual Report 2014. Retrieved on November 10, 2018, from
https://lanxess.com/uploads/tx_lanxessmatrix/lxs_gb2014_e_01.pdf;
Baeza et.al. (2017). LANXESS : FORGING STRATEGIC PARTNERSHIPS. Retrieved on September 22, 2018, from https://www.bcg.com/publications/2017/transformation-value-creation-strategy-lanxess-forging-strategic-partnerships.aspx
32 Lanxess AG. (2016a). Annual Report 2015. Retrieved on November 15, 2018, from
https://lanxess.com/uploads/tx_lanxessmatrix/lxs_gb2015_e.pdf
33 Lanxess AG. (2016a). Annual Report 2015. Retrieved on November 15, 2018, from
https://lanxess.com/uploads/tx_lanxessmatrix/lxs_gb2015_e.pdf
34 Lanxess AG. (2016a). Annual Report 2015. Retrieved on November 15, 2018, from
https://lanxess.com/uploads/tx_lanxessmatrix/lxs_gb2015_e.pdf
35 Lanxess AG. (2014a). Annual Report 2013. Retrieved on November 7, 2018, from
https://lanxess.com/uploads/tx_lanxessmatrix/lxs_gb13_final_e_web.pdf
36 Lanxess AG. (2015a). Annual Report 2014. Retrieved on November 10, 2018, from
https://lanxess.com/uploads/tx_lanxessmatrix/lxs_gb2014_e_01.pdf
37 Lanxess AG. (2014a). Annual Report 2013. Retrieved on November 7, 2018, from
https://lanxess.com/uploads/tx_lanxessmatrix/lxs_gb13_final_e_web.pdf
38 Lanxess AG. (2015a). Annual Report 2014. Retrieved on November 10, 2018, from
https://lanxess.com/uploads/tx_lanxessmatrix/lxs_gb2014_e_01.pdf
39 Lanxess AG. (2018). Annual Report 2017. Retrieved on November 16, 2018, from
https://lanxess.com/fileadmin/user_upload/LXS_GB2017_E_web.pdf
40 Lanxess AG. (2016a). Annual Report 2015. Retrieved on November 15, 2018, from
https://lanxess.com/uploads/tx_lanxessmatrix/lxs_gb2015_e.pdf
41 Lanxess AG. (2014a). Annual Report 2013. Retrieved on November 7, 2018, from
https://lanxess.com/uploads/tx_lanxessmatrix/lxs_gb13_final_e_web.pdf
42 Lanxess AG. (2014a). Annual Report 2013. Retrieved on November 7, 2018, from
https://lanxess.com/uploads/tx_lanxessmatrix/lxs_gb13_final_e_web.pdf
43 Lanxess AG. (2015a). Annual Report 2014. Retrieved on November 10, 2018, from
https://lanxess.com/uploads/tx_lanxessmatrix/lxs_gb2014_e_01.pdf
44 Lanxess AG. (2015a). Annual Report 2014. Retrieved on November 10, 2018, from
https://lanxess.com/uploads/tx_lanxessmatrix/lxs_gb2014_e_01.pdf
45 Lanxess AG. (2014b). LANXESS pressing ahead with realignment, consolidating business units. Retrieved on
November 4, 2018, from https://lanxess.com/en/corporate/investor-relations/ir-releases/ir-news-q2/
46 Lanxess AG. (2015a). Annual Report 2014. Retrieved on November 10, 2018, from
https://lanxess.com/uploads/tx_lanxessmatrix/lxs_gb2014_e_01.pdf
47 Baeza et.al. (2017). LANXESS : FORGING STRATEGIC PARTNERSHIPS. Retrieved on September 22, 2018,
from https://www.bcg.com/publications/2017/transformation-value-creation-strategy-lanxess-forging-strategic-partnerships.aspx
48 Lanxess AG. (2015a). Annual Report 2014. Retrieved on November 10, 2018, from
https://lanxess.com/uploads/tx_lanxessmatrix/lxs_gb2014_e_01.pdf
49 Baeza et.al. (2017). LANXESS : FORGING STRATEGIC PARTNERSHIPS. Retrieved on September 22, 2018,
from https://www.bcg.com/publications/2017/transformation-value-creation-strategy-lanxess-forging-strategic-partnerships.aspx
50 Moldenahuer, R., Beyer, G., Kruse, F., & Möller, T. (2017). Comeback Kids - Die Gheimnisse nachhaltiger
Wertschaffung in Unternehmen. (The secrets of sustainable value creation in companies.). Retrieved on September 15, 2018, from https://www.bcg.com/Images/Report_Comeback Kids_tcm108-158622.pdf
51 Lanxess AG. (2015a). Annual Report 2014. Retrieved on November 10, 2018, from
https://lanxess.com/uploads/tx_lanxessmatrix/lxs_gb2014_e_01.pdf
52 Lanxess AG. (2015b). LANXESS and Saudi Aramco create world-leading joint venture for synthetic rubber.
53 Grant, R. M. (2016). Contemporary Strategy Analyse: Text and Cases (9th ed.). Chichester: John Wiley &
Sons. p. 71
54 Lanxess AG. (2015b). LANXESS and Saudi Aramco create world-leading joint venture for synthetic rubber.
Retrieved on November 9, 2018, from https://lanxess.com/en/corporate/investor-relations/ir-releases/ir-news-lanxess-and-saudi-aramco-create-joint-venture/
55 Lanxess AG. (2015b). LANXESS and Saudi Aramco create world-leading joint venture for synthetic rubber.
Retrieved on November 9, 2018, from https://lanxess.com/en/corporate/investor-relations/ir-releases/ir-news-lanxess-and-saudi-aramco-create-joint-venture/
56 Lanxess AG. (2016b). LANXESS and Saudi Aramco rubber joint venture to be launched on April 1, 2016,
under the name ARLANXEO. Retrieved on November 7, 2018, from https://lanxess.com/en/corporate/investor-relations/ir-releases/ir-news-arlanxeo/
57 Lanxess AG. (2016a). Annual Report 2015. Retrieved on November 15, 2018, from
https://lanxess.com/uploads/tx_lanxessmatrix/lxs_gb2015_e.pdf
58 Lanxess AG. (2016a). Annual Report 2015. Retrieved on November 15, 2018, from
https://lanxess.com/uploads/tx_lanxessmatrix/lxs_gb2015_e.pdf
59 Lanxess AG. (2017). Annual Report 2016. Retrieved on November 13, 2018, from
https://lanxess.com/fileadmin/user_upload/lxs_gb2016_e_Stand_1705.pdf
60 Lanxess AG. (2017). Annual Report 2016. Retrieved on November 13, 2018, from
https://lanxess.com/fileadmin/user_upload/lxs_gb2016_e_Stand_1705.pdf
61 Baeza et.al. (2017). LANXESS : FORGING STRATEGIC PARTNERSHIPS. Retrieved on September 22, 2018,
from https://www.bcg.com/publications/2017/transformation-value-creation-strategy-lanxess-forging-strategic-partnerships.aspx
62 Lanxess AG. (2018). Annual Report 2017. Retrieved on November 16, 2018, from
https://lanxess.com/fileadmin/user_upload/LXS_GB2017_E_web.pdf
63 Lanxess AG. (2018). Annual Report 2017. Retrieved on November 16, 2018, from
CHAPTER 4: Teaching Notes
4.1 Synopsis
This teaching case shows how Lanxess was confronted with a changing industry and the associated transformation. More specifically, it demonstrates how a joint venture can help to deal with the negative consequences of overcapacity in the industry. A small paragraph before the introduction serves to introduce the protagonist of the case, which is the CEO Matthias Zachert, and his solution.
The first section is the introduction, which describes the history and development of Lanxess. It shows that Lanxess was very successful until 2012, underscores its good positioning in the rubber business and the motivation to expand it.
The second section deals with various developments in the chemical industry, especially in the rubber business. This ranges from investments in capacity to environmental awareness.
The third section covers the challenges that Lanxess started to face in 2013 and 2014. It also provides some key figures from both financial years.
The forth sections introduce the three-stage efficiency program "Let's LANXESS again". Each phase is described in more detail.
The last section deals with the performance of each phase, but in particular with the last. The main goal of this case is to expose students to a real management problem. They should be able to identify that the rubber industry became unattractive, understand the implications of overcapacity and how a joint venture helped in this situation. Exhibits of the financial data and the efficiency program are provided to support the analysis.
4.2 Target audience
The case was developed to be used in class with undergraduate students of business administration. The case can be discussed in courses like “strategic planning”, “business management” or “international management”.
4.3 Learning objectives
This case serves as an exemplary model for successful transformations. It demonstrates how an attractive industry can become unattractive. More precisely, it shows how overcapacity can arise and what its consequences and implications are. Students learn how a joint venture can