Universidade de Trás-os-Montes e Alto Douro
Role of mitochondrial p66Shc in
nefazodone-induced mitochondrial toxicity on HepG2 cells
Dissertação de Mestrado em Biologia
Ana Marta Ribeiro da Silva
Orientador: Doutor Paulo Oliveira. Coorientador: Doutor Dario Santos.
iii
Universidade de Trás-os-Montes e Alto Douro
Role of mitochondrial p66Shc in
nefazodone-induced mitochondrial toxicity on HepG2 cells
Dissertação de Mestrado em Biologia
Ana Marta Ribeiro da Silva
Orientador: Doutor Paulo Oliveira.
Coorientador: Doutor Dario Santos.
Composição do Júri:
__________________________________________
__________________________________________
__________________________________________
v Orientador
_________________________________________________________ Doutor Paulo Jorge Gouveia Simões da Silva Oliveira
Centro de Neurociências e Biologia Celular, UC
Coorientador
________________________________________________________ Doutor Dario Joaquim Simões Loureiro dos Santos
vii
Work performed in Mitochondrial Toxicology and Experimental Therapeutics Group, at the Center for Neuroscience and Cell Biology, University of Coimbra, under
ix
xi
This work was supported by the Portuguese Foundation for Science and Technology (FCT) and co-funded by COMPETE/FEDER/National budget (PTDC/SAU TOX/117912/2010
and PEst-C/SAU/LA0001/2013-2014).
xiii
This original research was developed to achieve the Master Degree in Biology.
xv I declare that this is a true copy of my thesis including any final revisions, as approved by my
thesis committe, and that this thesis has not been submitted for a higher degree to any other University or Institution.
Ana Marta Silva, BSc March, 2015
xvii
"I was taught that the way of progress was neither swift nor easy."
xix
Acknowledgments
At the end of another cycle, I could not fail to thank all those who made possible the realization of this project.
Firstly, I want to thank to the entities involved in the financing of this project, supported by Foundation for Science and Technology (FCT) and co-funded
COMPETE/FEDER/National budget (PTDC/SAU-TOX/117912/2010 and
PEst-C/SAU/LA0001/2013-2014).
I would like to express my sincere acknowledgments to my supervisor, Doctor Paulo Oliveria, for the opportunity to develop this project and for having received me in your group. I appreciate all the words of encouragement throughout this period, which was not always easy. Thank you for all the availability and help in solving all the difficulties associated with this work.
Then, I would like to express my sincere acknowledgments to Doctor Dario Santos for leading me to the opportunity to participate in this project. Thank you for having encouraged me to pursue my goals and for all the things you taught me during the last years.
To all the members of Mitochondrial Toxicology and Experimental Therapeutics Group, for all the help you have given me throughout this work. Thank you for always being available and for sharing your knowledge with me.
To Doctor Inês Barbosa, for all the help provided during this work. Thank you for the availability to teach me and especially for all the encouragement words and for making me believe it was possible to get here.
To all my friends, the best in the world, thank you for having me encouraged along this year. I would like to thank in a special way to Ana Fonseca, Filipa Soares and André Teixeira for always having a kind word to make everything simpler.
Finally, a very special acknowledgment to my family for always been the support that makes all steps surmountable. A very special thank you to my parents for always encouraging me to follow my dreams and understand my passion for science. A special thanks to grandfather Fernando that even far always takes care of me.
xxi
Agradecimentos
No final de mais um ciclo, não poderia deixar de agradecer a todos os que tornaram possível a concretização deste projecto.
Em primeiro lugar, quero agradecer às entidades envolvidas no financiamento deste projecto, suportado pela Fundação para a Ciência e Tecnologia (FCT) e co-financiado pelos fundos COMPETE/FEDER/National budget (PTDC/SAU-TOX/117912/2010 and PEst-C/SAU/LA0001/2013-2014).
Agradeço ao meu orientador, o Doutor Paulo Oliveira, pela oportunidade de desenvolver este projecto e por me ter recebido no seu grupo. Agradeço todas as palavras de incentivo ao longo deste período, que nem sempre foi fácil. Muito obrigada por toda a disponibilidade e ajuda na resolução das dificuldades associadas a este percurso.
Em seguida, agradeço ao Doutor Dario Santos por ter sido o elo de ligação a este projecto e pela confiança depositada nas minhas capacidades de trabalho. Obrigada por me ter encorajado a perseguir os meus objectivos e por todos os ensimanentos que me transmitiu ao longo destes anos.
Agradeço a todos os elementos do grupo Mitochondrial Toxicology and Experimental Therapeutics por toda a ajuda que me prestaram ao longo deste trabalho. Obrigada por estarem sempre disponíveis e por partilharem comigo os vossos conhecimentos.
Agradeço especialmente à Dr.ª Inês Barbosa, por ter seguido mais de perto o meu trabalho e me ter ajudado sempre que foi necessário. Obrigada por todas as palavras de incentivo e por sempre me teres feito acreditar que era possível chegar até aqui.
A todos os meus amigos, os melhores do mundo, agradeço por me terem encorajado ao longo deste percurso. Gostaria de agradecer de um modo particular à Ana Fonseca, à Filipa Soares e ao André Teixeira por terem sempre uma palavra amiga para tornar tudo mais simples.
Por fim, agradeço à minha família por ter sido sempre o suporte que torna todas as etapas ultrapassáveis. Um obrigada muito especial aos meus pais por me encorajarem sempre a seguir os meus sonhos e por entenderem a minha paixão pela Ciência. Um obrigada especial ao avô Fernando, que mesmo longe, toma sempre conta de mim.
xxiii
Abstract
Nefazodone (NEF) is an antidepressive agent that has been used for several years in the treatment of depression. Despite its efficacy in the treatment of depression, NEF was withdrawn from the market after the development of hepatic injury on several patients upon treatment. p66Shc signalling, which implicates its phosphorylation in ser36 residue (pSer36-p66Shc) upon stress stimuli, has been described to be involved on reactive oxygen species (ROS) generation and cell death. After its phosphorylation p66Shc is thought to be translocated to mitochondria where it leads to further ROS production, disrupting mitochondrial function and possibly triggering of cell death.
The main objective of the present work was to investigate whether p66Shc signalling is activated during NEF treatment of a human hepatocellular cell line (HepG2).
Our results revealed an increase on p66Shc content after 72 h of incubation with NEF, whereas, surprisingly the content of p66Shc phosphorylated form was decreased after NEF treatment. Although this study was not able to prove the existence of a link between NEF administration and p66Shc activation and consequent translocation to mitochondria, our results support the existence of a link between NEF treatment and apoptosis in the hepatic cell model. NEF treatment led to a decrease in cell mass, mitochondria depolarization and to changes on HepG2 cell morphology, which showed features typical from apoptotic cells. We also found other evidences supporting apoptosis activation upon Nefazodone treatment, such as the increase on late apoptotic cell population, the decrease on viable/early apoptotic cells and an increase of caspases activity. In summary, our data showed an increase of ROS levels upon NEF treatment which although might be associated with p66Shc signaling and its consequent translocation to mitochondria, the fast turn-over of pSer36-p66Shc may be masking these observations.
Keywords: Apoptosis, Hepatotoxicity, Human hepatocellular liver carcinoma cell line,
xxv
Resumo
A Nefazodona (NEF) é um fármaco antidepressivo, usado durante um longo período no tratamento da depressão. Apesar da sua eficácia, este fármaco foi retirado do mercado devido ao aparecimento de diversos casos de lesão hepática em pacientes submetidos a tratamento com NEF. A via de sinalização celular que envolve a proteína p66Shc, e a sua fosforilação na serina 36 (Ser36) após estimulo de stress, foi anteriormente associada à produção de espécies reactivas de oxigénio e à ocorrência de morte celular. De acordo com esta hipótese, a proteína p66Shc é translocada para a mitocôndria após uma situação de stress celular onde participa na produção de ROS, levando ao comprometimento da função mitocondrial e podendo, ainda, desencadear o processo de morte celular.
O principal objectivo deste trabalho foi investigar a possibilidade de que esta via de sinalização seja activada na linha celular do carcinoma hepatocelular humano (HepG2) durante o tratamento com NEF.
Os resultados obtidos revelaram um aumento do teor de p66Shc em células expostas à nefazodona por um perídodo de 72 h e ainda um surpeendente decréscimo da forma fosforilada desta proteína após o tratamento com NEF. Embora este trabalho não possa comprovar a existência de uma ligação entre a administração de NEF e a activação e translocação da proteína p66Shc, os resultados obtidos corroboram a existência de uma associação entre o tratamento com NEF e o início do processo apoptótico no modelo celular utilizado. O tratamento com NEF levou à diminuição da massa celular, à despolarização mitocondrial e ainda a alterações na morfologia celular, com as células HepG2 a exibirem caracteristicas tipicamente encontradas em células apoptóticas. Foram também encontradas outras evidências consistentes com a activação da apoptose induzida por NEF, como o aumento da população de células apoptóticas, a diminuição da população de células viáveis e o aumento da actividade das caspases. Em suma, os resultados obtidos mostram um aumento dos níveis de ROS após o tratamento com NEF, embora a possibilidade de uma associação entre este aumento e a activação da p66Shc e translocação para a mitocôndria possa estar ocultada devido ao rápido processamento da forma fosforilada da proteína p66Shc.
Palavras-chave: Apoptose, Hepatotoxicidade, linha celular do carcinoma hepatocelular
xxvii
Table of Contents
Acknowledgments ... xix Agradecimentos ... xxi Abstract ... xxiii Resumo ... xxv List of figures ... xxix List of Tables ... xxxi Abbreviations ... xxxiiiChapter 1: Introduction... 1
1.1. Nefazodone as an antidepressive agent ... 1 1.2. Nefazodone: drug-induced hepatotoxicity ... 3 1.3. Cell Death Signaling Pathways ... 5 1.3.1.Extrinsic Apoptotic Pathway ... 5 1.3.2. Intrinsic Apoptotic Pathway ... 6 1.4. p66Shc in ROS Generation and Cell Death... 9 1.5. HepG2 cells as a model to study NEF-induced Hepatotoxicity ... 12 1.6. Hypothesis ... 13
Chapter 2: Materials and Methods ... 15
2.1. Reagents... 15 2.2. Cell culture and treatment ... 16 2.3. Sulforhodamine B Colorimetric Assay... 16 2.4. Collection of total Extracts from HepG2 cells ... 17 2.5. Determination of Protein Content for Western-Blot Analysis: Bicinchonic acid assay (BCA) ... 18 2.6. Western-Blot Analysis ... 18 2.7. Flow cytometry ... 20 2.8. Confocal microscopy ... 21 2.9. Calcein-AM and Propidium Iodide Assay ... 22
xxviii 2.10. Caspases 3 and 9-like activities ... 22 2.11. Statistical Analysis ... 23
Chapter 3: Results ... 25
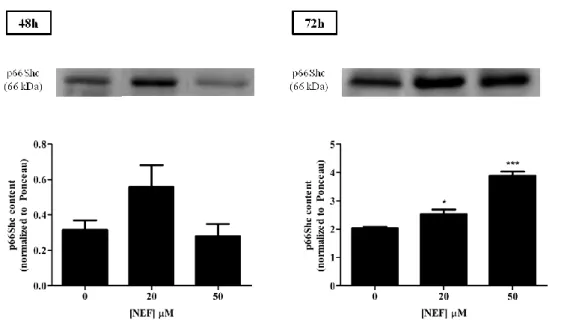
3.1. Nefazodone effects on HepG2 cell mass ... 25 3.2. Nefazodone increases total p66Shc on HepG2 cells, but not serine 36-phosphorylated form ... 26 3.3. Effects of Nefazodone on nuclear morphology, mitochondrial superoxide anion and polarization ... 28 3.4. Nefazodone induces alterations on mitochondrial membrane potential ... 34 3.5. Evaluation of cell viability after NEF treatment through flow cytometry ... 35 3.6. Effect of Nefazodone on caspase-3 and -9-like activities ... 40
Chapter 4: Discussion ... 43 Chapter 5: Final conclusion ... 51 Chapter 6: Future Perspectives ... 53 Chapter 7: References ... 55
xxix
List of figures
Figure 1: Chemical structure of Nefazodone ... 1 Figure 2: Schematic representation of possible NEF mechanism as an antidepressant.. ... 3 Figure 3:Extrinsic and intrinsic apoptotic pathways. ... 8 Figure 4: Schematic organization of SHC1 protein isoforms. ... 9 Figure 5: p66Shc-dependent ROS increase. ... 10 Figure 6: Confocal microscopy images of HepG2 cells labeled with Tetramethylrhodamine, methyl ester (TMRM), LipidTOX and Hoechst 33342.. ... 12 Figure 7: Experimental design for SRB assay.. ... 17 Figure 8: Effects of NEF treatment on HepG2 cell mass.. ... 25 Figure 9: p66Shc content increases after NEF treatment for 72 h.. ... 27 Figure 10: NEF treatment decreases serine 36-phosphorylated p66Shc on HepG2 cells... 28 Figure 11: NEF induces alterations on HepG2 nuclear morphology and on mitochondrial membrane potential on 48 h of treatment.. ... 29 Figure 12: NEF induces alterations on HepG2 nuclear morphology and on mitochondrial membrane potential on 72 h of treatment.. ... 30 Figure 13: NEF effect on mitochondrial superoxide anion generation on 48 h of treatment ... 32 Figure 14: NEF effect on mitochondrial superoxide anion generation on 72 h of treatment... 33 Figure 15: Mitochondrial membrane potential alterations upon NEF treatment.... ... 35 Figura 16 (A): Representative flow cytometry results for HepG2 cells exposed to 20 µM and 50 µM NEF for 48 h ... 37 Figure 16 (B): Quantitative analysis of NEF-induced cell death on HepG2 cells, after 48h of exposure to NEF.. ... 38 Figure 17 (A): Representative flow cytometry results for HepG2 cells exposed to 20 µM and 50 µM NEF for 72h .. ... 39 Figure 17 (B): Quantitative analysis of NEF-induced cell death on HepG2 cells, after 72h of exposure to NEF . ... 40 Figure 18: Effect of exposure to NEF for 24h on caspase-3 and -9 like activities.. ... 41 Figure 19: Effect of exposure to NEF for 48h on caspase-3 and -9 -like activities.. ... 42
xxxi
List of Tables
xxxiii
Abbreviations
ADP Adenosine diphosphate
ALT Alanine Aminotransferase
APAF-1 Apoptotic protease activating factor-1
AST Aspartate Aminotransferase
ATP Adenosine triphosphate
BAD BCL-2 associated agonist of cell death
BAK BCL-2 antagonist/killer
BAX BCL-2 associated X protein
BCA Bicinchoninic Acid Assay
BCL-2 B-cell lymphoma-2
BCL2A1 B-cell lymphoma 2-related protein A1
BCL-w BCL-2-like protein 2
BXL-XL B-cell lymphoma extra large
BID BH3 interacting domain death agonist
BIK BCL-2-interacting killer
BIM BCL2-like 11
BMF BCL-2 modifying factor
CAM Calcein acetoxymethyl ester
CHAPS 3-[(3-Cholamidopropyl)dimethylammonio]-1-propanesulfonate hydrate
xxxiv
CYP3A4 Cytochrome P450 3A4
Cyt c Cytochrome c
DA Dopamine
DISC Death-inducing signaling complex.
DMEM Dulbecco’s modified Eagle’s medium
DMSO Dimethyl sulfoxide
DNA Deoxyribonucleic acid
DTT Dithiothreitol
EDTA Ethylenediaminetetraacetic acid
FASL Fas ligand
GSH Reduced Glutathione
GSSG Oxidized Glutathione
HEPES (4-(2-hydroxyethyl)-1-piperazineethanesulfonic acid )
HepG2 Human Hepatocellular Carcinoma cell line
HRK Harakiri, BCL-2 interacting protein
H2O2 Hydrogen peroxide
5-HT 5-hydroxytryptamine (serotonin)
5-HT2A 5 hydroxytryptamine (serotonin) (5-HT) receptor 2
IMS Intermembrane Space
MCL-1 Myeloid cell leukemia 1 protein
MEFs Mouse embryo fibroblasts
xxxv
MOMP Mitochondrial outer membrane permeabilization
mtHsp70 Mitochondrial heat-shock protein 70
NE Norepinephrine
NEF Nefazodone
NOXA Noxa phorbol-12-myristate-13-acetate-induced protein 1
OMM Outer mitochondrial membrane
OXPHOS Oxidative Phosphorylation
PARP Poly (ADP) ribose polymerase
PBS Phosphate buffered saline
PI Propidium iodide
Pin 1 Prolyl isomerase 1
PKC-β Protein kinase C beta
PP2A Protein serine/threonine phosphatase type 2
PTB Phosphothyrosine Binding Domain
PTP Permeability Transition Pore
PUMA p53-upregulated modulator of apoptosis
PVDF Polyvinylidene difluoride
ROS Reactive Oxygen Species.
SDS Sodium dodecyl sulphate
SDS-PAGE SDS-polyacrylamide gels
SHC Src homolog and collagen homolog proteins
xxxvi
SOD Superoxide dismutase
SRB Sulforhodamine B
SSRIs Selective serotonin reuptake inhibitors
TCAs Tricyclic antidepressants
TMRM Tetramethylrhodamine, Methyl Ester
TNFR Tumor necrosis factor receptor
TOM/TIM Outer membrane translocase/inner membrane translocase
TRAIL Tumor necrosis factor-related apoptosis-inducing ligand
Δψm Inner mitochondrial membrane potential
Chapter 1. Introduction
Ana Marta Silva | Role of mitochondrial p66Shc in nefazodone-induced mitochondrial toxicity on HepG2 cells 1
1. Introduction
1.1. Nefazodone as an antidepressive agent
Nefazodone (NEF) is a phenylpiperazine derivative with a structure similar to trazodone (Lucena et al. 2003) (Fig.1). This drug was approved in 1994 in the United States for the treatment of depression (von Moltke et al. 1999), a common mental disorder, characterized by sadness, loss of interest or pleasure, feelings of guilt or low self-worth, disturbed sleep or appetite, feelings of tiredness, and poor concentration (World Health Organization, 2014).
Figure 1: Chemical structure of Nefazodone (Adapted from von Moltke et al. 1999).
Nefazodone belongs to a new generation of antidepressants, alternative to the monoamine oxidase inhibitors (MAOIs), tricyclic antidepressants (TCAs), and serotonin selective reuptake inhibitors (SSRIs).
The MAOIs increase the levels of neurotransmitters such as norepinephrine and serotonin through the inhibition of monamine oxidase, a mitochondrial enzyme capable of metabolizing the mentioned neurotransmitters (He & Richardson 1997). However, side effects such as hepatotoxicity and the need for dietary restrictions to reduce the risk of developing severe hypertensive crises related to the effects of dietary tyramine (Liu & Rustgi 1987; Kent 2000) make this class of antidepressants less used in the present.
The TCAs have several pharmacological targets, such as α-adrenergic receptors and histamine receptors (Horst & Preskorn 1998), causing unwanted side effects which include
Chapter 1. Introduction
Ana Marta Silva | Role of mitochondrial p66Shc in nefazodone-induced mitochondrial toxicity on HepG2 cells 2
dry mouth, sedation, cardiovascular toxicity or postural hypotension (Horst & Preskorn 1998; Kent 2000; Lucena et al. 2003). Unlike the above mentioned compounds, a third class of antidepressants was developed in order to overcome these unwanted side effects: serotonin selective reuptake inhibitors (SSRIs), acting by blocking serotonin uptake at all serotonergic synapses and soon achieving a central role in the treatment of depression (Horst & Preskorn 1998). This class of antidepressants showed clear advantages over TCAs and MOAs regarding safety tolerance and easy of dosing (Kent 2000). Despite these advantages, SRRIs side effects include restlessness, nervousness, insomnia, nausea, diarrhea, agitation and weight gain (Kent 2000), which compromise their tolerance in a patient with depressive condition.
As an alternative to avoid all the unwanted side effects of the previously mentioned antidepressants, another class has emerged: the serotonin noradrenergic reuptake inhibitors (SNaRIs) (Kent 2000). Nefazodone belongs to this class and appeared as a substitute of trazodone, lacking unwanted side effects of trazodone such as excessive sedation and postural hypotension (Kent 2000). Despite being related to trazodone, NEF presents several advantages as it has the capacity to be effective against anxiety and agitation symptoms associated with depression (Taylor & Prather 2003) and also can be used in the treatment of panic disorder (Bystritsky et al. 1999).
Nefazodone mechanism of action is based on its antagonistic activity on post-synaptic 5 hydroxytryptamine (serotonin) (5-HT) receptor 2 (5-HT2A) and also on the inhibition of serotonin and noradrenaline reuptake (Fig.2) (Feighner 1999; Richelson 2001; Ciraulo et al. 2010). According to the monoamine hypothesis for depression, deficience of the biogenic amine system (norepinephrine and/or serotonin pathways) has a central role in the development of a depressive condition (He & Richardson 1997; Hirschfeld 2000). Thus, depressive symptoms are the result of low levels of monoamine neurotransmitters like serotonin (5-HT), norepinephrine (NE), and/or dopamine (DA) (Mulinari 2012; Mahar et al. 2014). Taking this information into consideration, the beneficial effect of NEF in the treatment of depression would result from its capacity to increase serotonin (5-hydroxytryptamine -5-HT) neurotransmission mediated by 5HT1A (Taylor & Prather 2003). The effect of NEF on other neurotransmitters receceptors is limited (Taylor et al. 1986), which allows for a low incidence of side effects upon treatment with this antidepressant.
Chapter 1. Introduction
Ana Marta Silva | Role of mitochondrial p66Shc in nefazodone-induced mitochondrial toxicity on HepG2 cells 3
Figure 2:Schematic representation of possible NEF mechanism as an antidepressant. NEF mechanism of
action is based on the monoamine hypothesis that suggests a decrease on monoamine neurotransmitters (norepinephrine, serotonin) as the main cause of depression development. Thus, NEF acts as an antagonist on 5-HT2A receptors located on post-synaptic membranes. In addition, NEF also inhibits 5-HT reuptake on pre-synaptic membranes. NEF enhances serotonin neutransmission allowing a successful treatment for depression. (Adapted from CNS forum. The Lundbeck Institute, 2014).
1.2. Nefazodone: drug-induced hepatotoxicity
In 1999, a total of four cases of hepatic injury were reported in patients treated with NEF (Aranda-Michel et al. 1999; Lucena et al. 1999). Later, in 2004, Bristol-Myers Squibb decided to stop the marketing of the drug in the United States as a consequence of the emergence of several hepatotoxicity cases following depression treatment (Aranda-Michel et al. 1999; Eloubeidi et al. 2000; Choi 2003). As a consequence of NEF tretament, hepatotoxic-related symptoms such as jaundice, dark urine, clay colored stool and an increase in the levels of Alanine Aminotransferase (ALT), Aspartate Aminotransferase (AST), total bilirubin level and prothrombin time became common (Aranda-Michel et al. 1999; Lucena et al. 1999) . The toxicity associated with NEF has been described as idiosyncratic (Cosgrove et al. 2009),
Chapter 1. Introduction
Ana Marta Silva | Role of mitochondrial p66Shc in nefazodone-induced mitochondrial toxicity on HepG2 cells 4
which means that adverse effects were not verified in the majority of people treated with the range of doses used clinically. This fact constitutes a restriction in the investigation of drug-toxicity. Another limitation regarding the study of the observed NEF-induced toxicity is associated with the fact that both cell and animal models are inefficient in its detection. Consequently, the majority of idiosyncratic drug hepatotoxicities are not identified before the approval for human use (Cosgrove et al. 2009).
A proposed mechanism for NEF’s hepatotoxicity is based on the metabolism of the drug. This hypothesis came out due to the fact that, although NEF is metabolized by cytochrome P450 3A4 (CYP3A4) it also acts as an inhibitor of this enzyme, which may lead to several interactions with other xenobiotics, each with their own mitochondrial liabilities (Benazzi 1997; Alderman 1999). Nefazodone toxicity also interferes with normal mitochondrial function. During the development of a new approach to evaluate mitochondrial toxicity of several drugs, Nadacaniva et al. verified that at a concentration of 50 µM, NEF strongly inhibits complex I of oxidative phosphorylation (OXPHOS). However, the drug also inhibited complexes II+III, IV and V (Nadanaciva et al. 2007). The inhibitory effect of NEF on OXPHOS complexes was also verified in experiments developed by Dykens et. al, reforcing the potently inhibition of complex I by NEF, on isolated bovine heart mitochondria (Dykens et al. 2008). In this study, the toxic effect of NEF at the mitochondrial level was supported by other data suggesting that NEF impairs normal mitochondrial membrane potential, markedly reducing intracellular reduced glutathione and increasing reactive oxygen species (ROS) generation on primary cultures of human hepatocytes. A dramatic reduction on oxygen comsumption on isolated rat liver mitochondria was also identified (Dykens et al. 2008).
Alterations on OXPHOS complexes can compromise cell survival, attending that OXPHOS is the major source of cellular energy, provided by mitochondria (Nadanaciva et al. 2007).
Chapter 1. Introduction
Ana Marta Silva | Role of mitochondrial p66Shc in nefazodone-induced mitochondrial toxicity on HepG2 cells 5
1.3. Cell Death Signaling Pathways
Apoptosis, or programmed cell death, has a central role in the development and homeostasis of all multicellular organisms (Jacobson et al. 1997; Horvitz 1999). This form of cell death was first described by Kerr and colleagues in 1972 (Kerr et al. 1972) and is triggered in response to physiologic or pathologic stimuli (Hengartner 2000). The apoptotic process is essential for normal development (Tebourbi et al. 1998) and is under strict regulation. A failure in this control can lead to the development of pathological conditions as the supression of the apoptotic machinery, described to be responsible for the development of autoimmune diseases, and constituting a cancer hallmark (Thompson 1995; Hanahan & Weinberg 2000). Apoptotic cells show typical features such as cytoplasmic membrane blebbing, chromatin condensation, deoxyribonucleic acid (DNA) fragmentation, disruption of organelle membranes, mitochondria disruption and apoptotic bodies generation (Kerr et al. 1972; Trump et al. 1997; Savill & Fadok 2000). Another feature of apoptosis is the absence of inflammatory reaction, due to phagocytosis of apoptotic cells by macrophages and adjacent cells, avoiding the release of cell content (Savill & Fadok 2000; Kurosaka et al. 2003).
Two main apoptotic pathways have been described so far, the extrinsic pathway (or death receptor pathway) and the intrinsic pathway (or mitochondrial pathway). These two pathways are linked so that molecules in one pathway can influence the other (Igney & Krammer 2002). Both pathways converge to caspase-3 and other proteases and nucleases that drive the latest events of programmed cell death (Jin & El-deiry 2005).
1.3.1.Extrinsic Apoptotic Pathway
The extrinsic pathway of apoptosis (Fig.3-A) involves cell surface death receptors such as Fas, tumor necrosis factor receptor (TNFR) or tumor necrosis factor-related apoptosis-inducing ligand (TRAIL) receptors (Jin & El-deiry 2005). Fas receptor is stimulated through the binding of Fas ligand (FASL), leading to the recruitment of the adaptor protein Fas-associated death domain (FADD) and caspase-8. Together, these components form the death-inducing signaling complex (DISC) which is involved in the autoactivation of initiator caspase-8 and the begining of a caspases cascade, with the activation of effector caspases -3,
Chapter 1. Introduction
Ana Marta Silva | Role of mitochondrial p66Shc in nefazodone-induced mitochondrial toxicity on HepG2 cells 6
-6 and -7 and progression of the apoptotic process (Nagata & Golstein 1995; Lee et al. 1997; Jin & El-deiry 2005).
1.3.2. Intrinsic Apoptotic Pathway
The intrinsic apoptotic pathway (Fig.3-B) can be triggered by several intrinsic signals such DNA damage, cytotoxic stress, cytokine deprivation, (Brenner & Mak 2009) viral infection or growth-factor deprivation (Youle & Strasser 2008). B-cell lymphoma-2 (BCL-2) family of proteins plays an important role in the regulation of the intrinsic pathway as well as in the maintenance of mitochondrial integrity (Cory & Adams 2002; Youle & Strasser 2008). This family of proteins includes pro-apoptotic and anti-apoptotic elements (Elmore 2007; Yao et al. 2012).
Both BAX and BAK are pro-apoptotic proteins involved in a major event of the intrinsic apoptotic pathway, the mitochondrial outer membrane permeabilization (MOMP) (Brenner & Mak 2009). One of the hypothesis that explains BAX and BAK role in MOMP suggests that these proteins form pores in the outer mitochondrial membrane (OMM) (Mikhailov et al. 2003) allowing the release of cytochrome c (cyt c) and other apoptotic factors from mitochondria to the cytoplasm. Consequently, cytoplasmic cyt c interacts with and binds to the apoptotic protease activating factor-1 (Apaf-1) and to pro-caspase 9, resulting in the formation of the apoptossome, a complex responsible for the conversion and activation of pro-caspase 9 into caspase-9 (Zou et al. 1999; Acehan et al. 2002). This activation triggers a cascade of caspases with the subsequent activation of executioner caspases -3 and -7 (Li et al. 1997). Once activated, effector caspases allow the apoptotic process through protein cleavage (Mennella 2011). Nuclear lamins (Lazebnik et al. 1995), retinoblastoma (Janicke et al. 1996) and DNA dependent protein kinase (Casciola-Rosen et al. 1996) are some of the target proteins cleaved by caspases.
In addition to BAX and BAK, another group of pro-apoptotic proteins have been described, including BAD, BIK, BID, HRK, BIM , BMF, NOXA and PUMA. These pro-apoptotic proteins share a sequence of amino acids called BH3 domain (BH3-only proteins). Two different hypothesis have been proposed to explain the mechanism through which BH3-only proteins promote apoptosis. One of the models proposes that this class of proteins directly binds to and inhibits BCL-2 anti-apoptotic proteins, allowing BAX and BAK to allow
Chapter 1. Introduction
Ana Marta Silva | Role of mitochondrial p66Shc in nefazodone-induced mitochondrial toxicity on HepG2 cells 7
the release of cyt c and other intermembrane proteins (Willis et al. 2007). In this model, BCL-2 anti-apoptotic proteins are sequestred by BH3-only proteins, blocking the ability of BCL-BCL-2 anti-apoptotic proteins to neutralize BAX and BAK action, and allowing the permeabilization of the OMM, as previously mentioned (Willis et al. 2007). An alternative model suggests that BH3-only proteins are involved in the direct activation of BAX and BAK pro-apoptotic proteins (Youle 2007). When activated, BAX and BAK can insert and oligomerize into the OMM allowing permeabilization and the release of cyt c to the cytoplasm, triggering the activation of the intrinsic/mitochondrial apoptotic pathway (Wei et al. 2001; Youle et al. 2007; Youle & Strasser 2008).
As mentioned above, the BCl-2 family also includes anti-apoptotic proteins, such as BCL-2, BCL-XL, MCL-1, BCL-w and BCL2A1, which act by binding to pro-apoptotic proteins keeping them in an inactive form (Brenner & Mak 2009).
The balance between the pro-apoptotic and anti-apoptotic proteins has a key role in determining whether the cell undergoes apoptosis or not.
Chapter 1. Introduction
Ana Marta Silva | Role of mitochondrial p66Shc in nefazodone-induced mitochondrial toxicity on HepG2 cells 8 Figure 3: Extrinsic and intrinsic apoptotic pathways.The extrinsic apoptotic pathway (A) is triggered in response to the binding of extracellular signalling proteins to cell surface death receptors, such as Fas, TNFR or TRAIL receptors. These transmembrane proteins are formed by three domains: an extracellular ligand-binding domain, a transmembrane domain and an intracellular death domain, involved in the progression of the apoptotic process. The receptors and the ligands are both homotrimers and structurally related. The binding of Fas receptor to FASL, stimulates receptor trimerization and the recruitment of the adaptor protein Fas-associated death domain (FADD) and caspase-8. These elements form the death DISC complex, responsible for the autoactivation of initiator caspase-8 which in turn results in the initiation of a caspases cascade, which included the activation of executioner caspases-3, -6 and -7, downstream effectors of the cell death program (Ashkenazi & Dixit 1998; Nagata et al. 1995; Jin & El-deiry 2005) . The intrinsic apoptotic pathway (B) can be activated in the presence of an intrinsic signal, such as DNA damage, cytotoxic stress, cytokine deprivation, viral infection or growth-factor deprivation (Elmore 2007; Parsons & Green 2010). In the presence of apoptotic stimulus, the proteins BAX and BAK form oligomers on the OMM, allowing the release of cyt c and other pro-apoptotic proteins from the intermembrane space to cytosol (Brenner & Mak 2009). The mechanism by which this release occurs remains unclear. Once in the cytosol, cyt c forms a complex with Apaf-1 and caspase 9, known as “apoptossome”, where the pro-caspase 9 is activated giving rise to pro-caspase-9. This process initiates a cascade of pro-caspases, resulting in the activation of -3, -6 and -7 caspases (Zou et al. 1999). As a consequence of caspases activation, the apoptotic process is promoted through protein cleavage. Nuclear lamins (Lazebnik et al. 1995), retinoblastoma (Janicke et al. 1996) and DNA dependent protein kinase (Casciola-Rosen et al. 1996) are some of the target proteins cleaved by caspases. t-BID, a BH3-only protein, is responsible for connecting the extrinsic and intrinsic apoptotic pathways. When the extrinsic pathway is triggered, caspase-8 cleaves BID protein, generating a truncated form, BID, that is translocated to mitochondria. In mitochondria, t-BID inhibits BCL-2 anti-apoptotic proteins and promotes the agregation of BAX and BAK pro-apoptotic proteins on the OMM and the consequent release of cyt c (Li et al. 1998). This interaction between the two apoptotic pathways allows the death signal to be amplified (Adapted from Cooper 2012).
Chapter 1. Introduction
Ana Marta Silva | Role of mitochondrial p66Shc in nefazodone-induced mitochondrial toxicity on HepG2 cells 9
1.4. p66Shc in ROS Generation and Cell Death
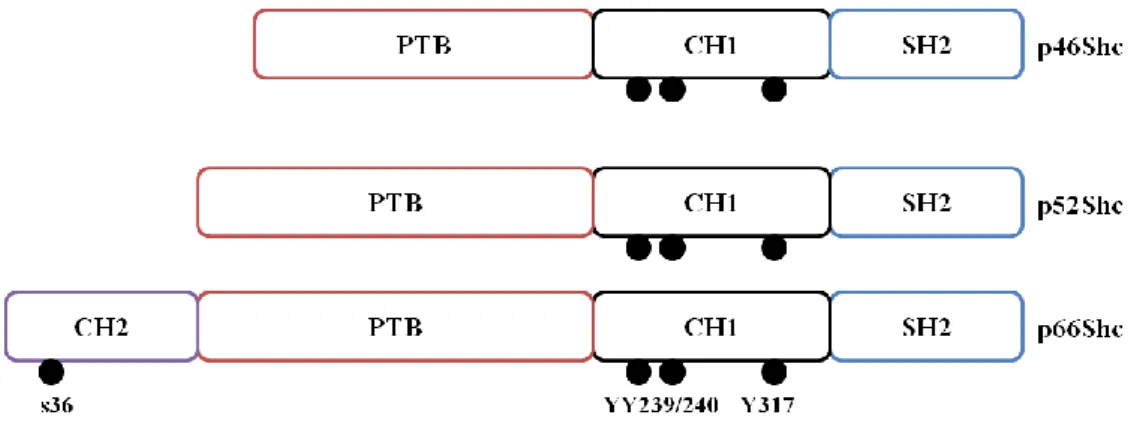
p66Shc protein belongs to Src homolog and collagen homolog protein (Shc) family, that are adapter proteins with a typical domain organization: a phosphotyrosine binding domain (PTB), a collagen homology 1 (CH1) region, and an Src homology 2 (SH2) domain
(Migliaccio et al. 1997) (Fig.4). Besides these three domains, p66Shc also presents an additional N-terminal proline-rich CH2 domain, with a serine residue at position 36, that is phosphorylated after a cellular stress stimulus, as explained below (Migliaccio et al. 1997, 1999).
Mammalian Shc locus encodes for three different adaptor proteins: p66Shc, p52Shc and p46Shc (Cosentino et al. 2008). While p52Shc and p46Shc induce the Ras signaling pathway, p66Shc, which is mainly expressed in epithelia (Veeramani et al. 2012), acts as a redox enzyme, taking part in mitochondrial ROS generation and translation of oxidative signals into apoptosis (Bonfini et al. 1996; Cosentino et al. 2008).
Figure 4: Schematic organization of SHC1 protein isoforms. p46Shc, p52Shc and p66Shc share a similar structure, with a Src homoly domain 2 (SH2), a collagen homology domain 1 (CH1) and a phosphothyrosine binding domain (PTB). p66Shc has another collagen homogy domain (CH2), binding to its PTB domain, with a Serine 36 (s36), represented as a black dot. This serine is phosphorylated in reaction to oxidative damage. Black dots on CH1 domain from the three isoforms represent major tyrosine-phosphorylation sites (YY 239/240; YY317) (Adapted from Luzi et al. 2000).
One of the hypothesis that explains the role of p66Shc in ROS generation and cell death suggests that in the presence of oxidative stress signals, cytoplasmatic p66Shc is translocated to mitochondria (Orsini et al. 2004; Giorgio et al. 2005), due to an interaction with TOM/TIM import complexes and mtHsp70. Once in mitochondria, p66Shc associates
Chapter 1. Introduction
Ana Marta Silva | Role of mitochondrial p66Shc in nefazodone-induced mitochondrial toxicity on HepG2 cells 10
with cyt c, acting as an oxidoreductase allowing ROS generation (Giorgio et al. 2005). The mechanisms by which ROS lead to apoptosis are related to the permeability transition pore (PTP) induction, and involve oxidation-dependent mechanisms (Petronilli et al. 1994; Danial & Korsmeyer 2004). According to this model, PTP opening increases inner membrane permeability to ions and solutes, followed by a consequent water influx into the mitochondrial matrix. This water entrance can cause the swelling of the organelle and the physical rupture of its outer membrane, resulting in the release of proteins of the intermembrane space, including cyt c, (Lindsten et al. 2011) previously described as an apoptotic factor.
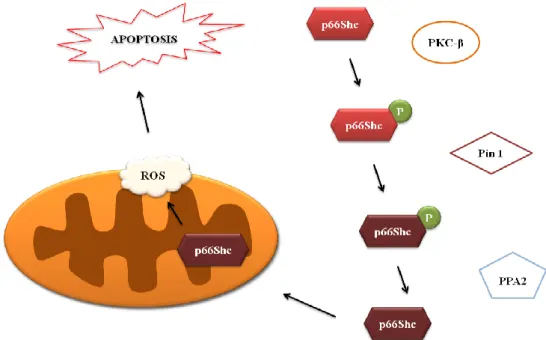
As mentioned above, p66Shc is translocated from cytoplasm to mitochondria. The mechanism underlying its entrance to mitochondria involves a set of steps and proteins (Fig.5). Firstly, protein kinase C beta (PKC-β) induces p66Shc phosporylation on Ser 36 (Pinton et al. 2007), which is then recognized by Prolyl isomerase 1 (Pin1) that catalyzes its cis-trans isomeration. After that, serine 36-phosphorylated p66Shc undergoes dephosphorylation by type 2 protein serine/threonine phosphatase (PP2A), and enters to mitochondria. In mitochondria, p66Shc binds to cyt c and acts as an oxidoreductase, shuttling electrons from cyt c to molecular oxygen and increasing ROS levels (Raffaello & Rizzuto 2011).
Figure 5: p66Shc-dependent ROS increase. In the presence of oxidative stress signals, such as ROS or Ca2+, p66Shc is phosphorylated on Ser36 by activated PKC-β. Serine 36-phosphorylated p66Shc, is then recognized by Pin1, an enzyme involved in its cis-trans isomeration. After that, Serine 36-phosphorylated p66Shc undergoes dephosphorylation catalyzed by PP2A, and enters mitochondria. Once inside mitochondria, p66shc binds to cyt c, leading to its oxidorreductase activity (Adapted from Raffaello & Rizzuto 2011).
Chapter 1. Introduction
Ana Marta Silva | Role of mitochondrial p66Shc in nefazodone-induced mitochondrial toxicity on HepG2 cells 11
Several authors validated this p66Shc signalling pathway. Giorgio et al. (2005) developed a detailed work focused on the study of different aspects of this pathway. Data obtained suggest that p66Shc can directly stimulate mitochondrial ROS generation. The same work also strongly supports the occurence of electron transfer between cyt c and p66Shc, supporting the action of p66Shc as oxidorreductase. The influence of p66Shc on the permability transition and mitochondria sweeling was also explored in this work, with data suggesting that p66Shc can induce mitochondria swelling.
Pacini et al. (2004) verified that over-expression of p66Shc promoted apoptosis on mouse splenic T-cells exposed to different apoptotic stimulus such as H2O2, calcium
ionophore A23187 or Fas ligation.
The mechanism proposed for p66Shc in the regulation of ROS generation and cell death is also important to understand the aging process. In 1956, Harnan suggested aging and associated degenerative diseases as a result of free radicals effects on different cell components (Harman 1956). Based on this idea, Migliaccio et al. (1999) performed a study suggesting p66Shc as having an important role in the response to a situation of oxidative stress and in the regulation of lifespan. The author performed experiments using p66shc-/- mice exposed to paraquat (an agent that generates superoxide anion), showing an increase on life span when compared to wild-type mice exposed to the same agent. The same author also observed an increase on p66shc-/- mouse embryo fibroblasts (MEFs) survival when exposed to H2O2 and UV radiation, comparatively to wild-type MEFs. These data support the idea of
p66Shc as having a central role on the apoptotic response to oxidative damage and also in the regulation of aging process.
Chapter 1. Introduction
Ana Marta Silva | Role of mitochondrial p66Shc in nefazodone-induced mitochondrial toxicity on HepG2 cells 12
1.5. HepG2 cells as a model to study NEF-induced Hepatotoxicity
The human hepatocellular carcinoma (HepG2) cell line (Fig.6) has been commonly used in several studies, due to the ability to keeping a similar cellular function to normal hepatocytes. This cell line exhibits several features similar to those found in normal hepatocytes, such as the ability to synthesize and secrete plasma proteins and the expression of cell surface receptors found in normal hepatocytes, previously described in several works (Roe et al. 1993; Dehn et al. 2004).
The use of HepG2 cell line can also be justified due to its high degree of morphological and functional differentiation in vitro, that makes this cell line a proper model for intracellular trafficking, hepatocarcinogenesis, and drug targeting studies in vitro (van IJzendoorn & Hoekstra 2000). The cytotoxic effect of NEF on HepG2 cells was already verified by Dykens et al. (2008), showing that the exposure of HepG2 cells to high concentrations of NEF, serious compromise ATP generation, leading to a depletion of ATP. The same work also revealed that HepG2 cells exposed to NEF have decreased on oxygen comsumption, followed by an increase on extra-cellular acidification rate (ECAR) (Dykens et al. 2008). Also, HepG2 cell line was already used by several authors as a model to evaluate other drugs cytotoxicity (Thabrew et al. 2005; Lin & Will 2012).
Figure 6: Confocal microscopy images of HepG2 cells labeled with Tetramethylrhodamine, methyl ester (TMRM) (red, mitochondria staining), LipidTOX (green, neutral lipid droplets staining) and Hoechst 33342 (blue, DNA staining). Images gently supplied by Dr. Paulo Oliveira.
Chapter 1. Introduction
Ana Marta Silva | Role of mitochondrial p66Shc in nefazodone-induced mitochondrial toxicity on HepG2 cells 13
1.6. Hypothesis
As previously mentioned, NEF hepatotoxicity led to the withdrawal of this drug from the market. In fact, its administration resulted in the occurence of several cases of liver injury, some of which led to the need of liver transplant or resulted in patients death (Aranda-Michel et al. 1999; Lucena et al. 1999). Experimental works have proved that NEF administration can interfere with normal mitochondrial function, through the alteration of OXPHOS complexes activity (Nadanaciva et al. 2007).
In the present work we hypothesize that the activation of p66Shc signaling pathway is involved in the toxicity induced by NEF. This approach, proposing a main role for p66Shc on NEF-induced cell hepatotoxicity has never been explored before.
This hypothesis, proposing a link between exposure to NEF and activation of the p66Shc signalling pathway, may be a valuable tool for researchers and clinicians, allowing to understand if exposure to a particular drug can lead to the establishment of mitochondrial and cellular stress. In order to achieve this, we investigate whether NEF leads to the activation of p66Shc signalling pathway in HepG2 cell line.
Chapter 2. Materials and Methods
Ana Marta Silva | Role of mitochondrial p66Shc in nefazodone-induced mitochondrial toxicity on HepG2 cells 15
2. Materials and Methods
2.1. Reagents
Reagents used in cell culture such as Fetal Bovine Serum (FBS; Catalog# 16000-044), trypsin-EDTA (Catalog# 25300-062), Penicillin-Streptomycin (Catalog# 15140-122), were purchased from Invitrogen (Carlsbad, CA, USA). Cell medium used was Dulbecco's Modified Eagle's Medium (DMEM, Catalog# D5648) and purchased from Sigma-Aldrich (St. Louis, MO, USA).
Reagents including Radio Immunoprecipitation Assay Buffer (RIPA buffer; #Catalog R0278), DL-dithiothreitol (DTT, #Catalog D9779), and Protease Inhibitor Cocktail (PIC, #Catalog P8340) were purchased from Sigma-Aldrich (St. Louis, MO, USA).
To determine protein content in samples used on Western-Blot technique, the Pierce BCA assay kit (Catalog# 23250) was purchased from Thermo Fisher Scientific (Lafayette, CO, USA). The primary antibodies also used on Western-Blot analysis are listed on table 1 (dilution, host and supplier) as well as the secondary antibody used,which was obtained from Santa Cruz Biotechnology (Heidelberg,Germany). The unicolor molecular weight standard (Catalog# MB176) was purchased from NZYTech (Lisbon, Portugal) and the non-fat dry milk (Catalog# 170-6404) used as a blotting-grade blocker was purchased from BioRad (Hercules, CA, USA). Additionally, 2x Laemmli Sample Buffer (Catalog# 161-0737) used to prepare samples for Western-Blot analysis was purchased from BioRad (Hercules, CA, USA). Ponceau S (Catalog# P3504), used to confirm equal amounts of protein was obtained from Sigma-Aldrich (St.Louis, MO, USA). Regarding caspases activity, caspases-3 (Catalog# 235400) and -9 substrates (Catalog# 218805) were purchased from Calbiochem (San Diego, CA, USA). pNA (Catalog# 185310) used to method calibration was obtained from Sigma-Aldrich (St. Louis, MO, USA). Bradford Reagent, used to quantify protein for caspases activity assay was also purchased from Sigma-Aldrich (St. Louis, MO,USA).
Fluorescence dyes including Tetramethylrhodamine, methyl ester (TMRM Catalog# T-668), MitoSOX Red (Catalog# M-36008), calcein acetoxymethyl ester (Calcein-AM;
Catalog# C1430), and Propidium Iodide (PI, #Catalog 21493), were purchased from
Invitrogen (Carlsbad, CA, USA). Hoechst 33342 (Catalog# B2261) was purchased from Sigma-Aldrich (St. Louis, MO, USA).
Chapter 2. Materials and Methods
Ana Marta Silva | Role of mitochondrial p66Shc in nefazodone-induced mitochondrial toxicity on HepG2 cells 16
The drug tested in the present work, nefazodone (NEF; Catalog# N5536) was obtained
from Sigma-Aldridch (St. Louis, MO, USA), which was prepared in Dimethyl sulfoxide, also
purchased from the same company (DMSO; Catalog# 34869) and kept refrigerated at a stock solution of 19.7 mM. Sulforhodamine B (SRB; Catalog# 9012) reagent was also purchased from Sigma-Aldridch (St. Louis, MO, USA).
2.2. Cell culture and treatment
The HepG2 cell line was kindly provided by Dr. Carlos Palmeira (Center for Neuroscience and Cell Biology, University of Coimbra). Cells were cultured in high glucose Dulbecco's Modified Eagle's Medium (DMEM). This medium was supplemented with 10% fetal bovine serum, 1 mM sodium pyruvate, 1.8 g/L sodium bicarbonate and 1% penicillin-streptomycin, in 60 cm2 tissue culture dishes at 37°C in a humidified atmosphere of 5% CO2.
2.3. Sulforhodamine B Colorimetric Assay
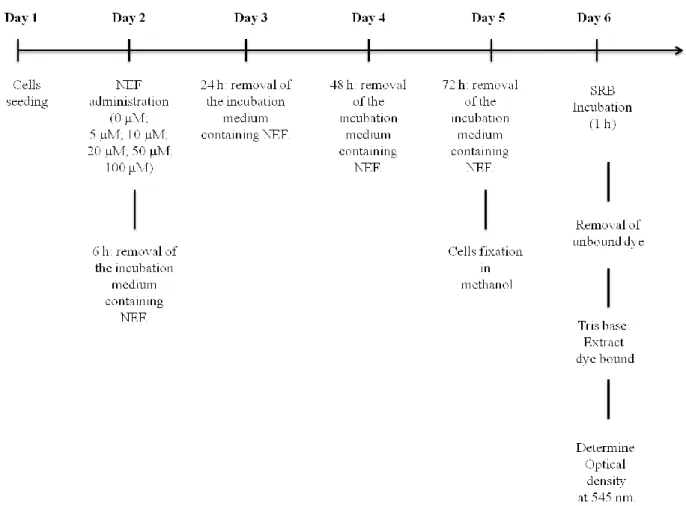
Sulforhodamine B colorimetric assay was introduced in 1990 by Skehan (Skehan et al. 1990) and it is based on the ability of SRB to bind to alkaline amino acids of cellular proteins (Papazisis et al. 1997). The pink dye binds to alkaline aminoacid residues under mild acidic conditions and dissociates under alkaline conditions. Through a colorimetric evalution, the assay allows the estimate of the total protein content, which is related to cell number (Papazisis et al. 1997; Longo-sorbello et al. 2006). This assay was performed in order to evaluate NEF cytotoxic effects on HepG2 cells with the main goal of chosing NEF working concentrations for further experiments. To perform this assay, HepG2 cells were seeded in 48 well plates at a desity of 2x10⁴ cells/well. After 24 h, incubation medium was removed and NEF was added in the following concentrations: 0 μM, 5 μM, 10 μM, 20 μM, 50 μM and 100 μM. Different exposure times to NEF were also tested: 0 h, 6 h, 24 h, 48 h and 72 h (Fig.7). A control was done using DMSO (always less than 0.1% v/v).
After the correspondent exposure time, NEF was removed and cells were fixed in 1% acetic acid in ice-cold methanol, for at least 24 h. Cells were then incubated with 0.5% (wt/vol) SRB in 1% of acetic acid for 1 h at 37°C. After the incubation period, the unbound
Chapter 2. Materials and Methods
Ana Marta Silva | Role of mitochondrial p66Shc in nefazodone-induced mitochondrial toxicity on HepG2 cells 17
dye was removed with 1% acetic acid solution. To extract dye bound to cell proteins, a solution of Tris base 10 mM, pH 10, was used. The optical density of the solution was determined at 545 nm, using VICTOR X3 plate reader (Perkin Elmer Inc.).
Figure 7: Experimental design for SRB assay. 24 hours after cell seeding, HepG2 cells were incubated with different concentrations of NEF for different time periods in order to evaluate NEF toxicity in this cell line.
2.4. Collection of total Extracts from HepG2 cells
Cells were seeded on 60 cm2 dishes at a density of 1.7x10⁶ cells/dish. Three different groups were considered to collect protein samples: control group (no NEF added), cells treated with 20 µM NEF and cells treated with 50 µM NEF. The three conditions were tested for two different exposure times, 48 h and 72 h.
Chapter 2. Materials and Methods
Ana Marta Silva | Role of mitochondrial p66Shc in nefazodone-induced mitochondrial toxicity on HepG2 cells 18
After treatment, total cellular extracts were collected according to the following procedure: cells were harvested using a scraper and applying a mixed solution of PBS and Ethylenediaminetetraacetic acid (PBS-EDTA). Two centrifugation steps were then performed for 3 minutes at 300xg. Cellular pellet was ressuspendeded in RIPA buffer (150 mM NaCl, 1.0% IGEPAL® CA-630, 0.5% sodium deoxycholate, 0.1% SDS, and 50 mM Tris, pH 8.0) supplemented with dithiothreitol (DTT) and protease inhibitor cocktail (PIC) according to manufacturers instructions. The cell suspension was stored at -80°C until used.
2.5. Determination of Protein Content for Western-Blot Analysis: Bicinchonic acid assay (BCA)
The protein content of each sample was determined using the bicinchonic acid assay (BCA). This colorimetric method was first introduced by Smith et al. (Smith et al. 1985) and is based on the biuret reaction (Sampson et al. 2013): under alkaline conditions, the protein residues bind and reduce copper ions from cupric ions (Cu2+) to cuprous ions (Cu1+). On a second step of this reaction, two molecules of BCA react with a cuprous ion, producing a purple-colored complex, whose absorbance can be read.
The method was used to evaluate the protein content from control cells, and cells treated with 20 µM and 50 µM NEF for 48 h and 72 h.
To perform this technique, previously collected samples were first sonicated and then diluted in ultrapure water (Merck Millipore, Germany) in a 1:20 dilution. After dilution, 5 µl of each sample, were transferred to a 96-well plate. Protein content was determined by BCA assay, using Bovine Serum Albumin (BSA) as a standard. The reaction was left to occur for 30 minutes at 37°C after which absorbance was read at 545 nm using VICTOR X3 plate reader (Perkin Elmer Inc.).
2.6. Western-Blot Analysis
After quantification, protein samples were then prepared in Laemmli Buffer and denatured at 95°C during 5 minutes. Then, equivalent amounts of proteins (20 μg) were separated by electrophoresis in 10% SDS-polyacrylamide gels (SDS-PAGE composição do gel). Casted gels were fitted in a Mini-PROTEAN 3 Cell (Bio-Rad) filled with running buffer
Chapter 2. Materials and Methods
Ana Marta Silva | Role of mitochondrial p66Shc in nefazodone-induced mitochondrial toxicity on HepG2 cells 19
(25mM Tris, 192mM glycine, 0.1% SDS) and connected to a PowerPac Basic Power Supply (Bio-Rad) outputting a constante voltage of 120V. Separation was carried out at room temperature and until the front of the run reached the bottom end of the gel. Note that in every gel, a molecular weight standard (NZYBlue Protein Marker, from NZYTech) was included to allow molecular weight estimation. After protein separation, transfer was performed to a thin surface layer of pre-activated (5 sec in 100% methanol followed by 5 min in distilled water
and 15 min in TBST) polyvinylidene difluoride membrane (PVDF, 0.45μm, Millipore,
Billerica, MA, USA). For that, gels were placed in a "transfer sandwich" (filter paper-gel-membrane-filter paper), in a system suported by a cassette. This sandwich system was placed in a Mini Trans-Blot Cell (Bio-Rad) tank between stainless steel/platinum wire electrodes and filled with transfer buffer (25mM Tris, 190mM glycine and 20% methanol). Protein transference was performed during 90 minutes at a constant voltage of 100 V. Membranes were then blocked in 5% milk in Tris-buffered saline Tween-20 (TBS-T; 154 mM NaCl, 50 mM Tris pH 8.0 (HCl) and 0.1% Tween-20) at 4 °C overnight and incubated with the primary antibodies (Table 1) overnight at 4°C under agitation. Membranes were washed with TBS-T and incubated with secondary antibodies (Table 1). Once incubation was finished, membranes were washed three times for 5 minutes each with TBS-T, a step followed by the incubation of membranes with Enhanced Chemi-Fluorescence (ECF) detection system (GE Healthcare, NJ, USA). Membrane imaging was performed using the UVP Biospectrum 500 Imaging System (UVP, Upland, CA, USA). To determine the intensity of each band the VisionWorksLS image aquisition and analysis software was used (UVP, Upland, CA, USA). In order to confirm that each lane was filled with an equal amount of protein, PVDF membranes were stained with Ponceau S (Sigma-Aldrich,St.Louis, MO, USA).
Chapter 2. Materials and Methods
Ana Marta Silva | Role of mitochondrial p66Shc in nefazodone-induced mitochondrial toxicity on HepG2 cells 20
Table 1: Primary and secondary antibodies used for Western Blotting experiments.
2.7. Flow cytometry
HepG2 cells were seeded on 20 cm2 dishes at a density of 5.7x10⁵/dish. The experimental groups considered on this assay were: control group, cells treated with either 20 µM or 50 µM NEF. These conditions were tested for two different exposure times: 48 h and 72 h.
On the day of the experiment, the culture medium was removed and cells were washed once with a solution of PBS 1x. Cells were then harvested by trypsinization, centrifuged and ressuspended around 500 µl of Hank's Balanced Salt Solution 1x (HBSS-1x), containing of Tetramethylrhodamine, methyl ester (TMRM) at a concentration of 150 nM. Incubation was performed during 30 minutes, in the dark, at 37°C under normal growth conditions. Samples were kept in the dark until used and 20,000 cells were analysed on a FACSCalibur flow cytometer (BD Biosciences, San Jose, California, USA) at a low sample flow rate.
TMRM is a cationic cell permeant and attending to its positive charge it will be accumulated by polarized mitochondria (more negative inside) and less accumulated by depolarized mitochondria. Through this principle, TMRM constitutes a useful tool to semi-quantify the inner mitochondrial membrane potential (Δψm), a component of proton motive force (Δp) (Perry et al. 2011).
Primary
Antibodies Diluition Host Species Gel (%) Supplier p66Shc 1:1000 Mouse 10 BD Biosciences
(#610879)
p66Shc-p (Ser 36) 1:1000 Mouse 10 Calbiochem (#566807)
Secondary
Antibodies Diluition Host Species Gel (%) Supplier Goat anti-mouse
IgG-AP 1:2500 Mouse 10
Santa Cruz Biotechnology
Chapter 2. Materials and Methods
Ana Marta Silva | Role of mitochondrial p66Shc in nefazodone-induced mitochondrial toxicity on HepG2 cells 21
2.8. Confocal microscopy
Cells were seeded on 60 cm2 dishes, at a density of 1.7x10⁶/dish. The experimental groups considered on this assay were: control group, cells treated 20 µM NEF and cells treated with 50 µM. The following conditions were tested for two different exposure times: 48 h and 72 h. Twenty-four hours before the different exposure times were finished, cells were transferred to from dishes to μ-Slide 8 well ibiTreat (ibidi Martinsried, Germany) at a density of 50,000 cells/well. The same experimental groups were maintained. Once treatment period was finished, cell culture medium was removed and cells were incubated with either a TMRM (150 nM) and Hoechst 33342 (1 mg/ml) fluorescent dyes or a mixture of Hoechst (1 mg/ml) and MitoSOX Red mitochondrial superoxide indicator, 5 µM (solutions were prepared on HBSS1x medium). Incubation was performed during 30 minutes at 37°C, protected from light. Cells were observed under a Zeiss LSM 510Meta confocal microscope. Images were obtained through LSM Image Browser. A Diode 405-30 laser (30 mW) at a 2% power was used for Hoechst 33342, while a DPSS 561-10 (15mW) laser was used for TMRM and MitoSOX, at a power of 1% and 2%, respectively. Emission filters BP420-480 and LP575 were used for collecting blue and red channel images, respectively. A EC Plan-Neofluar 40x/1.30 oil DIC lens was used to capture all the images, at a 512x512 pixels resolution. Pinhole was maintained at 74, for both channels. Image acquisition and image analysis was done at the MICC Imaging facility of CNC.
MitoSOX Red was used to evaluate superoxide anion generation in mitochondria from live cells. The use of this dihydroethidium derivative was described previously by several authors (Abramov et al. 2007; Pehar et al. 2007). The assay is based on the capacity of MitoSOX to enter mitochondria due to the presence of a positively charged phosphonium group in this fluorescent dye. Once oxidized by mitochondrial superoxide anion, MitoSOX exhibits red fluorescence (Robinson et al. 2006). In addition, Hoechst 33342, a fluorescent dye, was used to visualize the cell nucleus, due to its ability for binding to DNA (Arndt-Jovin & Jovin 1977;Weisenfeld 2007) .
Chapter 2. Materials and Methods
Ana Marta Silva | Role of mitochondrial p66Shc in nefazodone-induced mitochondrial toxicity on HepG2 cells 22
2.9. Calcein-AM and Propidium Iodide Assay
This assay performed by using Calcein-AM (CAM) and propidium iodide, was performed with the aim of assess cell viability. On intact cells, the active intracellullar esterases are capable to convert the non-fluorescent acetoxymethyl ester of calcein into a green fluorescent form (Neri et al. 2001). Due to the absence of harmful effects on cell function, CAM can be considered a good indicator of cell viability (Weston & Parish 1992).
Propidium iodide (PI) is able to permeate compromised plasma membranes on late apoptotic cells (Kroemer et al. 1998). After crossing cellular membranes, PI intercalates with nucleic acids, showing red fluorescence. In normal live cells, PI does not cross intact plasma membranes (Vermes et al. 1995). This method is quite commonly used to evaluate the viability of cells due to its efficiency. To perform this assay, cells were seeded on 20 cm2 dishes at a density of 5.7x10⁵ cells/dish and 24 h after seeding, cells were incubated with NEF at either 20 μM or 50 μM, for both 48h and 72 h. After the incubation periods, cells were harvested by trypsinization and centrifuged at 300xg for 3 minutes. This step was followed by incubation with CAM (final concentration: 0.1 µM) and PI (final concentration: 7.95 µM) for 15-20 minutes protected from light, at room temperature. Flow cytometry was preformed by runing 20,000 cells on a FACSCalibur flow cytometer (BD Biosciences, San Jose, California, USA) at a medium/high sample flow rate.
2.10. Caspases 3 and 9-like activities
Caspase-3 and -9-like activities were evaluated using total cellular extracts collected with the following conditions: control group, 20 μM NEF and 50 μM NEF. Similarly to the other assays, these NEF concentrations were tested for two different exposure times: 24 h and 48 h. After treatment, both floating and adherent cells were collected. Incubation media containing floating cells was centrifuged twice at 1,000xg during 5 minutes and cellular pellet was ressuspended in assay buffer (50 mM HEPES pH 7.4; 100 mM NaCl; 0.1% CHAPS; 10% glycerol; 10 mM DTT). Adherent cells were first washed with PBS 1X, a step followed by the application of 200 µl/dish of assay buffer. These cells were then harvested by scraping. Floating and adherent cells were then combined and cell lysis was performed through three cycles of freeze/thaw with liquid nitrogen/water bath and cellular extracts were then passed
Chapter 2. Materials and Methods
Ana Marta Silva | Role of mitochondrial p66Shc in nefazodone-induced mitochondrial toxicity on HepG2 cells 23
through a 27G needle (20-30 strocks). Then, cellular extracts were centrifuged at 14,000xg for 5 minutes and supernatants were transfered to new eppendorfs. Protein content of each sample was determined using the Bradford assay (Bradford 1976). This method is based on interactions between the Coomassie brilliant blue G-250 dye and basic amino acids residues. The dye exists in three different forms: cationic red dye, the neutral green dye and the anionic blue dye. The latter form binds to proteins, modifying the equilibrium between the three forms and leading to a prevalence of the anionic form. This results in a change in the absorbance peak of the dye solution (Chial & Splittgerber 1993;Redmile-Gordon et al. 2013). To perform quantification protein samples were diluted and 100 µl of each sample were transfered to a 96 well. Then, 100 µl of Bradford Reagent were added to each well. Reaction was left to occur during 5-10 minutes and absorbance was read at 595 nm using SpectraMax Plus 384 Microplate Reader (Molecular Devices, Silicon Valley,CA,USA). BSA was used as a standard.
After quantification,cellular extracts containing 25 μg and 50 μg of total protein were incubated with 5 μl of a substrate solution for either caspase-3 or -9 activity (final concentration: 100 μM) for two hours at 37°C. After incubation period, absorbance was read at 405 nm SpectraMax Plus 384 Microplate Reader (Molecular Devices, Silicon Valley, CA, USA).
The method used to evaluate caspase-3 and -9 activities is based on p-nitroanilide (pNA) chromophore detection, resulting from Ac-DEVED-pNA and Ac-LEHD-pNA cleavage. This assay was calibrated with known concentrations of p-nitroaniline (pNA) and the results were expressed as % pNA released.
2.11. Statistical Analysis
Data were expressed as means ± SEM for the number of experiments indicated in the legends of the figures. Grouped comparisons were performed using two-way analysis of variance (ANOVA). Multiple comparisons were performed using one-way ANOVA followed by Bonferroni post-hoc test or Dunnet's post-hoc test. Significance was accepted with p value <0.05.
Chapter 3. Results
Ana Marta Silva | Role of mitochondrial p66Shc in nefazodone-induced mitochondrial toxicity on HepG2 cells 25
3. Results
3.1. Nefazodone effects on HepG2 cell mass
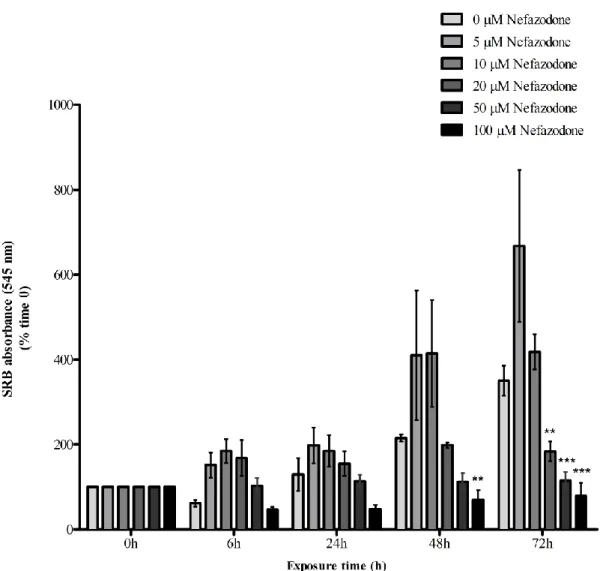
To investigate the effect of different NEF concentrations on HepG2 cells mass, we performed the SRB assay. Different concentrations of NEF were tested (0 µM, 5 µM, 10 µM, 20 µM, 50 µM and 100 µM) during different exposure times ( 0 h, 6 h, 24 h, 48 h and 72 h), as previously described on Section 2.3.
Figure 8: Effects of NEF treatment on HepG2 cell mass. Cell proliferation in the presence of different concentrations of NEF (0 µM, 5 µM, 10 µM, 20 µM, 50 µM and 100 µM) was evaluated durig different exposure times (0 h, 6 h, 24 h, 48 h and 72 h). Data show a significant decrease on cell proliferation after treatment with 100 µM for 48 h and 72 h. NEF treatment also led to a decrease in cell mass, when used in the concentrations of 20 µM and 50 µM, for 72 h. Data represent means ± SEM of five different experiments. **p<0.01 and ***p<0.001 vs control (two-way ANOVA, followed by Bonferroni post-test- comparisons to control, 0 µM).