Sanitation indicators: analysis of variables to construct
municipality indicators
Alyni Nomoto Nirazawa¹
Sonia Valle Walter Borges de Oliveira¹
¹ Universidade de São Paulo / Faculdade de Economia, Administração e Contabilidade de Ribeirão Preto, Departamento de Administração, Ribeirão Preto / SP — Brazil
After nine years of the Sanitation Law that defines the national guidelines in this area, it is still necessary to clarify the elements characterizing basic sanitation, and seek tools that enable monitoring sanitation in municipalities. Increasing international initiatives employ composite indicators to measure the performance of cities, compare them and use them to influence national and international political discussions. In this direction, the objective of this study is to analyze variables for the elaboration of sanitation indicators for the municipalities of São Paulo in order to generate information for the public administration. The method is based on thematic content analysis to understand the sanitation’s components and attributes, and factorial exploratory analysis to elaborate indicators. The results show three indicators that compose a municipal index and indicate the need for data to fully evaluate sanitation.
Keywords: sanitation; Sanitation Law; indicators; counties.
Indicadores de saneamento: uma análise de variáveis para elaboração de indicadores municipais Passados nove anos da Lei do Saneamento, que define as diretrizes nacionais, verifica-se a necessidade de integrar os componentes do conceito de saneamento básico e buscar meios para monitorar os municípios. Crescentes ini-ciativas internacionais utilizam indicadores compostos para mensurar o desempenho das cidades, compará-las e para influenciar discussões de políticas nacionais e internacionais. Nesse sentido, o objetivo foi analisar variáveis para elaboração de indicadores de saneamento básico para os municípios paulistas a fim de gerar informações para a administração pública. O método fundamenta-se na análise de conteúdo temática de documentos para compreender os componentes e atributos do saneamento; e na análise fatorial exploratória para elaboração dos indicadores. O resultado da análise originou três indicadores que compõem um índice municipal e indica a ne-cessidade de dados para avaliar de forma completa o saneamento.
Palavras-chave: saneamento básico; Lei do Saneamento; indicadores; municípios.
Indicadores de saneamiento: análisis de variables para construir indicadores municipales
Después de nueve años de Ley de Saneamiento, que establece las directrices nacionales, aun existe la necesidad de integrar el concepto de los componentes de saneamiento y buscar formas de controlar el saneamiento en los condados. Crecientes iniciativas internacionales utilizan indicadores compuestos para medir el desempeño de las ciudades, para compararlas y para influir en los debates de políticas nacionales e internacionales. En este sentido, el objetivo es analizar variables para la elaboración de indicadores de saneamiento para los municipios de São Paulo a fin de generar información para la administración pública. El método se basa en el análisis de contenido temático para entender los componentes y atributos del saneamiento; y análisis exploratorio factorial para elaborar indicadores. El análisis resultante arrojó tres indicadores que componen un índice municipal e indican la necesidad de datos para evaluar completamente el saneamiento.
Palabras clave: saneamiento; Ley de Saneamiento; indicadores; condados.
DOI: http://dx.doi.org/10.1590/0034-7612168118
Article received on August 19, 2016 and accepted on April 27, 2018.
[Translated version] Note: All quotes in English translated by this article’s translator.
1. INTRODUCTION
In Brazil there are roughly 3.3 million households without running water, which represents 6% of permanent households, according to the 2010 Census (IBGE, 2012). Only 55.5% of households have permanent sewage facilities and 11.6% have a septic tank. In relation to solid waste, roughly 80% is collected directly by sanitation services in permanent households. This data demonstrates the need for improvements in basic sanitation.
Internationally, Agenda 2030 reinforces the concern about sanitation by establishing “Objective 6 — Assuring the availability and sustainable management of water and sanitation for all,” of the United Nations.
Brazil, in turn, has the goal of universalizing access to sanitation services as a human right by 2030, according to the National Plan for Basic Sanitation (PlanSab) based on Law No 11,445/2007 —
the Sanitation Law (Brazil, 2007). To do this, it will be necessary to monitor the sanitation situation in municipalities to determine the dimensions of the effort and resources necessary.
By monitoring sanitation in the municipalities, public administration can plan specific actions, establish performance and quality metrics, and orient public policies. That’s why our objective is to analyze variables to elaborate basic sanitation indicators for the municipalities of the State of São Paulo based on the principles of the Sanitation Law. Since this is an explanatory study, our application focuses on a group of municipalities to evaluate the possibility of this type of usage.
2. METHODOLOGY
Our analysis of variables for the elaboration of composite basic sanitation indicators for the municipalities of the State of São Paulo uses a mixed approach. Qualitative research provides more profound research about a given situation (Cooper and Schindler, 2011), and this is why we have applied it in order to understand the components and attributes of sanitation. We’ve employed quantitative research on the other hand, to analyze variables for the elaboration of indicators that reflect the sanitary conditions of the municipalities in São Paulo. This is an applied study that uses data from the National Sanitation Information System (SNIS), which in the future will incorporate the National Basic Sanitation Information System (Sinisa) as envisioned by Law No 11,445/2007, and
the Municipal Basic Information Survey (Munic) of 2013.
The analysis of the variables used to elaborate the composite indicators for basic sanitation is based on the Handbook on constructing composite indicators (Giovannini et al., 2008) and the methodological issues concerning the construction of rankings discussed in the work of Meijering, Kern and Tobi (2014), according to box 1.
Our qualitative data was analyzed based on thematic content analysis according to Bardin (2011), applied to the document of Law No 11,445/2007 to define the breadth of the basic sanitation concept
and the concept of adequate basic sanitation, which support the formulation of the selection criteria for the variables (Step 2).
BOX 1 STEPS IN THE ELABORATION OF SANITATION INDICATORS
Steps Description
1. Definition of theoretical framework • Definition of the concept
• Breaking it down into attributes
2. Data selection
• Database and variable selection criteria • Variable characteristics
• Treatment of missing data
3. Multivariate analysis • Exploratory factor analysis
• Multiple linear regression
4. Normalization, weighting and aggregation
• Normalization of factor scores • Weighting of factor scores
• Aggregation of factor scores in an index
5. Grouping of municipalities • Classification of municipalities, according to defined groupings of cities
6. Visualization of results • Graphic representation of the sanitation classification results and the results
report
Source: Adapted from Giovannini and collaborators (2008) and Meijering, Kern and Tobi (2014).
Even though FA is generally just for metric variables, Hair and collaborators (2009) consider it acceptable to include a small number of dichotomic variables among the metric variables analyzed by factors. To accomplish this, we used 83 metric variables, and 9 dichotomic variables related to urban drainage which has a scarcity of data. In terms of the sample size, according to Hair and collaborators (2009), there need to be more observations than variables, with the minimum acceptable ratio being 5:1 and the ideal being 10:1. The sample consisted of 490 observations (the quantity of municipalities) and 92 variables, equivalent to a ratio of 5:1, the minimum acceptable as a general rule.
The municipalities selected for the analysis were those which possessed a majority of the information related to the four components of basic sanitation, this being a sample that conveniently represents 76.0% of the municipalities in the State of São Paulo.
For the FA, we used the IBM SPSS software version 23 for Bartlett’s test of sphericity, the Measure of Sampling Adequacy (MSA) and the Kaiser-Meyer-Olkin (KMO) test. After these tests, we used an octagonal rotation using the Varimax method to interpret the solution. Finally we tested for internal consistency by using Cronbach’s Alpha to verify if the individual items or indicators were measuring the same construct.
For the municipality groupings, we have adopted the city typology as suggested by Meijering, Kern and Tobi (2014), avoiding the comparison of municipalities that have different characteristics. The groupings realized by the municipality typology proposed by the National Habitation Plan synthesize 11 typologies of the 19 in the original study (realized by the Observatório Metrópoles), to emphasize the aspects relevant to habitation issues such as: metropolitan regions, income ranges, number of inhabitants, degree of urbanization, and GDP (Ministério das Cidades, 2009).
3. SANITATION INDICATORS
Within the international context, there is a growing utilization of performance indicators in the sanitation sector to monitor the providing of, regulation of, and planning of these services (Sperling and Sperling, 2013). From the point of view of public administration, the monitoring of data is important and necessary in order to accompany the progress of activities, improve the transparency of the accounting, and demonstrate results (Schwemlein, Cronk and Bartram, 2016).
According to Kern (2008 apud Meijering, Kern and Tobi, 2014), one tool that has often been used to influence national and international political discussions is the European green city rankings.
In Brazil, there are two relevant initiatives, the basic sanitation ranking of the 100 largest cities by the Instituto Trata Brasil (2016) and the Blue Green Municipal Program within the Environmental Secretariat of the State of São Paulo (São Paulo, 2016). There is also a sanitation ranking initiative that has been undertaken by the government of India. What these three rankings have in common is that they are based on indicators or indices that are applied to cities and that range in number from 12 to 70. However, there are no rankings or structured initiatives to elaborate Brazilian indicators that contemplate the components of basic sanitation according to Law No 11,445/2007 in order to
measure and monitor adequate sanitation.
4. RESULTS AND DISCUSSION: THE ELABORATION OF SANITATION INDICATORS
4.1 DEFINITION OF THE THEORETICAL FRAMEWORK
Thematic content analysis of the Sanitation Law confirmed four components: 1. the supply of water, 2. sewage networks, 3. urban solid waste and urban cleaning, 4. drainage and the management of rainwater. Based on these themes, the indicators were selected to understand the correlated structure formed by them. The concept of adequate sanitation was also defined through a thematic content analysis of the principles of the Sanitation Law, which have been grouped by these themes, forming the attributes of box 2.
Of the 16 attributes, the data selection managed to include only eight of them, and some of them only partially. This signifies that roughly 50% of the concept of adequate sanitation is represented. This is an estimate, because an attribute cannot always be measured by just one indicator.
the SNIS is still not able to furnish information about sanitation in the rural and peripheral areas discussed in the study conducted by Schneider and collaborators (2010).
BOX 2 ATTRIBUTES OF ADEQUATE SANITATION
Attributes of Adequate Sanitation Attributes Contemplated in the Ranking
1. Universalization of basic sanitation services Partially, does not include the rural population
2. Completeness
-3. Adequate public health services
-4. Adequate environmental protection services
-5. Methods, techniques and processes that consider regional and
local characteristics
-6. Articulation with policies that handle urban and regional development, habitation, the fight against poverty,
environmental protection, and the promotion of health and social interests
-7. Efficiency Partially, with the exception of urban drainage
8. Economic sustainability Partially, with the exception of urban drainage
9. Appropriate technologies
-10. Transparency Partially, not all municipalities provide information to the
SNIS
11. Social control Yes
12. Security Partially for urban drainage and it just reports the
occurrence of flooding
13. Quality Partially, for the urban supply of water, sewage and
drainage
14. Regularity Yes
15. Integration of infrastructure and services with efficient
management of water resources
-16. Measures to encourage moderation in water consumption
4.2 MULTIVARIATE ANALYSIS
The objectives of the FA were: to understand whether the sanitation indicators can be “grouped” according to the components cited by the Sanitation Law and summarized by the characteristics of sanitation. To summarize these characteristics, we applied factor analysis using R, which analyzes a group of variables to identify its latent dimensions.
The verification of the conceptual and statistical fit of the sample variables was performed using Bartlett’s test for sphericity which examines the entire correlation matrix for the presence of correlations between variables, and the result for a significance of < 0.001, X2(45) = 15141.823, indicates that there
is a sufficient correlation between the variables. The Measure of Sampling Adequacy (MSA) had values for general and individual MSA over 0.5. The Kaiser-Meyer-Olkin (KMO) test indicated the adequacy of the sample size, and with a value of 0.857, it was considered good. The correlation matrix analysis considered only values above 0.5 times the diagonal of the anti-image correlation matrix.
The criteria for the extraction of the number of factors was the latent root, with only eigenvalues greater than 1 being considered significant, which resulted in three factors or latent dimensions: the coverage of water supply, sewage and solid waste services (WSW Coverage) which explains 60.6% of the variance; efficiency in the distribution of water (W Efficiency) which explains 21.1%; and urban drainage efficiency (D Efficiency) which explains 11.6%. In total, the factors explain 93.4% of the variance.
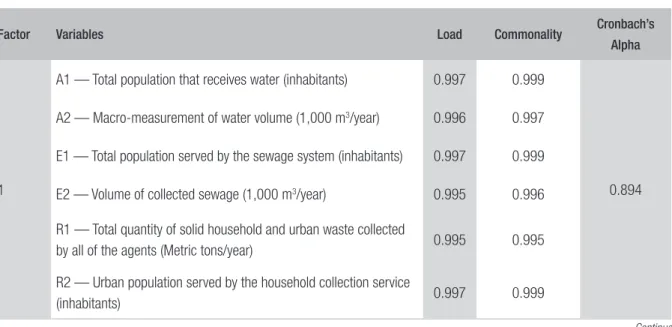
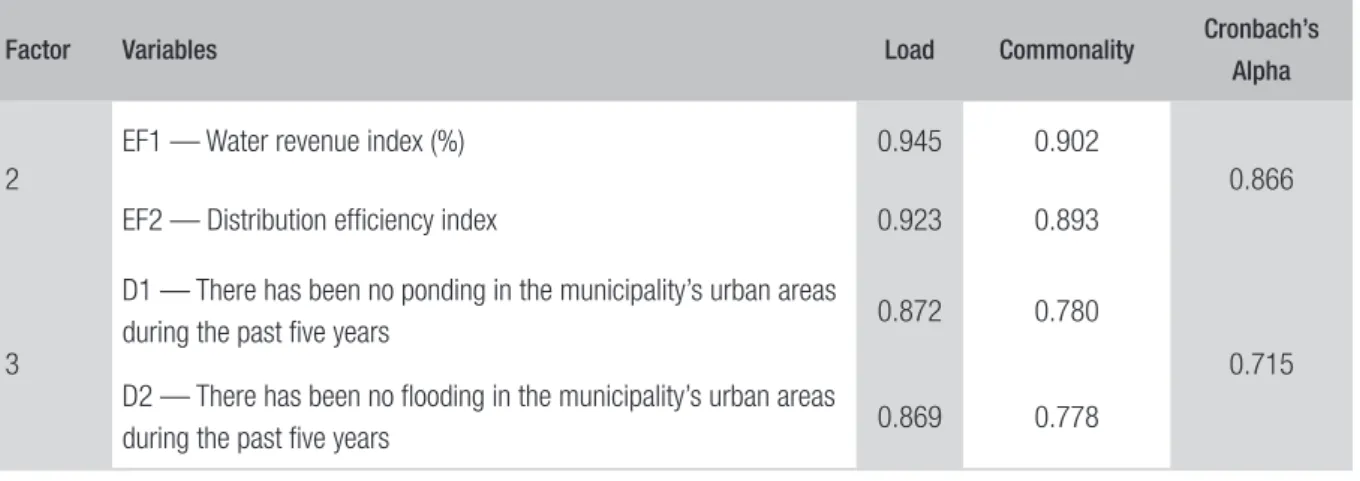
The factor loads are the correlations of each variable with the factor, the lowest load being 0.869 and the largest being 0.997. The rotated solution presented in Table 3 resulted in three factors which are denominated as Factor 1 — WSW Coverage; Factor 2 — W Efficiency; and Factor 3 — D Efficiency.
The degree to which the results can be generalized was tested by dividing the sample randomly into two sub-samples and the results of the Varimax rotation loads, the commonalities, and the factor structure proved to be stable, because there was no representative load of the variable in other factors.
Table 1 shows the Cronbach’s Alpha values for each factor as well as the factor loads and communality for each variable.
TABLE 1 SANITATION FACTOR ANALYSIS
Factor Variables Load Commonality Cronbach’s
Alpha
1
A1 — Total population that receives water (inhabitants) 0.997 0.999
0.894
A2 — Macro-measurement of water volume (1,000 m3/year) 0.996 0.997
E1 — Total population served by the sewage system (inhabitants) 0.997 0.999
E2 — Volume of collected sewage (1,000 m3/year) 0.995 0.996
R1 — Total quantity of solid household and urban waste collected
by all of the agents (Metric tons/year) 0.995 0.995
R2 — Urban population served by the household collection service
Factor Variables Load Commonality Cronbach’s Alpha
2
EF1 — Water revenue index (%) 0.945 0.902
0.866
EF2 — Distribution efficiency index 0.923 0.893
3
D1 — There has been no ponding in the municipality’s urban areas
during the past five years 0.872 0.780
0.715
D2 — There has been no flooding in the municipality’s urban areas
during the past five years 0.869 0.778
Source: Elaborated by the authors.
To create the Municipal Basic Sanitation Index (MBSI) we used the factor scores resulting from FA, which were measurements composed of each factor computed for each municipality.
4.3 NORMALIZATION, WEIGHTING AND AGGREGATION
To aggregate the factor scores by geometric average, we had to normalize the factor scores to avoid negative values. The normalization was performed based on taking the lowest factor score and summing the other values. In addition, it was necessary to differentiate the value of zero, to not arrive at a geometric value of zero, by considering the value closest to zero.
In terms of the weighting, in FA the weighting intervenes to correct the overlapping of information between two or more correlated indicators and does not measure the theoretical importance associated with the indicator (Giovannini et al., 2008). In this sense, different weights were not attributed due to theoretical importance; equal weights were considered for all of the factors.
In terms of the aggregation of the factors, we opted for the geometric average due to facility of applying it and to reduce, at least partially, the problem of it being a compensatory technique.
4.4 GROUPING OF MUNICIPALITIES
The typologies of the municipalities of the State of São Paulo were composed of nine different typologies subdivided into subgroups: municipalities of metropolitan regions and those above 100 thousand inhabitants (A, B, D); those between 20 and 100 thousand inhabitants (F, G, H); and those with less than 20 thousand inhabitants (I, J, K) (Ministério das Cidades, 2009).
Table 2 shows the quantities of the state municipalities and their respective typologies as well as those of the sample.
It may be noted that the municipalities not included in the analysis due to a lack of data did not significantly affect the representativeness of the sample, given that the proportions were maintained. Only Profile I had a large reduction in representativeness.
TABLE 2 TYPOLOGIES OF THE POPULATION AND THE SAMPLE
PROFILE
Population Sample
No data Municipalities % TOTAL Municipalities % SAMPLE
I 94 356 55% 262 41%
F 27 127 20% 100 16%
A 14 39 6% 25 4%
K 7 33 5% 26 4%
B 1 29 4% 28 4%
D 2 28 4% 26 4%
J 5 16 2% 11 2%
G 3 15 2% 12 2%
H 2 2 0% 0 0%
Total 155 645 100% 490 100%
Source: Elaborated by the authors.
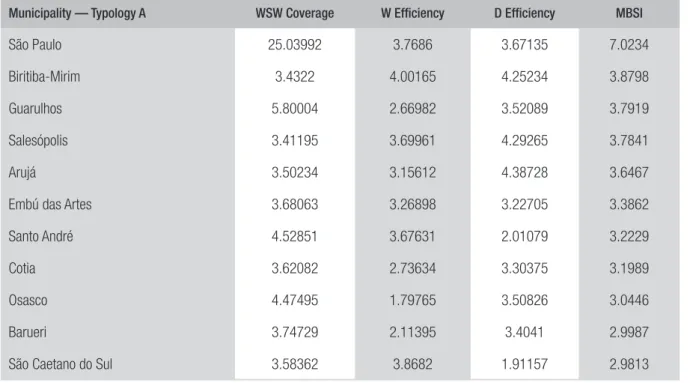
TABLE 3 SANITATION VARIABLE ANALYSIS — TYPOLOGY A
Municipality — Typology A WSW Coverage W Efficiency D Efficiency MBSI
São Paulo 25.03992 3.7686 3.67135 7.0234
Biritiba-Mirim 3.4322 4.00165 4.25234 3.8798
Guarulhos 5.80004 2.66982 3.52089 3.7919
Salesópolis 3.41195 3.69961 4.29265 3.7841
Arujá 3.50234 3.15612 4.38728 3.6467
Embú das Artes 3.68063 3.26898 3.22705 3.3862
Santo André 4.52851 3.67631 2.01079 3.2229
Cotia 3.62082 2.73634 3.30375 3.1989
Osasco 4.47495 1.79765 3.50826 3.0446
Barueri 3.74729 2.11395 3.4041 2.9987
Municipality — Typology A WSW Coverage W Efficiency D Efficiency MBSI
São Bernardo do Campo 4.65714 2.63461 2.15013 2.9769
Taboão da Serra 3.69111 3.16375 1.99171 2.8545
Franco da Rocha 3.42172 3.33423 1.94842 2.8117
Ferraz de Vasconcelos 3.49125 3.19735 1.96725 2.8003
Santana de Parnaíba 3.39886 3.27991 1.95534 2.7934
Guararema 3.26434 3.39107 1.91769 2.7689
Poá 3.43911 3.11817 1.977 2.7677
Ribeirão Pires 3.3945 2.92626 2.00142 2.7090
Diadema 3.90873 2.30357 2.14602 2.6834
Cajamar 3.32411 2.78553 2.00996 2.6501
Mauá 3.7572 2.29761 2.11166 2.6318
Itapevi 3.51941 2.23532 2.10189 2.5477
Itapecerica da Serra 3.36446 2.28933 2.08015 2.5210
Mogi das Cruzes 3.87615 1.59118 2.23031 2.3960
Source: Elaborated by the authors.
In general, the MBSI values for municipalities are very close to each other. This can be attributed to the fact that municipalities in the State of São Paulo have very similar levels of service, especially in terms of WSW Coverage which for most municipalities has a value close to 3. However, in terms of the indicators W Efficiency and D Efficiency, more differences emerge among these municipalities.
The strong points of the elaborated sanitation indicators are: their capacity to classify municipalities in a quantitative manner, making it possible to make comparisons based on typologies considering characteristics in common, that they make it possible to visualize their values by dimension (WSW Coverage, W Efficiency, D Efficiency), and that they provide a measure that unites various aspects of adequate sanitation. The points that need to be improved have to do with the typology of the City of São Paulo which could be compared to other metropolises in other states, and the need to perform FA to obtain the factor scores with all of the data.
4.5 VISUALIZATION OF THE RESULTS
In Graph 1 we have an example of the representation of the results for each municipality, with references such as the point total, the lowest and highest point totals for each of the municipalities in the profile, and the points for each of the dimensions/factors.
GRAPH 1 MUNICIPAL BASIC SANITATION INDEX — RIBEIRÃO PRETO (SP)
Source: Elaborated by the authors.
5. FINAL CONSIDERATIONS
This study demonstrates the need for data to evaluate sanitation in a complete manner, considering the concept of adequate sanitation. Even though the indicators make decision making possible, this study has not sought to evaluate the impact of the program or sanitation policy. In terms of its contributions, this study offers: the understanding of this database with sanitation information, the understanding of the relevance of sanitation indicators, the structure of sanitation information through exploratory factor analysis which has yielded factors (new sanitation dimensions), the selection of variables with a great weight of information, and the classification of municipalities in the State of São Paulo in terms of adequate sanitation.
In terms of limitations, we can cite the lack of available data for all of the municipalities, the reliability of the collected data, the difficulty of integrating information from various databases, the manner of comparing municipalities based on profiles, and the aggregation of data which has the limitation of using a compensatory method, even though this was only used to a partial extent.
REFERENCES
BARDIN, Laurence. Análise de conteúdo. São Paulo: Almedina, 2011.
BRAZIL. Lei no 11.445, de 5 de janeiro de 2007. Estabelece diretrizes nacionais para o saneamento básico. Diário Oficial da União, 8 jan. 2007. Available at: <www.planalto.gov.br/ccivil_03/_ato2007-2010/2007/lei/l11445.htm>. Acessed on: 2 June 2016.
COOPER, Donald R.; SCHINDLER, Pamela S. Métodos de pesquisa em administração. 10. ed. Porto Alegre: Bookman, 2011.
CORRAR, Luiz J.; PAULO, Edilson; DIAS FILHO, José Maria (Coord.). Análise multivariada para os cursos de administração, ciências contábeis e economia. São Paulo: Atlas, 2012.
GIOVANNINI, Enrico et al. Handbook on
constructing composite indicators: methodology
and user guide. Paris: Organisation for Economic Co-operation and Development (OECD), 2008.
HAIR, Joseph F. et al. Análise multivariada de dados. 6. ed. Porto Alegre: Bookman, 2009.
IBGE. Censo demográfico 2010. Características urbanísticas dos entornos dos municípios. Rio de Janeiro, 2012. Available at: <http://biblioteca.ibge. gov.br/biblioteca-catalogo?view=detalhes&id=796>. Acessed on: 18 June 2016.
KUMAR, Abhimanyu; TAUNK, Anshu. A study of sanitation of toilets in elementary and senior Secondary schools located in rural areas of Uttarakhand state in India. International Journal of Sociology and Anthropology, v. 2, n. 8, p. 178-184, 2010.
MEIJERING, Jurian V.; KERN, Kristine; TOBI, Hilde. Identifying the methodological characteristics of
European green city rankings. Ecological Indicators, v. 43, p. 132-142, 2014.
MINISTÉRIO DAS CIDADES. Secretaria Nacional de Habitação. Plano nacional de habitação. Brasília: Ministério das Cidades, 2009. Available at: <www.sst. sc.gov.br/arquivos/id_submenu/230/publiicacao_ planhab_capa.pdf>. Acessed on: 19 Aug. 2016.
PATIL, Sumeet R. et al. The effect of India’s total sanitation campaign on defecation behaviors and child health in rural Madhya Pradesh: a cluster randomized controlled trial. Plos Medicine, v. 11, n.8, p. 1-17, 2014.
SÃO PAULO. Secretaria do Meio Ambiente. Município VerdeAzul. Available at: <www.ambiente. sp.gov.br/municipioverdeazul/>. Acessed on: 19 Aug. 2016.
SCHNEIDER, Danieli, D. et al. Indicadores para serviços de abastecimento de água e esgotamento sanitário voltados às populações vulneráveis. Revista Brasileira de Ciências Ambientais, v. 17, p. 65-76, 2010.
SCHWEMLEIN, Stefanie; CRONK, Ryan; BARTRAM, Jamie. Indicators for monitoring water, sanitation, and hygiene: a systematic review of indicator selection methods. International Journal of Environmental Research and Public Health, v. 13, n. 333, p. 1-15, 2016.
SPERLING, Tiago L. von; SPERLING, Marcos von. Proposição de um sistema de indicadores de desempenho para avaliação da qualidade dos serviços de esgotamento sanitário. Engenharia Sanitária e Ambiental, Rio de Janeiro, v. 18, n. 4, p. 313-322, 2013.
TRATA BRASIL. Available at: <www.tratabrasil.org. br/>. Acessed on: 19 Aug. 2016.
Alyni Nomoto Nirazawa
Masters in Organization Administration. E-mail: alyninn@gmail.com.
Sonia Valle Walter Borges de Oliveira