Bárbara Daniela da Costa Ferreira
Resilience of concrete structures
in the marine environment through
microstructural innovation
Bárbara Daniela da Costa Ferreira
dezembro de 2015 UMinho | 2015 R esilience of concr e te s tr uctur es in t he mar ine en vir onment t hr ough micr os tr uctur al inno vation
Escola de Engenharia
dezembro de 2015
Dissertação de Mestrado
Ciclo de Estudos Integrados Conducentes ao
Grau de Mestre em Engenharia Civil
Trabalho efectuado sob a orientação do
Professor Doutor Eduardo Nuno Borges Pereira
Professor Doutor Vítor Manuel Couto Fernandes Cunha
Bárbara Daniela da Costa Ferreira
Resilience of concrete structures
in the marine environment through
microstructural innovation
1
ACKNOWLEDGEMENTS
This dissertation would not have been possible without the help of so many people in so many ways.
I would like to express my sincere appreciation to my Principal Supervisor, Doctor Eduardo Pereira and Co-supervisor, Doctor Vítor Cunha, for their constant guidance and encouragement, without which this work would not have been possible. For their unwavering support. I am truly grateful.
One special thanks to PhD student João Almeida for is support, advices, guidance, valuable comments and suggestions and for help in the experimental research. Without is precious help this work would not be possible!
I want to thank to all of the companies that provided the materials used in this research: Secil, Civitest, Sika, Fibraflex and Eurocálcio – Calcários e Inertes SA.
I would like to thank my friends, and colleagues at the University of Minho for their encouragement and moral support over those five years, in particular to: Cátia Machado, Joana Machado, José Pereira, Bárbara Pereira, Ana Paula Carvalho, Ana Ribeiro, Elisabete Teixeira and Andreia Martins. We had our funny times!
Lastly, and most of all, I would like to thank my family, who has been a source of encouragement and inspiration to me throughout my life.
3
ABSTRACT
Marine environment is one of the most challenging environments for concrete structures. Structural concrete exposed to marine environment deserves special attention as the sea salts chemically react with the cement matrix which results in loss of strength, cracking, spalling etc. In the present work, the behaviour of two different composites were study: Engineered Cementitious Composites (ECC) and another one based on an Alternative Binder System. A series of experiments, including compressive testing and uniaxial tension were carried out to characterize the mechanical properties of both types of materials. The single crack tension test was performed in the ECC compositions to assess the influence of the type of water used in the composition, at the micromechanical level. The most important characteristic of ECC, multi-cracking behaviour at increasing tensile strains when subject to direct tension, was confirmed in all mixtures and in all types of cures. Self-healing ability was studyed in ECC mixtures and the results showed that is possible verify that the specimens subjected to lower preloading levels and cured in the same water used to prepare the mixtures have almost fully recovered their initial mechanical characteristics. In the metakaolin based geopolymer, as an alternative binder system, the strain hardening behaviour was reached with one mixture.
The geopolymer material is a more sustainable option due to the utilization of by-products and / or wastes materials when compared to the cementitious matrix composite.
Keywords: Durability, Engineered Cementitious Composites, Strain Hardening Behaviour, Self-healing, Geopolymer
4
RESUMO
O ambiente marítimo é um dos mais desafiadores para as estruturas de betão. Betão armado exposto, ao ambiente marítimo, merece especial atenção devido á presença de sais do mar que reagem com matriz de cimento o que resulta em perda de resistência, fendas, fragmentação, entre outros problemas.
Este trabalho consiste no estudo do comportamento mecânico de dois compósitos diferentes: um compósito de matriz cimentícia com endurecimento em tração e um material alternativo de matriz não cimentícia. Os testes de compressão e tensão uniaxial foram realizados de modo a avaliar as propriedades mecânicas dos dois compósitos. Os resultados demonstraram que é possível o aparecimento de múltiplas fendas com o aumento da carga de tração em todas as misturas e em todos os tipos de curas. A capacidade de self-healing de materiais compósitos com endurecimento em tração foi estudado nos compósitos de matriz comentícia e os resultados mostraram que é possível concluir que as amostras submetidas a baixos níveis de pré-carga, curadas na mesma água utilizada para preparar as misturas, tenham recuperado quase totalmente as suas características mecânicas iniciais. O endurecimento à tração também foi obtido por uma mistura de geopolímero que é um material alternativo ao cimento Portland.
O geopolímero é uma opção mais sustentável devido à utilização de sub-produtos e/ou resíduos quando comparado com o compósito de matriz cimentícia
Palavras-chave: Durabilidade, Compósito de Matriz Cimentícia; Endurecimento em Tração, Geopolímero,
5 Table of Contents ACKNOWLEDGEMENTS ... 1 ABSTRACT ... 3 RESUMO ... 4 CHAPTER 1 ... 19 Introduction ... 19 1.1 Foreword ... 19 1.2 Motivation ... 19
1.3 Scope and objectives ... 20
CHAPTER 2 ... 23
State Of Art ... 23
2.1 The oceans ... 23
2.1.1 Marine and offshore structures in the context of Climate Change ... 24
2.1.2 The marine environment ... 28
2.1.3 Durability of concrete structures in the marine environment ... 30
2.1.4 Strategies to improve the durability of reinforced concrete ... 36
2.2 Alternative Materials ... 37
2.3 Engineered Cementitious Composites (ECC) ... 38
2.4 Geopolymers ... 41
CHAPTER 3 ... 47
Mechanical Characterization ... 47
3.1 Materials and Compositions ... 48
3.1.1 Compositions ... 48 3.1.2 Mixing Procedure ... 49 3.1.3 Fresh Properties ... 50 3.1.4 Specimens ... 52 3.1.5 Curing environments ... 53 3.2 Mixture A ... 53 3.2.1 Compressive behaviour ... 53
6
3.2.2 Single Crack Tension Test (SCTT) ... 66
3.2.3 Tensile Stress-Strain Behaviour ... 72
3.3 Mixture B ... 82
3.3.1 Compressive behaviour ... 82
3.3.2 The Single Crack Tension Test (SCTT) ... 91
3.3.3 Tensile Stress-Strain Behaviour ... 95
3.4 Mixture C ... 101
3.4.1 Compressive behaviour ... 101
3.4.2 Single Crack Tension Test (SCTT) ... 109
3.4.3 Tensile Stress-Strain Behaviour ... 113
3.5 Influence of the mix composition ... 120
3.5.1 Air curing ... 120
3.5.2 Seawater curing ... 128
3.5.3 Tap water curing ... 136
3.5.4 Salted water curing... 144
3.6 Conclusions ... 151
CHAPTER 4 ... 153
Self-healing ... 153
4.1 Materials and Compositions... 154
4.2 Specimens and curing environments ... 154
4.3 Compressive behaviour of Mixtures B and C ... 154
4.4 Tensile behaviour of Mixture B ... 157
4.4.1 Pre-loading up to 0.75% of tensile strain ... 157
4.4.2 Pre-loading up to 1.5 % of tensile strain ... 160
4.5 Tensile behaviour of Mixture C ... 163
4.5.1 Pre-loading up to 0.75% of tensile strain ... 163
4.5.2 Pre-loading up to 1.5% of tensile strain ... 166
4.6 Digital image analysis and documentation of the cracking processes ... 169
4.7 Conclusions ... 186
7
Alternative Binder System ... 187
5.1 Materials and Compositions ... 187
5.2 Mixing Procedure ... 189
5.3 Fresh Properties ... 190
5.4 Mechanical Characterization ... 192
5.4.1 Compression testing ... 193
5.4.2 Tensile Stress-Strain Behaviour ... 196
5.5 Conclusions ... 204
CHAPTER 6 ... 205
Final Remarks ... 205
Bibliography ... 207
8
List of Figures
Chapter 2
Figure 2. 1- Map of the world. 23
Figure 2.2- Sea-level rise over the years. 24
Figure 2.3- The largest Port in the world located in China. 25
Figure 2.4- Breakwaters in front of a public beach. 26
Figure 2.5- The Sakhalin-1 Consortium - the biggest oil rig in the world. 26
Figure 2.6- Port of Sines. 27
Figure 2.7- Relation between temperature-salinity-density. 29
Figure 2.8- Storm wave caused by hurricane winds. 30
Figure 2. 9- Physical causes of deterioration of concrete. 31 Figure 2. 10- Possible degradation mechanisms acting on concrete exposed seawater. 31 Figure 2. 11- Example of corrosion of reinforced concrete structures. 33 Figure 2. 12- Frost action damage in a reinforced concrete structure. 34 Figure 2. 13- Example of chloride attack in marine structures. 35 Figure 2. 14- Example of sulfate attack in a concrete structure near the sea. 36 Figure 2. 15- Cathodic protection used in Kyle of Tongue Bridge. 37 Figure 2. 16- Typical tensile-stress-strain diagram of ECC. 39 Figure 2. 17- Typical tensile behaviour of ECC and concrete. 40 Figure 2. 18- Geopolymerization process, including the deconstruction of MK by the activation of alkaline solution, the polymerization of generated alumina/silica-hydroxy species and the
stabilization of fresh formed structures. 42
Figure 2. 19- The first residential building made of alkali-activated cement concrete without any OPC. (20-storey residential building, Lipetsk, Russian Federation, 1987–1989). 43 Figure 2. 20- The Global Change Institute - First building using geopolymer as structural
material. 44
Figure 2. 21- Multiple micro-crack obtained dureing the unixial tensile test of geopolymer
specimens. 46
Chapter 3
Figure 3.1- Image of PVA fibres. 48
Figure 3.2- Mixer, spoon and bowl used to mix the materials. 49 Figure 3.3- Setup used to perform the mini-slump test. 50 Figure 3.4- Images showing the fresh behaviour of Mixture A with and without fibres. 51 Figure 3.5-.Moulds used to cast the specimens for compression testing. 52 Figure 3.6- Moulds used to cast the specimens for direct tension testing. 52 Figure 3.7- Moulds used to cast the plates for coupon specimens. 53
9
Figure 3.8- Setup used for the compression tests. 54
Figure 3.9- Example of cubic specimen of Mixture A before testing. 55 Figure 3.10- Compressive test results of Mixture A at 14 days for different curing environments:
a) air: b) seawater; c) tap water; d) salted water. 56
Figure 3. 11- Example of a cubic specimen after testing. 56 Figure 3.12- Compressive test results of Mixture A at 14 days for all types of curing. 57 Figure 3. 13- Average of Mixture A elastic modulus (14 days) 59 Figure 3. 14 - Compressive results of Mixture A, 28 days: a) cured in air; b) cured in seawater;
c) cured in tap water; d) cured in salted water. 60
Figure 3.15- Example of Mixture A cube after the test 61 Figure 3. 16- 28 days compressive results of Mixture A in all types of cure 61 Figure 3. 17 - Elastic modulus average of Mixture A (28 days) 63 Figure 3. 18- 14 vs 28 days compressive results of Mixture A: a) cured in air; b) cured in seawater c) cured in tap water; d) cured in salted water 64 Figure 3. 19- Comparison between the compressive strength results obtain at different ages. 65 Figure 3. 20- Comparison between the elastic modulus results obtain in different ages 65 Figure 3. 21- Example of notch made in the SCTT specimens 66 Figure 3. 22- Test setup and the method used to measure the central displacement of the
specimen 67
Figure 3. 23- SCTT results of Mixture A, 14 days: a) cured in air; b) cured in seawater; c) cured
in tap water; d) cured in salted water 69
Figure 3. 24- SCTT results of Mixture A (14 days) 69
Figure 3. 25- Example of Mixture A specimen used in this test 69 Figure 3. 26- SCTT results of Mixture A, 28 days: a) cured in air; b) cured in seawater; c) cured
in water; d) cured in salted water. 70
Figure 3. 27- SCTT results of Mixture A (28 days) 71
Figure 3. 28 – Example of a 28 days specimen of Mixture 71 Figure 3. 29 - 14 vs 28 days SCTT results of Mixture A: a) cured in air; b) cured in seawater;
c) cured in tap water; d) cured in salted water. 72
Figure 3. 30- Test setup used for the tensile tests 73
Figure 3. 31- Method used to measure the central displacement of the specimen 73 Figure 3. 32- Tensile results of Mixture A, 14 days: a) cured in air; b) cured in seawater; c)
cured in tap water; d) cured in salted water. 75
Figure 3. 33-Example of a 28 days specimen of Mixture A during testing. 76 Figure 3. 34- Mixture A dogbone specimens tested after 14 days of curing: a) in air; b) in
seawater; c) in tap water; d) in salted water. 77
Figure 3. 35- Average tensile test results for Mixture A in all environments (14 days). 77 Figure 3. 36- Example of a 28 days specimen of Mixture A during the test 78
10 Figure 3. 37 - Tensile test results for Mixture A after 28 days of curing: a) in air; b) in seawater;
c) in tap water; d) in salted water. 79
Figure 3. 38- 28 days Mixture A dogbone specimens after the test: a) cured in air; b) cured in seawater; c) cured in tap water; d) cured in salted water. 80 Figure 3. 39- Average tensile responses obtained for Mixture A cured in all environments (28
days). 81
Figure 3. 40- 14 days versus 28 days tensile test results of Mixture A: a) cured in air; b) cured in seawater; c) cured in tap water; d) cured in salted water. 82 Figure 3. 41- Compression test results for Mixture B at 14 days: a) cured in air; b) cured in seawater; c) cured in tap water; d) cured in salted water. 83 Figure 3. 42- Example of a cubic specimen after the test 83 Figure 3. 43- 14 days compressive results of Mixture B in all types of cure 84 Figure 3. 44- Compressive results of Mixture B, 28 days: a) cured in air; b) cured in seawater;
c) cured in tap water; d) cured in salted water. 86
Figure 3. 45- 28 days compressive test results of Mixture B for all types of curing. 87 Figure 3. 46 – 14 days versus 28 days compression test results for Mixture B: a) cured in air; b) cured in seawater; c) cured in tap water; d) cured in salted water. 89 Figure 3. 47- Compressive strength results obtained at different curing ages. 90 Figure 3. 48- Comparison between the elasticity modulus obtained at different curing ages. 90 Figure 3. 49- SCTT results of Mixture B after 14 days of curing: a) in air; b) in seawater; c) in
tap water; d) in salted water. 91
Figure 3. 50- SCTT results of Mixture B (14 days) 92
Figure 3. 51- SCTT results for Mixture B after 28 days of curing: a) in air; b) in seawater; c) in
tap water; d) in salted water. 93
Figure 3. 52- SCTT results of Mixture B (28 days) 93
Figure 3. 53- 14 days versus 28 days SCTT test results of Mixture B: s) cured in air; b) cured in seawater; c) cured in tap water; d) cured in salted water. 94 Figure 3. 54- Tensile results of Mixture B, 14 days: a) cured in air; b) cured in seawater; c)
cured in water; d) cured in salted water. 95
Figure 3. 55- Mixture B dogbone specimens tested after 14 days of curing: a) in air; b) in
seawater; c) in tap water; d) in salted water. 96
Figure 3. 56- Average tensile results of Mixture B in all environments (14 days) 97 Figure 3. 58- Tensile test results for Mixture B after 28 days of curing: a) in air; b) in seawater;
c) in tap water; d) in salted water. 98
Figure 3. 58- 28 days Mixture B dogbone specimens after the test: a) cured in air; b) cured in seawater; c) cured in water; d) cured in salted water 99 Figure 3. 59- Average tensile results of Mixture B in all environments (28 days) 99 Figure 3. 60- 14days versus 28 days tensile test results for Mixture B: a) cured in air; b) cured in seawater; c) cured in tap water; d) cured in salted water. 100
11 Figure 3. 61- Compressive results of Mixture C, 14 days: a) cured in air; b) cured in seawater;
c) cured in tap water; d) cured in salted water. 102
Figure 3. 62- 14 days compressive results of Mixture C in all types of cure 103 Figure 3. 63- Compressive results of Mixture C, 24 days: a) cured in air; b) cured in seawater;
c) cured in water; d) cured in salted water. 105
Figure 3. 64- 28 days compressive results of Mixture C in all types of cure 105 Figure 3. 65- 14 days versus 28 days compression test results for Mixture C: a) cured in air; b) cured in seawater; c) cured in tap water; d) cured in salted water. 107 Figure 3. 66- Comparison compressive strength results obtained at different curing ages. 108 Figure 3. 67- Comparison between the elasticity modulus obtained at different curing ages. 108 Figure 3.68- SCTT results for Mixture C after 14 days of curing: a) in air; b) in seawater; c) in
tap water; d) in salted water. 110
Figure 3. 69- SCTT results of Mixture C (14 days) 110
Figure 3. 70- SCTT results of Mixture C, 28 days: a) cured in air; b) cured in water; d) cured in
salted water. 111
Figure 3. 71- SCTT results of Mixture C (28 days) 112
Figure 3. 72- 14 days versus 28 days SCTT results for Mixture C: a) cured in air; b) cured in seawater; c) cured in tap water; d) cured in salted water. 113 Figure 3. 73- Tensile results of Mixture C 14 days after curing: a) in air; b) in seawater; c) in
tap water; d) in salted water. 114
Figure 3. 74- Mixture C dogbone specimens tested after 14 days of curing: a) in air; b) in
seawater; c) in tap water; d) in salted water. 115
Figure 3. 75- Average tensile results of Mixture C in all environments (14 days) 116 Figure 3. 76- Tensile test results for Mixture C 28 days after curing: a) in air; b) in seawater; c)
in tap water; d) in salted water. 116
Figure 3. 77- Mixture C dogbone specimens tested 28 days after curing: a) in air; b) in seawater;
c) in tap water; d) in salted water. 118
Figure 3. 78- Average tensile results of Mixture C in all environments (28 days) 118 Figure 3. 79- 14 days versus 28 days tensile test results of Mixture C: a) cured in air; b) cured in seawater; c) cured in tap water; d) cured in salted water. 119 Figure 3. 80- Average compressive responses obtained for all mixtures 14 days after curing in
air. 120
Figure 3.81- Maximum compressive stress and elastic modulus of different mixtures cured in
air (14 days) 121
Figure 3. 82- Compressive behaviour results of different mixtures cured in air (28 days) 121 Figure 3. 83- Maximum compressive stress and elastic modulus of different mixtures cured in
12 Figure 3. 84- 14 days versus 28 days compression test results of specimens cured in air: a)
Mixture A; b) Mixture B; c) Mixture C. 123
Figure 3. 85- SCTT test results obtained after 14 days of curing in air. 124 Figure 3. 86- 28 days SCTT results obtained in all mixtures cured in air 124 Figure 3. 87- 14 days versus 28 days SCTT test results of specimens cured in air: a) Mixture A;
b) Mixture B; Mixture C. 125
Figure 3. 88- 14 days tensile results obtained in all mixtures cured in air 126 Figure 3. 89- 28 days tensile results obtained in all mixtures cured in air 127 Figure 3. 90 – 14 days vs 28 days tensile test results when cured in air: a) Mixture A; b) Mixture
B; c) Mixture C. 128
Figure 3. 91- Compression test results of the three mixtures cured in seawater 14 days after
casting. 129
Figure 3. 92- Compressive strength and elastic modulus obtained 14 days after curing in
seawater. 129
Figure 3. 93- Compressive behaviour results of different mixtures cured in seawater (28 days) 130 Figure 3. 94- Maximum compressive stress and elastic modulus of different mixtures cured in
seawater (28 days) 130
Figure 3. 95- 14 vs 28 days compression results cured in seawater: a) of Mixture A; b) of
Mixture B; c) of Mixture C 131
Figure 3. 96- 14 days SCTT results obtained in all mixtures cured in seawater 132 Figure 3. 97- 28 days SCTT test results obtained for all mixtures cured in seawater for 28 days. 132 Figure 3. 98- 14 days vs 28 days SCTT results of specimens cured in seawater: a) Mixture A;
b) Mixture B; Mixture C. 133
Figure 3. 99- 14 days tensile test results obtained for all mixtures after curing in in seawater for
14 days. 134
Figure 3. 100- 28 days tensile test results obtained for all mixtures after curing in seawater for
28 days. 135
Figure 3. 101- 14days vs 28 days tensile test results of specimens cured in seawater: a) Mixture
A; b) Mixture B; c) Mixture C. 135
Figure 3.102- Compression test results for all mixtures cured in tap water for 14 days. 136 Figure 3. 103- Compressive strength and elastic modulus for specimens cured in tap water for
14 days. 137
Figure 3. 104- Compression test results for specimens cured in tap water for 28 days. 137 Figure 3. 105- Compressive strength and elastic modulus for specimens cured in tap water for
28 days. 138
Figure 3. 106- 14 days versus 28 days compression test results of specimens cured in water: a)
13 Figure 3. 107- 14 days SCTT results obtained in all mixtures cured in water 140 Figure 3. 108- 28 days SCTT results obtained in all mixtures cured in tap water 140 Figure 3. 109- 14 vs 28 days SCTT results cured in water: a) of Mixture A; b) of Mixture B; of
Mixture C. 141
Figure 3.110- Direct tension test results obtained in all mixtures cured in water for 14 days. 142 Figure 3. 111- Direct tension test results obtained for all mixtures cured in water for 28 days. 142 Figure 3. 112- 14 days vs 28 days direct tension test results of specimens cured in water: a)
Mixture A; b) Mixture B; c) Mixture C. 143
Figure 3. 113- Compression test results of different mixtures cured in salted water for 14 days. 144 Figure 3. 114- Compressive strength and elasticity modulus of different mixtures cured in salted
water for 14 days. 145
Figure 3. 115- Compression test results of all mixtures cured in salted water for 28 days. 145 Figure 3. 116- Maximum compressive stress and elasticity modulus of different mixtures cured
in salted water (28 days) 146
Figure 3. 117- 14 days versus 28 days compression test results of specimens cured in salted
water: a) Mixture A; b) Mixture B; c) Mixture C 146
Figure 3. 118- SCTT results obtained in all mixtures cured in salted water for 14 days. 147 Figure 3.119- SCTT results obtained for all mixtures cured in salted water for 28 days. 148 Figure 3. 120- 14 days vs 28 days SCTT results of specimens cured in salted water: a) Mixture
A; b) Mixture B; Mixture C. 149
Figure 3. 121- Direct tension test results obtained for all mixtures cured in salted water for 14
days. 150
Figure 3.122- Direct tension test results obtained in all mixtures cured in salted water for 28
days. 150
Figure 3.123- 14 days versus 28 days direct tension test results of specimens cured in salted
water: a) Mixture A; b) Mixture B; c) Mixture C. 151
Chapter 4
Figure 4. 1- Compression test results at 42 days of Mixture B: a) cured in air; b) cured in
seawater. 155
Figure 4. 2- Compression results at 42 days of Mixture C: a) cured in air; b) cured in salted
water 156
Figure 4. 3- Uniaxial tensile results of one specimen cured in air 158 Figure 4. 4- Tensile results of the other two specimens tested 158 Figure 4. 5- Uniaxial tensile test results of one of the specimens cured in seawater. 159
14 Figure 4. 6- Uniaxial tensile test results of the other two specimens cured in seawater. 160 Figure 4. 7- Tensile results of one specimen tested cured in air 161 Figure 4. 8- Tensile results of the other two specimens tested cured in air 161 Figure 4. 9- Uniaxial tensile test results of one of the specimens cured in seawater. 162 Figure 4. 10- Uniaxial tensile test results of the other two specimens cured in seawater. 162 Figure 4. 11- Uniaxial tensile test results of one of the specimens cured in air. 164 Figure 4. 12- Uniaxial tensile test results of the two other specimens cured in seawater. 164 Figure 4. 13- Uniaxial tensile test results of one of the specimens cured in salted water.. 165 Figure 4. 14- Tensile results of the other two specimens tested 166 Figure 4. 15- Uniaxial tensile test results of one of the specimens cured in air. 167 Figure 4. 16- Uniaxial tensile test results of the other two specimens cured in air. 167 Figure 4. 17- Uniaxial tensile test results of one of the specimens cured in salted water. 168 Figure 4. 18- Uniaxial tensile test results of the other two specimens cured in salted. 169 Figure 4. 19- Self-healing behaviour of one specimen cured in air and pre-loaded at 0.75% 170 Figure 4. 20- Crack patterns obtained at stages 1 to 5 of Mixture B specimen cured in air and
pre-load at 0.75%. 171
Figure 4. 21- Self-healing behaviour of one specimen cured in salted water and pre-loaded at
0.75% 172
Figure 4. 22- Crack patterns obtained at stages 1 to 5 of Mixture B specimen cured in seawater
and pre-load at 0.75%. 173
Figure 4. 23- Self-healing behaviour of one specimen cured in air and pre-loaded at 1.5%. 174 Figure 4. 24- Crack pattern of Mixture B specimen cured in air and pre-load at 1.5% 175 Figure 4. 25- Self-healing behaviour of one specimen cured in seawater and pre-loaded at 1.5%. 176 Figure 4. 26- Crack pattern of Mixture B specimen cured in seawater and pre-load at 1.5% 177 Figure 4. 27- Self-healing behaviour of one specimen cured in air and pre-loaded at 0.75%. 178 Figure 4. 28- Crack pattern of Mixture C specimen cured in air and pre-load at 0.75% 179 Figure 4. 29-. Self-healing behaviour of one specimen cured in seawater and pre-loaded at
0.75%. 180
Figure 4. 30- Crack pattern of Mixture C specimen cured in salted water and pre-load at 0.75% 181 Figure 4. 31- Self-healing behaviour of one specimen cured in air and pre-loaded at 1.5%. 182 Figure 4. 32- Crack pattern of Mixture C specimen cured in air and pre-loaded at 1.5% 183 Figure 4. 33- Self-healing behaviour of one specimen cured in salted water and pre-loaded at
1.5%. 184
Figure 4. 34- Crack pattern of Mixture C specimen cured in salted water and pre-load at 1.5% 185
15
Chapter 5
Figure 5. 1- Images of fresh Ma_Metallic mixture spread with and without fibres. 191 Figure 5. 2 – Images of fresh GP_2.0_Metallic spread mixture with and without fibres. 191 Figure 5. 3- Images of fresh GP_1.5_Metallic spread mixture with and without fibres. 192 Figure 5. 4- Images of fresh GP_2.0_PVA spread mixture with and without fibres. 192 Figure 5. 5- Compressive responses of all Ma_Metallic specimens tested. 193 Figure 5. 6- Compressive responses of GP_2.0_Metallic specimens. 194 Figure 5.7- Compressive responses of GP_1.5_Metallic specimens. 195 Figure 5. 8- Compressive responses of GP_2.0_PVA specimens. 196 Figure 5. 9- Tensile responses of Ma_Metallic specimens. 197 Figure 5. 10- Photos of one Ma_Metallic specimen after testing. 198 Figure 5. 11- Tensile responses of GP_2.0_Metallic specimens. 199 Figure 5. 12- Photos of one GP_2.0_Metallic specimen after testing. 199 Figure 5. 13- Tensile response of GP_1.5_Metallic specimens. 200 Figure 5. 14- Photos of one of the GP_1.5_Metallic specimen after testing. 200 Figure 5. 15- Tensile response of GP_2.0_PVA_01 specimen. 201 Figure 5. 16- Photos of the first GP_2.0_PVA_specimen after testing. 201 Figure 5. 17- Tensile response of GP_2.0_PVA_02 specimen. 202 Figure 5. 19- Photos of GP_2.0_PVA_02 specimen after testing. 202 Figure 5. 19- Tensile response of GP_2.0_PVA_03 specimen. 203 Figure 5. 20- Photos of GP_2.0_PVA_03 specimen after testing. 203
16
List of Tables
Chapter 3
Table 3. 1- Mixtures Composition for 2 L 49
Table 3.2- Fresh behaviour of the mixtures assessed using the mini-slump test. 51 Table 3. 4- Elastic modulus of Mixture A specimens (14 days) 58 Table 3. 5- Maximum compressive results of Mixture A in all environments (28 days) 61 Table 3.6- Elastic modulus of Mixture A specimens (28 days) 62 Table 3. 7– Properties of tensile curves of Mixture A in all environments (14 days) 76 Table 3. 8- Properties of tensile curves of Mixture A in all environments (28 days 79 Table 3. 9- Compressive strengths of Mixture B for all curing environments at 14 days. 84 Table 3. 10 - Elastic modulus of Mixture B specimens (14 days) 85 Table 3. 11- Compressive strengths of Mixture B for all curing environments at 28 days. 87 Table 3. 12- Elastic modulus of Mixture B specimens (28 days) 88 Table 3. 13- Tensile results of Mixture B for all curing environments at 14 days. 96 Table 3. 14 – Tensile results of Mixture B for all curing environments at 28 days. 98 Table 3. 15- Compressive strengths of Mixture C for all curing environments at 14 days. 103 Table 3. 16- Elastic modulus of Mixture C specimens at 14 days. 104 Table 3. 17- Compressive strengths obtained for Mixture C in all curing environments at 28
days. 106
Table 3. 18- Elasticity modulus of Mixture C specimens at 28 days. 106 Table 3. 19- Tensile stress-strain results of Mixture C for all curing environments at 14 days. 114 Table 3. 20- Tensile test results of Mixture C for all curing environments at 28 days. 117
Chapter 4
Table 4. 1- Mixtures compositions 154
Table 4. 2-Compressive strength of Mixtures B and C after 14 days of curing. 155 Table 4. 3- Maximum compression stress of each specimen tested 156 Table 4. 4- Main characteristics of all specimens tested cured in air 159 Table 4. 5- Main tensile characteristics of all specimens cured in seawater. 160 Table 4. 6- Main tensile characteristics of all specimens cured in air. 161 Table 4. 7- Main tensile characteristics of all specimens cured in seawater. 163 Table 4. 8- Main tensile characteristics of all specimens cured in air. 165 Table 4. 9- Main tensile characteristics of all specimens cured in salted water. 166 Table 4. 10- Main tensile characteristics of all specimens cured in air. 168 Table 4. 11 Main tensile characteristics of all specimens cured in salted water. 169
17
Chapter 5
Table 5. 1- Alternative binder system compositions for a volume of 2 dm3. 188
Table 5. 2- Ma_Metallic composition for a volume of 2 dm3. 188
Table 5. 3- Fresh properties of each mixture. 190
Table 5. 4- Compression test results of Ma_Metallic specimens. 194 Table 5. 5- Compression test results of GP_2.0_Metallic specimens. 194 Table 5. 6- Compression test results of GP_1.5_Metallic specimens. 195 Table 5. 7- Compression test results of GP_2.0_PVA specimens. 196
19
CHAPTER 1
Introduction
1.1 Foreword
In the twentieth century concrete has emerged as the most used construction material in numerous types of environments. Its utilization is due to good mechanical properties, its versatility and low maintenance [1]. However, the use of concrete has disadvantages such as low tensile strength, low ductility and its susceptibility to cracking.
The maritime environment is highly inhospitable to building materials. Sea water contains many salts as well as organisms which are aggressive for building materials. Extreme temperatures, wave action and hydrostatic pressures are responsible for accelerating the deterioration process of concrete, which is often observed in the coastal structures [2] [3]. The challenges of Civil Engineering, especially within the structures in extreme environments, have huge expectations with regards to the development of fibre reinforced materials for the development of more resistant and durable solutions. Therefore, it is necessary to understand the deterioration mechanism of concrete structures in marine environment in order to obtain a resilient material to such demanding actions.
The fibre reinforced composites have numerous advantages over conventional materials. These materials are the result of a combination of high strength fibres in a matrix, which may be cementitious or not. Thus, the matrix and the fibres retain their physical and chemical identities but produce a combination of mechanical properties which cannot be achieved with any of the constituents functioning separately [4]. The existence of fibres, at the microstructural level, allows better mechanical performance and durability.
1.2 Motivation
Modern structures are being exposed to severe environments and the lack of durability is one of the most serious problems in concrete infrastructures. Concrete is known to be a tension-weak material, with a tensile strength much lower than the compressive strength and very
20 limited tensile strain capacity resulting multiple cracks during the lifetime of concrete structures.
Engineered Cementitious Composite (ECC), is class of ultra-ductile fibre reinforced composite, with a strain capacity more than 300 times that concrete. The formation of a large number of microcracks as the load increases allows the material to have high deformability.
The existence of fibres, at microstructural level, in the composite allows better mechanical performance and durability. This study will assess the behaviour of different mixtures of fibres and matrices in order to obtain a composite that is economically viable and innovative for later use in coastal and offshore structures. To reduce the environmental impact and improve the sustainable aspect of ECC materials seawater and salted water were used in the compositions. Alternative binder systems without ordinary Portland cement, such as geopolymers, are recently new in the Civil Engineered world. However, they have some advantages when applied in severe environments. In this this work a sustainable and consistent alternative to structural systems currently used is searched. In particular, the study will focus on the most negative aspects of actions and their effects on structures in the marine environment, and will address the deterioration mechanisms of the mechanical properties of the composites under study in this environment.
1.3 Scope and objectives
This thesis aims to:
Understand the deterioration mechanisms of concrete structures in marine environment;
Develop and characterize three different mixtures of Engineered Cementitious Composition using tap water, seawater and salted water in the composition;
Assess of mechanical behaviour of fiber reinforced composites in four different types of curing environments;
Characterize the self-healing behaviour in Engineered Cementitious Composites in different curing environments;
Develop a composite based on an alternative binder system which does not contain ordinary Portland cement.
21
1.4 Structure of the dissertation
In general, information obtained from the experimental program carried out is restricted to the characterization of the initial time evolution of compressive and tensile behaviours.
The thesis is divided into six chapters presented in the following sequence:
Chapter 1: In this chapter a brief introduction to marine environment and to fibre reinforced cementitious composites is done; additionally the motivation to the research, scopes and objectives are presented.
Chapter 2: Dedicated to the state of the art, in this chapter special attention is given to the durability of concrete structures in the marine environment. In the first section, a general description of the main problems of marine environment is presented. In the second section the new materials that are investigated for using in the marine environment are approached, considering the need to improve resilience of concrete structures in the marine environment. Chapter 3: A description of the experimental programme carried out to characterize the behaviour of Engineered Cementitious Composites is presented. In the first section the mechanical behaviour of the three different mixtures studied is presented. In the second section the influence of the mix composition while curing in the different environments is presented. Chapter 4: This chapter is dedicated to the experimental programme carried out to characterize self-healing behaviour of two Engineered Cementitious Composites mixtures. The direct tensile test results are presented in the first section. In the second section the cracking processes are characterized by using digital image analysis and processing.
Chapter 5: This chapter was dedicated to the development and characterization of the compressive and tensile performance of fiber reinforced metakoalin based geopolymer, as well as to the use of steel fibres for the development of innovative fibre reinforced cementitious composites aimed at resilient marine structures.
Chapter 6: This last chapter is dedicated to the conclusions of developed work and to the identification of further research needs regarding the topic of investigation of this dissertation.
23
CHAPTER 2
State Of Art
In this chapter a brief description of the state of the art is presented, giving particular attention to the characterization of the new materials. The chapter is divided in sub-sections for a better understanding of the evolution of the knowledge and of the scientific work.
In the first section, a general description of the main problems of marine environment is presented. In the second the new materials that are investigated for using in the marine environment are approached, considering the need to improve resilience of concrete structures in the marine environment.
2.1 The oceans
The oceans are the dominant features of the planet Earth. They cover almost 70 percent of the Earth’s surface. Since before recorded history, oceans have been used for transport, for food, for conquest and unfortunately for waste disposal. They are a barrier and a conduit over which people and goods have been moved with relative culture while garnering Earth’s remote resources [2].
Figure 2. 1- Map of the world [5].
For thousands of years, populations have depended on the ocean for route, for trade and exploration. Nowadays, people continue to travel on the ocean and rely on the resources that de seawater contains. Most recently scientists and other experts hope that the ocean will be used
24 more widely as a source of renewable energy. Some countries have already harnessed the energy of ocean waves, temperature, currents, or tides to power turbines and generate electricity [3].
Marine and offshore structure were designed to improve the quality of the population by protecting the land from the severe action of the sea, and to allow the exploitation of seawater resources.
2.1.1 Marine and offshore structures in the context of Climate Change
Marine and offshore structures play a crucial role in the economic, social and political development of most countries. They support diverse and productive ecosystems that provide valuable goods and services.
Sea level rise is caused primarily by two factors related to global warming: the added water from melting land ice and the expansion of sea water as it warms. Over the past century, the burning of fossil fuels and other human and natural activities has released enormous amounts of heat-trapping gases into the atmosphere. These emissions have caused the Earth's surface temperature to rise, and the oceans absorb about 80 percent of this additional heat [6].
25 As seawater reaches farther inland, it can cause destructive erosion, flooding of wetlands, contamination of aquifers and agricultural soils, and destroy habitats for fish, birds, and plants. When large storms hit land, higher sea levels mean bigger, more powerful storm surges that can strip away everything in their path. In addition, hundreds of millions of people live in areas that will become progressively vulnerable to flooding. Higher sea levels would force them to abandon their homes and relocate and low-lying islands could be submerged completely. Marine structures are seen as one of the options as response to this problem [8].
There are numerous types of marine structures with different functions, such as protection of the territory and population, and support of commercial activities. As an example, Ports and harbours are a vehicle for goods and enclose four important functions:
Administrative (ensuring that the legal, socio-political and economic interests of the state and international maritime authorities are protected);
Development (ports are major promoters and instigators of a country’s or wider regional economy);
Industrial (major industries process the goods imported or exported in a Port);
Commercial (Ports are international trade junction points where various modes of transport interchange; loading, discharging, transit of goods).
Figure 2.3- The largest Port in the world located in China [10].
Coastal defence structures have a strong influence on the configuration of the shoreline. They have as main function the protection of the population and the land from the sea-level rise. Artificial structures can influence sediment transport, reduce the ability of the shoreline to
26 respond to natural forcing factors and fragment the coastal space [4]. This can result in loss of habitats and lead to noise and visual disturbance of birds. On the positive side, coastal defence structures can increase shipping and tourism and increase or restore natural habitats in certain cases. To protect the land and populations from the sea there are several techniques that can be used as breakwaters, dikes, gabions and seawalls Figure 2.4.
Figure 2.4- Breakwaters in front of a public beach [11].
In the last decades, the offshore structures have developed rapidly to meet the need to exploit deeper waters as a result of depletion of shallow water easy-to reach resources. This need for deep-water developments and a desire to continue to exploit depleting shallow water reserves has spawned new forms of offshore structures for production [12]. One example is the Sakhalin-1 Consortium, which consists of the world’s biggest oil platform and involves the production in particularly harsh conditions localized in Russia (Figure 2.5).
27
In Portugal
The sea represents a unique advantage for Portugal. The favourable location of the border of Portugal in Western Europe, where maritime traffic converges from worldwide, its long coast line and the size of its Exclusive Economic Zone are unique competitive advantages for this country [5].
The national marine activity has been losing dimension as a productive activity, not having kept pace with the competition created by the sector's liberalization. This decrease was accompanied by a decline of the shipbuilding sector, materialized in the closure of many yards and reducing the capacity of many others.
The port of Lisbon receives every year around 500 000 tourists, and the capital city hosts the major port of the country in terms cruise landings and the third port in terms of cargo transport. The “Grande Lisboa” region also concentrates the national shipbuilding and repair industry, and is the fourth region in terms of fishery activities.
The sector of commercial ports has required a significant economic development, accompanied by diversification and provision of infrastructure and port services, associated to an increase in the availability and expertise capabilities to meet traffic requirements with significant impact, such as import/export and containerized cargo transhipment or petroleum products, natural gas and coal.
The port of Sines (Figure 2.6) is one of the few deep-water ports at European level and has a very important role in the Portuguese economy. This port is the national leader for cargo handled and is critical in the energy supply of the country.
28
2.1.2 The marine environment
The ocean combines a few of the most aggressive environments in the world for engineering structures. Seawater and sea environments combine unique characteristics that create a challenge to civil engineering such as:
Chemical composition;
Marine Organisms;
Temperature;
Hydrostatic pressure;
Storm waves;
Fog and spray;
Ice impact and ice abrasion.
Therefore, oceans are one the most difficult environments to concrete structures due physical and chemical factors.
Seawater contains salts and ions such as chlorine, sodium, sulfur, magnesium, calcium and potassium. These can affect the freezing point and the alkalinity of the water. Seawater also contains small amounts of dissolved gases. Many of these gases are dissolved into seawater by the atmosphere through the constant stirring of the sea surface by wind and waves [2]. The concentration of gases that can be dissolved into seawater from the atmosphere is determined by temperature and salinity of the water. The increasing of the temperature or the salinity leads to the reduction the amount of gas that ocean water can dissolve.
The temperature of seawater varies widely with the depth and climate zone. In addition to that, the temperature affects the growth of marine organisms and determines the rate of chemical and electrochemical reactions in concrete [2]. Temperature and density share an inverse relationship. As temperature increases, the space between water molecules increases—also known as density, which therefore decreases. If the temperature of water decreases its density increases, but only to a point. Salinity and density share a positive relationship. As density increases, the amount of salts in the water increases. Various actions can contribute to changes in the density of seawater [6].
29
Figure 2.7- Relation between temperature-salinity-density [16].
The currents and the tidal action are the two most important aspects of the sea affecting the durability of the materials that are used in marine construction. Tides are caused by the gravitational interaction between the Earth and the Moon. The gravitational attraction of the moon causes the oceans to bulge out in the direction of the moon. Twice a day the oceans experience a natural event that moves massive amounts of water [2].
Currents, that are essential for maintaining the existing balance of life on Earth, are driven by several factors such as:
The rise and fall of the tides, that create a current in the oceans, near the shore, as well as in bays and estuaries along the coast;
Winds, mostly the ones that blow along the shoreline;
Thermohaline circulation, that is a process driven by differences in the water due temperature and salinity in different parts of the ocean [7].
30
Figure 2.8- Storm wave caused by hurricane winds. [18].
2.1.3 Durability of concrete structures in the marine environment
Reinforced concrete is the most commonly used construction material in the world [8]. With the exponential growth of human population and industrialization, concrete is now used not only for buildings but also for highways, bridges, underground mass transit facilities, water treatment systems and marine structures [2]. Because the modern structures are being exposed to severe environments the lack of durability is one of the most serious problems in concrete infrastructures.
The durability of a structure represents its ability to serve its intended purposes for a sufficiently long period of time. A durable structure is expected to serve without deterioration to the extent that major repair is required before expiry of its design life [9].
In marine environment, the structures are exposed to a serious number of physical and chemical interactions that affect the strength and stiffness of the concrete causing crack, leading to other types of concrete deterioration such as corrosion, alkali-silica reaction and sulphate attack, resulting in further cracking and disintegration [10].
31
Figure 2. 9- Physical causes of deterioration of concrete [2].
The deterioration processes depend on the exposure conditions. These can be classified into three different exposure zones depending upon the nature and effect on the exposed structure.
Figure 2. 10- Possible degradation mechanisms acting on concrete exposed seawater [21].
The structures located in the tidal and atmospheric zone are more vulnerable to the aggressive action of seawater than those which are continuously and fully submerged in the water as offshore structures [1].
Corrosion of reinforcement occasionally takes place in the submerged parts of the structure due to the lack of oxygen [10]. In tidal/splash zone, concrete is repeatedly wetted by seawater with
32 alternate periods of drying during which pure water evaporates. The dissolved salts are left behind in the form of crystals, mainly sulphates. This area is also subjected to damage due to salt crystallization, as well as freezing and thawing in a cold climate.
The atmospheric zone is that part of the structure above the splash zone and the damage is similar to that in the splash zone but in a lesser degree.
The deterioration process results from the combined effects of chemical action of seawater constituents on cement hydration products, crystallization of salts within concrete, alkali-aggregate expansive reactions, corrosion reinforced bars, freezing and thawing in a cold climate, and physical erosion due the wave action and floating objects. As soon as the concrete is attacked by any of these processes, the permeability tends to increase and consequently it is more susceptible to further attack by various other processes [10].
Corrosion of embedded steel is, generally, the major cause for concrete deterioration in reinforced and prestressed concrete structures exposed to seawater, although in low-permeability concrete this does not appear to be the first cause of cracking.
The main causes for insufficient watertightness are [11]:
Poorly proportioned concrete mixtures;
Absence of properly entrained air if the structure is located in a cold climate;
Insufficient consolidation and curing;
Lack of concrete cover on embedded steel;
Badly designed or constructed joints;
Microcracking in hardened concrete due to the lack of control of loading conditions and other factors, such as thermal shrinkage, drying shrinkage, and alkali aggregate expansive reactions.
33
Figure 2. 11- Example of corrosion of reinforced concrete structures [24].
Physical attack
Frost-thaw damage
This type of damage represents a durability problem to concrete structures [12]. The most frequent cause for cracking and spalling, in cold climates, is frost action [2]. Disintegration is caused by the freezing of water inside the pores of the concrete, since the water expands by 9% on freezing and creates disruptive internal pressures. If the induced stress is higher than the strength of the hardened cement paste, cracking will happen. The damage to the paste increases with the number of freezing and thawing cycles. Freeze-thaw damage to the aggregate depends largely on the size, number and continuity of its pores. Aggregates with low permeability and high strength are more resistant to freeze-thaw action [10]. A permeable, weakened concrete, then falls an easy victim to other physical and chemical agents [2].
34
Figure 2. 12- Frost action damage in a reinforced concrete structure [26].
Erosion/abrasion
Erosion can occur for prolonged exposure of the concrete to continued attrition by stones and shingle carried by water, as may occur in hydraulic structures or in seawater. Good dense concrete will normally resist a high-velocity flow of water, provided the flow is smooth and streamlined. Concrete will abrade where exposed to the forces of cavitation, as occurs in those portions of hydraulic structures designed to dissipate energy by incorporating obstructions to the free flow of water. The cavities collapse with impact and sudden changes in direction, resulting in pressures which may cause wearing (pitting) of the concrete surface [10].
Chemical attack
Chloride attack
Chloride attack is one of the most important aspects considering the durability of concrete. Chloride ions enter the concrete from cement, water, aggregate, admixtures and by diffusion from the ambient environment and causes the corrosion of the reinforcement [1].
The ingress of chloride by capillary action via airborne salt spray and/or the wetting and drying with seawater is the major contribution to chloride driven corrosion in marine concrete structures. If there are chloride ions in the pore water adjacent to the reinforcing steel above a certain concentration, the passive iron oxide film in the steel reinforcement breaks down. Chloride contents from 0.1 to 0.4% or more may initiate corrosion.
35 The corrosion products, being of greater volume than the parent metal, exert pressure and thus cause the concrete to crack and eventually spall. Common types of visual deterioration damage are rust staining, spalling, exposed rebar and delamination [10].
Figure 2. 13- Example of chloride attack in marine structures [24].
Sulfate Attack
Concrete is vulnerable to attack by sulphate, causing cracking and spalling due to expansion. Where sulphates are present in water or soils, the permeability of concrete and the presence of water allows sulphate ions to diffuse into the concrete and create an expansive reaction causing spalling and deterioration. A similar effect is caused by alkali aggregate reaction whereby the presence of water in concrete permits a reaction between silica in certain aggregates and the alkalis in cement.
The main sulphate of interest in sea-water is magnesium sulphate that reacts with calcium aluminates, silicates and lime in cement forming magnesium hydroxide, calcium sulphate (gypsum) and calcium sulphoaluminate (ettringite).
Ettringite is finally decomposed and gypsum precipitated, leaving a soft concrete. An appreciable loss of strength can occur, particularly when leaching conditions are present. Magnesium and ammonium sulphates are the most damaging to concrete. The type of sulphate and the concentration present can influence the nature and rate of decomposition [21],
36
Figure 2. 14- Example of sulfate attack in a concrete structure near the sea. [25].
2.1.4 Strategies to improve the durability of reinforced concrete
Concrete structures are designed considering that they will require no maintenance during their service life. However, the marine environment causes countless damages to concrete structures. In this condition chloride penetration and chloride induced reinforcement corrosion rates can be very high, often leading to a reduced service life.
Any method of protection and repair, to be successful in the long term, must restore passivity by removing the causes of corrosion or prevent corrosion through cathodic protection or anodic control [13].
Traditional repair methods involve the removal of chloride contaminated concrete and cleaning of the corrosion present in the steel. The cleaned steel surface is next coated with an insulating coating to ensure that any chlorides remaining in the old concrete will not reach the steel again. Many layers of coating, mostly epoxy products, are used to cover defects and the last layer needs to be sanded to provide better adhesion to the repair mortar. Before applying the repair mortar it is necessary to apply an insulating adhesive as a primer. After, the selected repair mortar is installed to a predetermined cover thickness [2].
There are many ways to decrease the corrosion process, however cathodic protection is the only technology that has proven to stop corrosion in existing reinforced concrete structures, regardless of the chloride content in the concrete. Cathodic protection is defined as the reduction or elimination of corrosion by making the metal a cathode via an impressed direct current or by connecting it to a sacrificial or galvanic anode. In the last decades, this method of repair has
37 been successfully used to protect underground pipelines, ship hulls, offshore oil platforms, underground storage tanks, and many other structures exposed to corrosive environments [14]. The Kyle of Tongue Bridge (Figure 15) in Sutherland, Northern Scotland opened in 1970, and was patch repaired in 1989 due to chloride induced corrosion. However, inspections from 1999 onwards reported on-going corrosion and structural deterioration. A refurbishment contract was let in 2011 to extend the service life of the structure for a 30 year period by providing corrosion arrest and prevention [31].
Figure 2. 15- Cathodic protection used in Kyle of Tongue Bridge [28]
2.2 Alternative Materials
Concrete, that is the most elementary construction material, is known to be a tension-weak material, with a tensile strength much lower than the compressive strength (typically 10%) and very limited tensile strain capacity [2]. However, the durability, the capacity to take multiple shapes and low maintenance makes the concrete the most used material in marine and offshore construction.
Cracks and internal flaws exist even prior to loading, and the mechanical behaviour of concrete under distinct loading conditions is mostly governed by the influence of these initial flaws and weak regions on the initiation and propagation of cracks. Also, the great difference between the nature and mechanical properties of aggregates and the cementitious materials in the concrete matrix induce important stress gradients at the transition regions between the different phases.
38 Synthetic composite materials are a recent addition. These materials must perform in harsh environments, subjected to the various corrosive and erosive actions of the sea, under dynamic cyclic and impact conditions over a wide range of temperatures.
2.3 Engineered Cementitious Composites (ECC)
Engineered Cementitious Composites (ECC) is a class of cement-based materials typically reinforced with Polyvinyl Alcohol (PVA) fibres developed for applications in the large material volume usage. One of its first predecessors was developed in 1960 by Romauldi and co-workers, that used short steel fibres in concrete to reduce the brittleness [15]. In 1980 began the interest in fibre reinforced concrete materials with tensile ductility. Ductility is a measure of tensile deformation (strain) capacity typically associated with ductility in steel.
Krenchel and Stang in 1989 demonstrated that the ductility behaviour of concrete could be increased by hundreds of times with the presence of continuous aligned fibres in the cement matrix [15].
In 1993, the first ECC material was developed at the University of Michigan by Professor Li and his co-workers with a typical moderate tensile strength of 4-6 MPa and higher ductility of 3-5 % [16].
This material can be regarded as a family of materials with a range of tensile strengths and ductilities that can be adjusted depending on the demands of a particular structure.
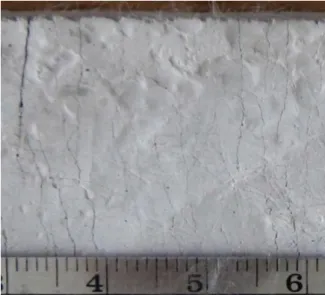
Pseudo-strain hardening behaviour in tension exhibited by ECC is the consequence of the development of multiple cracks under tensile loading. ECCs display significantly higher ductility and more reliable crack width control than reinforced concrete does [17]. The fact that this material shows multiple cracking behaviour represents a dual advantage in engineering applications: while more cracks develop at the same tensile deformation, the individual crack openings are significantly smaller [18].
Extensive research has shown that the most fundamental property of a fibre reinforced cementitious material is the fibre bridging property across a matrix crack.
The result of this multiple cracking behaviour is enhanced durability and improved preservation of functional properties at the structural level. In addition, high energy dissipation ability exists at the level of a single crack, which is amplified by the large number of cracks typically developed [18]
39
Figure 2. 16- Typical tensile-stress-strain diagram of ECC [18].
The mechanical behaviour in tension of ECC is the result of a delicate balance of multiple factors such as: the interfacial bonding and fibre pull-out properties, the mechanical characteristics of the fibres and of the matrix, the distribution of flaw sizes in the matrix, the fibre orientation and their dispersion in the matrix. This factors play an important role in the resulting composite mechanical behaviour [18].
Cement, fly ash, water, sand, super plasticizer and fibres are the common materials used to produce the ECC material. Normally, this composite contains 2 % of fibres in volume, which represents the critical fiber content that allows the strain-hardening response.
2.3.1 Tensile Strain Hardening Behaviour
The most important characteristic of ECC is the high tensile ductility represented by a uniaxial tensile stress-strain curve with strain capacity as high as 5% or more. This composite shows elastic behaviour (similar to concrete) until the “yield point” is reached, when the first micro cracks appear in the specimen or the structure. Final failure occurs when one of the multiple cracks forms a fracture plane. The high tensile ductility is of great value in improving the structural ultimate limit state in terms of structural load and deformation capacity, as well as energy absorption [15].
40
Figure 2. 17- Typical tensile behaviour of ECC and concrete [36]
Tensile strengths between 4 MPa and 14 MPa can be obtained, depending on the mixture composition.
Closely associated with the strain-hardening and multiple cracking behaviours is the small steady state crack width. Even at a strain of 4-5%, crack widths of ECC remain below 100 μm. Such small crack widths imply a significant improvement in structural durability [18]
2.3.2 Compressive Behaviour
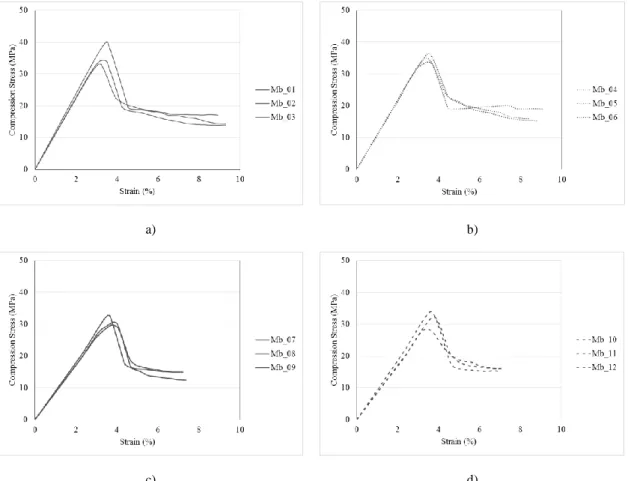
ECC materials are designed to exhibit high toughness and significant tolerance to damage in tension. Compared with concrete ECC has a similar compressive strength (between 40 MPa and 80 MPa) and ultimate compression strain around 0,45-0,65%. However, the post peak behaviour of ECC tends to descend more gently that concrete [15]. The elastic modulus of this material ranges between 20–30 GPa. The utilization of ECC was demonstrated to significantly improve the mechanical performance of structures when compared with conventional concrete, by considerably delaying the loss of structural integrity due to excessive deformation and preventing brittle failure. The influence of fiber reinforcement on the composite compressive strength is commonly assumed as negligible, although it contributes to increase the post-cracking energy dissipation ability. [7]
41
2.3.3 Self-healing
Durability of reinforced concrete structures can be caused by a wide variety of reasons. Cracking is one of the major flaw or damages in any stage of concrete structure. They are many reasons for cracks appearance as loading, volumetric change due the high temperatures, creep, plastic settlement, shrinkage, or deterioration mechanisms such as alkali-silicate reaction and freezing/thawing cycles [19]
If micro-cracks grow and reach the reinforcement, gases and liquids can penetrate, not only the concrete itself may be attacked, but also the reinforcement will be corroded when it is exposed to water and oxygen, and possibly carbon dioxide and chlorides.
In the last decades, there is growing interest in the phenomenon of mechanical properties recovery in self healed concrete materials, commonly known as autogenous healing. [19]
Experimental investigation and practical experience have demonstrated that healing of cracks in cementitious materials leads to a gradual reduction of permeability over time for water flowing under a hydraulic gradient. In extreme cases, cracks can be sealed completely and that can improve durability, permeability and potentially mechanical properties.
Self-healing behaviour depends of the crack width, smaller cracks heal faster and more efficient that larger cracks. The healing process involves chemical and physical mechanism. There is a various number of healing process but the main is precipitation of calcium carbonate crystals.
2.4 Geopolymers
Portland cement concrete is the most used building material in the world; however, its manufacture is energy-intensive. Generating approximately one ton of CO2 for each ton of
Portland cement produced, this binder is one of the primary causes of global warning. The manufacture of this building material also requires significant over-exploitation of natural resources as limestone quarries (it’s necessary over 3.0 billion tonnes of raw material to produce 2.0 billion tonnes of Portland cement). [20]. For these reasons, the necessity of development of a friendly environmental material that consumes less energy is crucial.
Geopolymer materials are inorganic polymers synthesised by the reaction of an alkaline silicate solution and an aluminosilicate source at near-ambient temperature, which was first tried in 1978 by Davidovits [21]. This environmentally sustainable material uses waste products in the
42 compositions and has a significantly lower CO2 footprint when compared with Portland cement.
[22]. In 1994, Glukhovsky proposed a general mechanism for the activation reaction of geopolymer material, consisting in three stages [42]:
1º) Destruction-coagulation; 2º) Coagulation-condensation; 3º) Condensation-crystallisation.
Figure 2.18 presents a highly simplified reaction mechanism for geopolymerization of metakaolin based geopolymers.
Figure 2. 18- Geopolymerization process, including the deconstruction of MK by the activation of alkaline solution, the polymerization of generated alumina/silica-hydroxy species and the stabilization of fresh formed structures. [43]
The dissolution of metakaolinite in alkaline solution is exothermic and in this process, the Si– O and Al–O bonds on particle surfaces are broken down. The deconstruction products in alkali– MK system will polymerize into gels as their concentrations grows up. The polymerization is exothermic and becomes the main contribution of heat evolution. After, approximately 4500 min, the process goes into a thermally steady stage, during which the fresh formed small gels are probably transformed into larger networks by local reorganization. [43]
43 In 1989, the first residential building made of alkali-activated cement concrete was built.
Figure 2. 19- The first residential building made of alkali-activated cement concrete without any OPC. (20-storey residential building, Lipetsk, Russian Federation, 1987–1989) [44].
The low energy process results in a fast-setting material that exhibits exceptional hardness and strength that can be comparable to the ones obtained with cement binders. Depending on the material that is used to produce the geopolymer can display different ranges of properties and characteristics different. There is a wide variety of raw materials that can be used to manufacture the alkali-activated cement such as fly ash, metakoalin, silica fume, blast furnace slag and red mud. When the geopolymeric materials are derived from coal ash the mechanical and chemical properties can by higher than that obtained with common cement. [23]
2.4.1 Advantages and applications of geopolymer
Geopolymer binders have similar behaviour to Portland cement. Geopolymeric material have advantages when compared to Portland cement, such as: [20]
Abundant raw materials resources: geopolymeric materials use mostly waste materials as raw materials with any pozzolanic or alumino-silicate compounds;
Energy saving and environmentally friendly: thermal processing of natural alumino-silicates at relative low temperatures (600° to 800°) provides suitable geopolymeric raw materials;
Simple preparation technique: geopolymers can be produced by mixing alumino-silicate reactive materials and alkaline solutions, then curing at room temperature.
44
Reasonable strength gain in a short time: it can set and harden at a room temperature and can gain reasonable strength in a short period.
Ultra-excellent durability: geopolymer concrete can withstand thousands of years of weathering attack without too much function loss.
High fire resistance and low thermal conductivity: geopolymers can withstand 1000° to 1200° without losing functions.
The described characteristics can be used in many fields, not only in civil engineering but also in automotive and aerospace industries, plastics industries, waste management, art and decoration, retrofit of buildings, etc. [20]. However, workability is one of the disadvantages of geopolymeric materials. This materials has quick setting times, which make its use very difficult in some fields. [24]
The University of Queensland’s Global Change Institute, designed by Hassell, has become the first building in the world to use cement free for suspended construction. Geopolymer concrete has been used and named the new material Earth Friendly Concrete (EFC). Comprising sand, aggregate and a binder that contains ground granulated blast furnace slag (a waste product from steel production) and fly ash (a waste product from coal fired power generation), EFC contained no Portland cement.