Carlos Pestana Barros & Nicolas Peypoch
A Comparative Analysis of Productivity Change in Italian and Portuguese Airports
WP 006/2007/DE _________________________________________________________
Luis Costa & Miguel St. Aubyn
The Macroeconomic Effects of
Legal-Simplification Programmes
WP 12/2012/DE/UECE _________________________________________________________
De pa rtme nt o f Ec o no mic s
WORKING PAPERS
ISSN Nº 0874-4548
School of Economics and Management
PROGRAMMES Luís F. Costa
(ISEG/Technical University of Lisbon and UECE) Miguel St. Aubyn
(ISEG/Technical University of Lisbon and UECE) ABSTRACT
Legal simplification may improve the quality of institutions in industrialised countries that developed over-complex legal systems. In theory, this type of regulatory reform promotes economic efficiency, leading to higher levels of productivity and output. In this paper we use a Panel Factor-Augmented VAR approach to measure the long-run impact of legal-simplification programmes in total factor productivity. We identify shocks using data on regulatory quality and exploring qualitative information publicly available. The estimated long-run impact on total factor productivity of a typical programme is significant and about 0.6 per cent.
JEL Classification: E02, K10, K20, K40, O43, O47
Keywords: Legal simplification; Regulatory reform; FAVAR; Productivity. Luís F. Costa
Instituto Superior de Economia e Gestão Universidade Técnica de Lisboa
Rua do Quelhas 6 1200-781 LISBOA Portugal
Tel.: +351-213 925 981 Fax: +351-213 922 808 E-mail: [email protected] http://www.iseg.utl.pt/~lukosta/
Miguel St. Aubyn
Instituto Superior de Economia e Gestão Universidade Técnica de Lisboa
Rua do Quelhas 6 1200-781 LISBOA Portugal
Tel.: +351-213 925 996 Fax: +351-213 922 808 E-mail: [email protected] http://www.iseg.utl.pt/~mstaubyn/
THE MACROECONOMIC EFFECTS OF LEGAL-SIMPLIFICATION PROGRAMMES*
By Luís F. Costa and Miguel St. Aubyn**
Legal simplification may improve the quality of institutions in industrialised countries that developed over-complex legal systems. In theory, this type of regulatory reform promotes economic efficiency, leading to higher levels of productivity and output. In this paper we use a Panel Factor-Augmented VAR approach to measure the long-run impact of legal-simplification programmes in total factor productivity. We identify shocks using data on regulatory quality and exploring qualitative information publicly available. The estimated long-run impact on total factor productivity of a typical programme is significant and about 0.6 per cent.
1.INTRODUCTION
The quality of institutions and government policies, i.e. social infrastructure, play an important role in explaining differences in productivity across countries – see Hall and Jones (1999), inter alia. Legal systems play a central role in this link as they contribute to reduce uncertainty and pool resources in order to protect private returns, the ultimate incentive behind economic actions.
However, from the 1990’s onwards, there is an increasing concern that over -regulation and excessive complexity of -regulation may have become an obstacle to economic efficiency and growth in industrialised countries. There are good reasons to assume that, in theory, a more complex legal system is not necessarily a better one and there may be an optimal level of complexity from the social point of view – see Crettez et al. (2009) or Epstein (2006), as examples.
On the policy front, OECD has promoted regulatory reform amongst its members, promoting the best practices and sharing experiences and the World Bank launched its Doing Business project in 20021. In the European Union, the Better Regulation
* We would like to thank Susana Brito, Peter Claeys, Diana Ettner, Filomena Garcia, Alexandra Leitão,
João Pedro Freire, Nuno Garoupa, Joana Pais, Álvaro Pina, Paula Rios, António Romão, Jorge Santos, Pedro Santos, António Marrachinho Soares, and the participants in a seminar at ISEG/TULisbon for their useful comments and suggestions. The usual disclaimer applies.
** The present work was motivated by a previous economic-impact-assessment report for the Simplegis Programme of the Portuguese Presidency of Ministers’ Council (PCM), contracted by CEJUR (the
Legal Centre of PCM). Financial support by FCT (Fundação para a Ciência e a Tecnologia), Portugal is gratefully acknowledged. This article is part of the Strategic Project (PEst-OE/EGE/UI0436/2011).
initiative – see European Commission (2006a) – assumed that “laws and regulations need to adapt to the fast pace of technological change, to foster innovation, to protect the welfare and safety of Europeans.” One of the objectives of this broad regulatory reform agenda is to reduce the complexity of legal systems in order to avoid excessive costs to firms and individuals.
Therefore, several developed countries have adopted regulatory reform programmes in order to foster growth and to enhance competitiveness. Some of these programmes have involved a legal-simplification dimension that aims to promote efficiency of legal systems. In general, we can identify three common goals of these programmes:
1. Simpler regulation, i.e. to reduce the number of laws and regulations using codification, eliminating outdated norms, etc.
2. Easily-accessible regulation, i.e. using clear language, promoting transparent and participating law-making, creating legal databases with free access on the internet with summaries in English available, etc.
3. Quality control for new regulation, i.e. making instruction manuals, requiring regulatory impact assessment, etc.
However, Arruñada (2007, 2012) and Davies and Kruse (2007), amongst others, do not share the mainstream vision that reducing legal (or administrative) complexity are a sure way of enhancing productivity. On one hand, simpler systems tend to be clearer, lead to more accurate decisions, are easier to apply, and exhibit lower transaction costs in the present. However, simpler systems lack specificity, tend to be less complete, increase uncertainty, and exhibit larger transaction costs in the future. Therefore, these authors advocate increased prudence in implementing this type of regulatory reform, as it tends to undervalue the evolution path of institutional arrangements.
In this article we use a Factor-Augmented VAR approach for a panel of 40 countries from 1996 to 2009 in order to measure the long-run impact of legal-simplification programmes in total factor productivity. We identify policy shocks using data on regulatory quality, within a broader index of institutional quality, and exploring qualitative information publicly available in a way that is vaguely inspired by the narrative approach of Ramey and Shapiro (1998), for fiscal policy, and Romer and Romer (1989), for monetary policy.
average, ranging from 0.1 per cent to 1.1 per cent, with two standard-deviation bands. Therefore, and assuming that the costs of implementing these programmes are not high, they show a statistically significant effect at the macroeconomic level, as predicted by theory and in line with the international regulatory reform agenda.
Section 2 presents the model to be estimated, section 3 analyses some measurement issues, section 4 presents the outcomes of the estimated model, section 5 uses available information to identify the impact of simplification programmes, and section 6 concludes.
2.THE MODEL
In this section we present the general foundations for a simple long-run macroeconomic model that can accommodate changes in regulatory quality that have real effects in GDP per capita. We will use this model to estimate the effects of regulatory-quality shocks that we can identify with explicit programmes of legal simplification in a sample of industrialised (and emerging European) countries.
2.1. The production function
We assume the macroeconomic production technology is common to industrialised countries and it is given by a Cobb-Douglas production function with constant returns to scale for country i in period t:
(1) Yit A Kit. it.Lit1 ,
where Y represents GDP, K is the physical capital stock, L stands for employment, A is total factor productivity (TFP), and 0 < < 1.
The Solow residual, i.e. TFP, represents the effect in GDP of factors other than physical capital and labour. According to the growth literature2, we can identify the following groups of factors influencing TFP in the long run:
geography (location, climate, natural resources);
human capital (education, training, health);
institutions (governance, democracy, freedom);
culture (language, religion, history).
Considering geography and culture do not change for time spans shorter than secular (or multi-secular) time spans, we assume these are fixed for each country. Thus, we complement equation (1) with
(2) 1
. . .e m s sit s c
it it it
A a H
,
where H stands for human capital, cs represents a specific dimension for the quality of institutions (there are m 1 dimensions), a is the effect of omitted factors in explaining TFP, and ,s 0. Equation (2) says that we expect TFP to be higher with
both higher levels of human capital and institutional quality. 2.2. Quality of institutions
For our purposes, we assume that the quality of a country’s institutions can be approximated by a small number of indicators, even if it is a very complex high-dimension reality. Specifically, we assume that each high-dimension s of institutional quality is a scalar given by
(3) 1
.
s
n
sj jit s j sit c c c c
, s= 1, …, m
where cj represents a specific indicator of the quality of institutions, sj is the weight
of this indicator in dimension s, cs is the panel average and c is the standard
deviation of the gross component s (the weighted sum also in the numerator), and we have nm separate, but not necessarily independent, indicators.
We also assume that variables cj tend to be closely related, i.e. that we can
represent the quality of institutions by a small number (m) of variables cs. 2.3. Regulatory quality and legal simplification
Regulatory quality, especially when perceived by an external observer, is one of the dimensions that we have to consider in our set of institutional variables {cs}. Once
Simpler rules are surely easier to understand and to be applied, but they tend to be less specific, incomplete, and/or ambiguous3. However, history may have led the complexity of legal systems to overshoot their optimal level in industrialised countries, as it is apparent in the regulatory reform movement within OECD since the late 1990’s and recently in the European Union with the Better Regulation initiative.
Gorgens et al. (2005) present some evidence that deregulation may foster growth in middle- to high-income countries. Although we cannot perfectly identify legal simplification with deregulation, the involved trade off presents a similar nature. Thus, we can expect legal simplification to promote better regulation in industrialised countries with highly complex legal systems and, through this transmission mechanism, to enhance efficiency at the macroeconomic level.
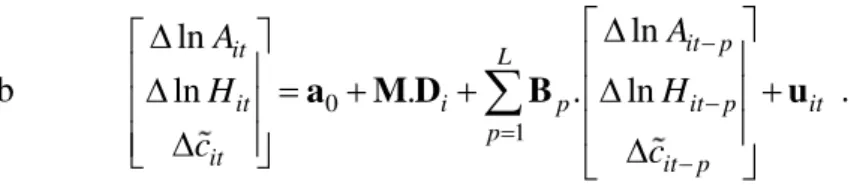
2.4. The dynamic model to be estimated
In order to measure the effect of legal simplification programmes in TFP for a panel of countries, we use equation (2). However, we assume a more complex dynamic interaction amongst TFP, human capital, and the quality of institutions given by a panel-VAR model:
(4)a 0
1
ln ln
ln . . ln
it p
it L
it i p it p it
p
it it p
A A H H c c
a M D B u ,
where a0 is a vector with constants, Di is a vector with country dummies, M is a matrix with country fixed effects, Bp a matrix with auto-regressive coefficients of order p, L is the number of lags used, and uit is a vector of random residual variables.
3.MEASUREMENT ISSUES
In this section we deal with measurement-related problems before presenting the estimation procedure.
3.1. Data sources
We considered a panel of 40 countries for which there is macroeconomic data available in the AMECO database of the European Commission4:
3 See Epstein (2006) for a discussion on the optimal level of complexity of legal rules. Crettez et al.
(2009) provide an explicit economic model to determine the optimal complexity level in a context where international harmonisation may induce substantial gains.
TABLE I
LIST OF COUNTRIES CONSIDERED
Australia Austria Belgium Bulgaria Canada Croatia Cyprus Czech Republic Denmark Estonia Finland France Germany Greece Hungary Iceland Ireland Italy Japan Korea Latvia Lithuania Luxembourg Macedonia FYR Malta Mexico Netherlands New Zealand Norway Poland Portugal Romania Slovakia Slovenia Spain Sweden Switzerland Turkey United Kingdom United States
Data for the institutional components comes from the Worldwide Governance Indicators of World Bank (2010). There are six indicators available for all countries in our sample for years 1996, 1998, 2000, and 2002-20095:
c1 - voice and accountability indicator;
c2 - political stability and absence of violence indicator;
c3 - government effectiveness indicator;
c4 - regulatory quality indicator (RQI);
c5 - rule of law indicator;
c6 - control of corruption indicator.
As a proxy for human capital Barro and Lee (2010) series were taken (average years of schooling of 15 years-old and over). They had to be interpolated since they were available every five years only.
The AMECO database directly provided us data for GDP at 2000 prices, and we converted it to a single currency using the available Power Purchasing Standards exchange rates for the same year. Employment (persons) had no major problem in the same database6.
Net capital stock was available for most of the countries in the sample for all years 1990-2009. For some of them (Australia, Mexico, New Zealand, and Turkey) we were able to complete the time series for recent years using data on investment. However, for Korea, Malta, and former communist countries in Europe, no capital stock was available for the whole period. For the first two countries we were able to obtain the capital-output ratio in 1990 using the data in Nehru and then we used investment data
5 Data for 1997, 1999, and 2001 was obtained by simple linear interpolation.
6 Employment for Macedonia was not available, so we had to use the data from the Conference Board
to obtain the following years7. For the remaining countries we extrapolated their output ratio in 1990 using a simple cross-section OLS regression of capital-output ratios on the logarithm of GDP per capita in 1990 for the countries with available information and then we generated the time series using investment data. The time-series obtained proved robust to simple stability tests of capital-output ratios and also to different strategies of measurement.
3.2. Total factor productivity
To obtain the time series for Ait we only needed equation (1), a value for the
parameter , and the values of Y, K, and L for each pair country-year. Computing the simple arithmetic average for the adjusted wage share in AMECO for the countries and years (from 1990 to 2009) available, we obtained = 0.555.
3.3. The quality of institutions
In order to generate data for the m institutional variables in equation (3) we applied Principal Component Analysis (PCA). Given the fact that we have n = 6 institutional (governance) variables for the 40 countries in the 1996-2009 period and we expect them to be closely correlated, PCA gives a small number of components that comprehend most of the variation observed in these six variables.
We chose factors that are constant across the panel, i.e. unique loadings (sj) for all
countries and periods. In order to do that, we obtained the 1996-2009 average for each indicator (cj) in a country and then used PCA for the time-series average.
TABLE II
PRINCIPAL-COMPONENT ANALYSIS
s 1 2 3 4 5 6
Eigenvalue 5.402 0.356 0.109 0.077 0.031 0.026
s1 1.017 -1.548 0.323 -0.454 -2.686 -6.459
s2 0.915 -4.554 -0.353 0.552 1.153 -3.048
s3 0.980 2.496 -0.697 1.510 -0.710 -1.194
s4 1.000 1.000 1.000 1.000 1.000 1.000
s5 1.028 0.632 -0.149 -1.074 0.338 36.523
s6 1.012 1.626 -0.167 -1.402 1.014 -27.668
NOTE: Loadings were normalised in order to obtain s4 = 1, i.e. the weight of RQI is the unit here.
7 In general we had information on Gross Fixed Capital Formation (GFCF) in real terms and also on
Table II clearly shows that, through the usual criteria, we only need one principal component (m = 1) to represent almost 85 per cent of the variance observed in the six governance indicators that we chose as proxies for institutional quality8. Loadings are stable over time as their standard deviation represents less than 4 per cent of the average when we have time-varying loadings for s = 1.9
Finally, we obtained a single normalised institutional variable to be used in the regression procedure, c given by equation (3), knowing that c equals 6.283 and c is
equal to 3.593. Consequently, a marginal increase on RQI (c4) leads to an increase of
4/c 0.278 on the institutional component c.
4.ESTIMATION
In this section we present the estimation results for the VAR model in equation (2)a. Before proceeding there are two points that need some clarification here. Firstly, this is indeed a Panel Factor-Augmented VAR model since we use the institutional component c as a proxy for the quality of the institutions the panel. Second, given the
fact that our time span is too short to perform formal stationary tests, but there plenty of evidence that TFP and human capital are I(1) processes, and we also expect c to be
I(1) given its cumulative social-capital nature, we estimate the following equation system in first differences instead of (4)a:
(4)b 0
1
ln ln
ln . . ln
it p
it L
it i p it p it
p
it it p
A A H H c c
a M D B u .
So as to identify the shocks we chose a simple Cholesky decomposition using the order above: c is assumed not to contemporaneously respond to shocks in either the
human capital or TFP; H is assumed to contemporaneously respond to shocks in c,
but not in TFP; and A is the least exogenous variable in the VAR. TABLE III
NUMBER OF LAGS CHOSEN ACCORDING TO INFORMATION CRITERIA
8 Considering that we have m = 1, we drop the s subscript on variables from this point onwards.
9 Even ignoring the fact that a second principal component would only explains an extra 6 per cent of
L Akaike Schwarz Hannan-Quinn
0 -13.01 -12.98 -13.00
1 -14.16 -14.03** -14.11**
2 -14.16 -13.94 -14.07
3 -14.18 -13.86 -14.06
4 -14.25** -13.82 -14.079
NOTE: (**) indicates the number of lags chosen for a significance level of 5 per cent.
Table III shows us that, according to two criteria, we should opt for L = 1, i.e. a single lag in the VAR. Considering that and also the fact that the available time span is not enough for a very demanding four-lag structure, according to the Akaike criterion, we chose the more parsimonious specification.
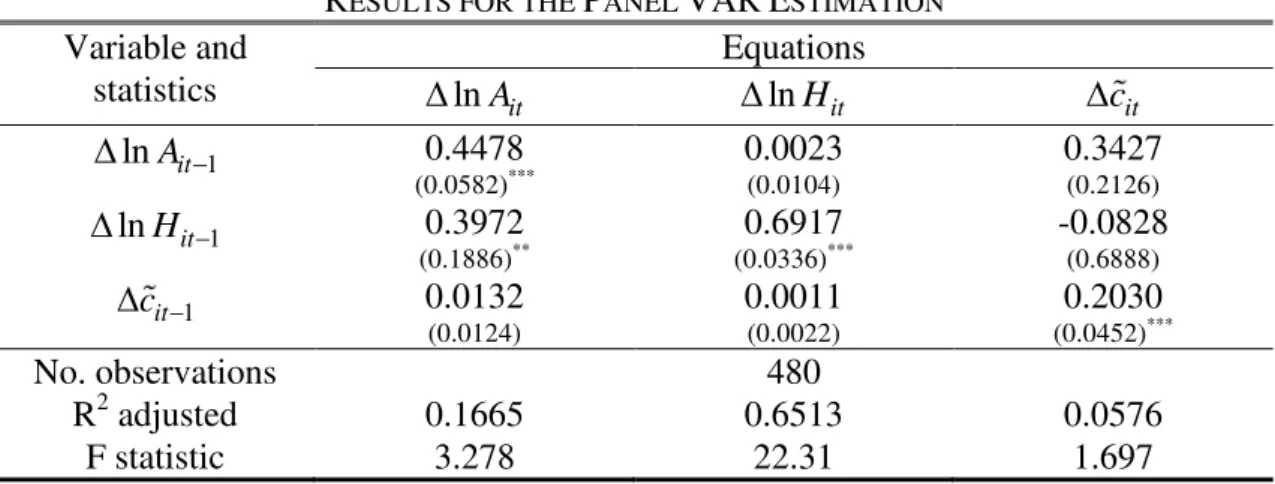
TABLE IV
RESULTS FOR THE PANEL VARESTIMATION
Variable and statistics
Equations lnAit
lnHit cit
1 lnAit
0.4478
(0.0582)*** 0.0023 (0.0104) 0.3427 (0.2126) 1
lnHit
0.3972
(0.1886)** (0.0336)0.6917 *** -0.0828 (0.6888) 1
it
c
0.0132
(0.0124)
0.0011 (0.0022)
0.2030 (0.0452)***
No. observations 480
R2 adjusted 0.1665 0.6513 0.0576
F statistic 3.278 22.31 1.697
NOTES: Standard errors in brackets; (***) represents a significance level of 1 per cent; (**) represents a significance level of 5 per cent.
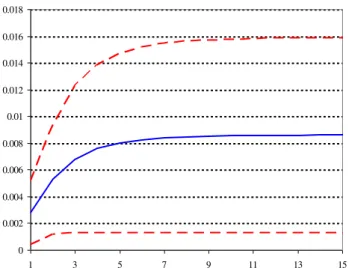
0 0.002 0.004 0.006 0.008 0.01 0.012 0.014 0.016 0.018
1 3 5 7 9 11 13 15
FIGURE 1–Cumulated Response of ln Ait to a Standard-Deviation Impulse in cit-
2 Standard-Deviation Bands
Figure 1 presents the cumulated response of TFP to a sustained increase in the governance variable of one standard deviation, i.e. of approximately 0.1, for c. We can easily observe the short-run semi-elasticity is equal to 0.0274 and its long-run counterpart is equal to 0.0855. In any case, we always obtain a positive effect of a permanent increase in the institutional component, as the lower band is above zero for all the periods considered. Therefore, if a LSP is put in place and it leads to a permanent increase in the quality of the institutions, we can expect it to have a significant impact on TFP in the long run.
These results were confirmed by single-equation panel models (either with fixed and random effects) that are in line with the estimates presented here. In those simpler models the short-run elasticity tends to be larger, but the long-run effect is smaller10, but their bands are always contained in the VAR impulse-response bands. The reason why the long-run effect is larger in the VAR model is also interesting in terms of economic interpretation: better institutions (due to better regulation) have a direct efficiency effect on TFP, but they also stimulate human-capital accumulation. Thus, the joint effect of a larger c and a larger H is substantially larger (more than 50 per cent larger) than in models that ignore the role of this transmission mechanism.
10 The econometric results are not presented here due to space constraints and to the fact that we
5.IDENTIFYING THE EFFECT OF LEGAL-SIMPLIFICATION PROGRAMMES
Up to this point we know that a permanent increase in the RQI leads to a 0.278 increase in the overall institutional quality and this improvement leads to a long-run increase in TFP of 2.39 per cent, on average.
However, if we want to identify the impact of LSPs on regulatory quality we have to resort to a more laborious approach. Our identification mechanism can be described in two steps: first, we look for ‘candidates’ in the data, i.e. ‘abnormal’ jumps in the RQI; then, we look for evidence in the available literature of any existing LSP that can be associated with the above-mentioned jump.
Let us concentrate on the first step for the moment. Considering the short time dimension of our sample, we cannot seriously perform statistical tests on the characteristics of the stochastic process ruling c4, e.g. unit-root tests. Thus, we assume the institutional component follows a random walk, i.e. c4it = it, where it is a
white-noise disturbance with zero expected value and a finite variance. This random disturbance can be seen as the sum of two distinct innovations: (i) measurement error in the ‘true’ regulatory-quality level, for which we assume there is a small variance11, and (ii) structural changes in the ‘true’ quality of regulation due to programmes or policies directed to this variable12.
We looked at the data to find episodes for which it is positive and larger than two
standard deviations from the country average. Column it in Table V gives us the
magnitude of the increase in the RQI for the episodes identified. These are the candidates to LSPs to be explored in the second step of the procedure.
11 Assessment panels vary over time and their perceptions may be contaminated by transitory events not related to changes in the ‘true’ regulatory quality of a country in a specific year.
TABLE V
EPISODES OF ABNORMAL INCREASE IN RQI AND LSPS
Country (i) Year (t) it LSP
Bulgaria 2001-2* 0.191 No
Canada 1997-8* 0.284 Yes
Denmark 1997-8* 0.218 Yes
Estonia 2007 0.092 No
Finland 1997-8* 0.325 Yes
France 2003 0.187 Yes
Ireland 2006 0.284 Yes
Japan 2003 0.480 Yes
Macedonia 2004 0.197 No
Malta 2009 0.139 Yes
Netherlands 1997-8* 0.269 Yes
Poland 2004 0.143 No
2009 0.136 Yes
NOTE: (*) data for 1997, 1999, and 2001 was obtained by interpolation, which implies that these years cannot be identified in isolation.
For the second step in our procedure, we explored the literature on the subject, mainly the OECD Reviews on Regulatory Reform and the assessment reports of the Better Regulation in Europe programme of the European Commission. We analysed the sources available for specific programmes or policies that share at least some of the features we identified with a LSP and were implemented in these years or in the short periods that preceded them. A detailed explanation is presented in the Appendix and the main sources for each country were:
Bulgaria, 2001-2: references not found.
Canada, 1997-8: OECD (2002).
Denmark, 1997-8: OECD (2000).
Estonia, 2007: European Commission (2006b), OECD (2006), Sigma (2006a).
Finland, 1997-8: OECD (2003), OECD (2010a).
France, 2003: OECD (2004b), OECD (2010b).
Ireland, 2006: OECD (2010c).
Japan, 2003: OECD (2004a).
Macedonia, 2004: Sigma (2009).
Malta, 2009: Ministry of Finance (2008).
Netherlands, 1997-8: OECD (1999), OECD (2010d).
According to the qualitative analysis developed, the last column in Table V identifies which of the episodes are considered to be a consequence of an explicit LSP and which ones cannot be considered as such. Thus, we have 9 episodes that, in our opinion, correspond to LSPs, inducing an increase in the RQI of 0.258, on average13.
Considering v4 = 0.258, we can expect it to have an impact on the institutional component given by c 0.072 and therefore it leads to a 0.6 per cent long-run increase in TFP. Even if we consider the VAR wide bands, the effect ranges from 0.1 per cent to 1.1 per cent14.
We can then conclude that, considering the implementation costs of LSPs are not usually high, the efficiency gains of the sustained increase in regulatory quality, as perceived by economic agents, are positive and statistically significant.
6.CONCLUSIONS
In this article we use a Factor-Augmented VAR approach for a panel of 40 countries from 1996 to 2009 in order to measure the long-run impact of legal-simplification programmes in total factor productivity. We identify policy shocks using data on regulatory quality, within a broader index of institutional quality, and exploring qualitative information publicly available.
The main conclusion is that if a legal-simplification programme is put in place, leading to a permanent increase in the quality of the institutions, we can expect it to have a significant long-run impact on total factor productivity of 0.6 per cent, on average, ranging from 0.1 per cent to 1.1 per cent, with two standard-deviation bands. Therefore, if the costs of implementing this type of programmes are not high, they show a statistically significant effect at the macroeconomic level, as predicted by theory and in line with the international regulatory reform agenda.
ISEG (School of Economics and Management) of the Technical University of
Lisbon and UECE (Research Unit on Complexity and Economics).
13 The standard deviation equals 0.106. 14 An increase in v
4 one standard deviation above or below is average implies an increase in TFP that
APPENDIX
Bulgaria (2001-2)
There is not enough information on a LSP that could have taken place in Bulgaria the years 2001-2 or in the later years of the last millennium.
Following Bulgaria’s application to EU membership in December 1995, the 1999 report recommended opening formal negotiations, which happened in the following year. Most of then chapters were closed by 2004 and by the end of the same year it was decided that Bulgaria would become a member in January 2007. Therefore, it is most likely that the qualitative jump observed in 2001-2 was due to the adaptation of the Bulgarian legal system to EU requirements and not to a LSP.
Canada (1997-8)
According to OECD (2002), we can find the following developments in the neighbourhood of 1997-8 for Canada15:
TABLE A1
EVOLUTION OF CANADA’S REGULATORY POLICIES
Date Objective Focus of reform Mechanisms
1995 greatest net benefit to Canadians
reducing regulatory burden on small business
oversight
consultation/working in partnership with stakeholders
compliance and enforcement policies
alternative compliance
inter-governmental coordination
Regulatory Process Management Standards
1997 demonstrate links between policies (including regulations)
and actual outcomes.
performance assessment of regulations.
under the Improved Reporting to Parliament Project, requirement for two
annual departmental Reports: (1) Plans and
Priorities and (2) Performance Reports, both tabled in
Parliament.
Furthermore, the same document refers that “[a]n explicit Regulatory Policy was issued in 1986, and revised in 1992, 1995 and 1999. The other two policies, Responsive Regulation in 1993 and Results for Canadiansin 1997, were not designated Regulatory Policies but had just as profound effects on the government’s approach to regulation-making”16.
15 Op. cit. Table 1, p. 9.
There was a strong trend towards a reduction in the number of regulations in the second half of the 1990’s, as we can observe in the same document: “(…) the trend in the number of primary laws passed by the federal government over the decade of the 1990s (…) shows a peak of 51 laws being passed in 1992, with a low of 32 being reached in 1999 and only a slight rise, to 35, in 2000”17.
The usage of manuals and systematic regulation design is also referred in the same report: “The Department of Justice has also supplemented the compliance guidebook with the 1998 publication Designing Regulatory Laws that Work. This document contains practical advice on enforcement and compliance options, as alternatives to criminal law-based options. The manual identifies enforcement alternatives to the traditional ‘command-and-control’ approaches to regulation, and provides strategic advice on the appropriateness of alternative approaches to a range of regulatory situations and provides legislative precedents for each option”18.
Denmark (1997-8)
According to OECD (2000), we can find the following developments in the neighbourhood of 1997-8 for Denmark.
Following the election of the new coalition government in March 1998, Denmark re-launched a reform programme with a much heavier political weight than its predecessors. “The improvement of regulatory quality was declared to be a high priority of the government in its coalition agreement and the twin themes of improving quality by better regulatory management and planning and by introducing a regulatory checklist and improving business regulation and market openness were identified. This represents a significant shift toward a more strategic and integrated basis for reform policy”19.
Within the Framework of this programme, a four-element strategy is launched in September 1998:
“- Strengthening the law-drafting process.
- Examining and increasing the use of alternatives to traditional regulation to ensure flexible and effective regulation.
- Strengthening and improving regulatory impact analysis. - Reducing administrative burdens on business”20.
17 Op. cit. p. 13.
In 1998 the Regulation Committee is created and its estimated outcome is a reduction of 25 per cent in the legislative agenda.
Concerning clarity and simplicity, a Prime-Minister circular dated November 1998 “(…) sets out rules for the content of explanatory notes for regulations, and requires the Ministry of Justice to intensify its efforts in ensuring the use of “plain language.” Another circular, dated 16 September 1998, sets out requirements for drafting of explanatory notes. Substantive checking includes checking consistency with the constitution and with other legislation (…)”21.
In what concerns transparency and accessibility, from January 1998 onwards, access to the Legal Information Database via internet was free22.
On the Spring of 1998, in relation to the field of Regulatory Impact Assessment (RIA), the Prime-Minister’s Office “(…) revised its circular on law-drafting to incorporate assessments of administrative costs for businesses and citizens, as well as a requirement that ministries use RIA and document the results in the explanatory notes that accompany draft laws. With this last 1998 revision, independent scrutiny of RIA was possible for the first time and with it the first opportunity for RIA to have a real effect on policy outcomes”23.
ESTONIA (2007)
This is not one of the countries followed by OECD in both Regulatory Reform in OECD Countries andRegulation in Europe reports, so the qualitative information available is scarcer. Considering Estonia become a member state of EU in 2004, the explanation used for the statistical outlier detected for Bulgaria in 2001-2 cannot be used here.
According to Sigma (2006a), developed by the joint OECD and EU Sigma (Support for Improvement in Governance and Management) initiative for Estonia, the main goal of the policy to improve regulatory quality was “(…) to react to the changes in society and to never stop improving.” In the short OECD (2006) report we can notice that the main focus of this type of policy was access to legislation, namely through information and communication technologies. “In Estonia, the whole process of law-drafting at government level can be followed by anyone who is interested via the Internet-based electronic co-ordination system called e-law (e-õigus)”24. The benefits of the de-materialisation process in the law-making
21 Op. cit. p. 21.
process are not confined to paper and time savings, but are an important step for the access of the general public and also for the transparency in the process itself.
Considering European Commission (2006b), we can observe that this country was already pointed as a good example in 2005, namely in what concerns the above-mentioned e-law system and in the importance given to clear language in the legislative process (creation and transposition). We can also find, in the same document, that “Estonia had the advantages of being a small country and being able to learn from the experience of others”25.
In the absence of further information, we have to conclude that the RQI improvement detected in 2007 for Estonia cannot be due to a LSP implemented in 2007 or in the immediately preceding years.
Finland (1997-8)
Finland ascended to the EU in 1995. However, contrary to other countries with less developed institutions (e.g. Bulgaria), regulatory reform already had a great tradition in this country prior to becoming a member state.
According to OECD (2010a), we can find the following developments in the neighbourhood of 1997-8 for Finland.
The year 1996 represents a turning point in the strategy and policies aiming at regulatory quality in Finland. The Finnish government launched a formal regulation policy for the first time in that year26. We can find the initiatives below amongst the milestones of the Better Regulation policy that exhibits the features of a LSP in 1996 and 1998:
“1996 SME policy programme.
Government resolution to establish programme to improve law drafting.
Law Drafter’s Guide.
1998 Instructions for Assessing the Economic and the Environmental Impacts of Legislation.
Finnish Checklist: Quality Requirements of Proper Law Drafting”27.
Still in 1998 we can notice the creation of the “Ad hoc High-level Working Group on Legislative Policy established to prepare the Government Legislative Policy”28, with the objective of coordinating the Better Regulation networks in the country.
25 Op. cit. p. 2.
In OECD (2003) we can also find explicit references to the importance of the Programme of the Government to Improve Law Drafting (1996)29, of the Finnish Checklist (1998), and of above-mentioned working group.
France (2003)
According to OECD (2010b), we can find the following developments in the neighbourhood of 2003 for France.
In what concerns the management of the French legal framework rationalisation, “[s]ince 2003, annual simplification laws have embedded simplification in the French political landscape”30. This procedure seems to have helped the reduction in the number of laws and of the administrative costs for households and firms. Apparently, the main steps on this direction were the diffusion of legal instruments via the Légifrance portal launched in August 2002 and the Enabling Law for Legislative Simplification of July 200331.
This movement towards simplification that started in 2003 has apparently continued in 2004, 2007, 2008, and 200932 (p. 41). In 2003 the Delegation for Users and Administrative Simplifications and the Agency for Developing e-Government were created. Both institutions, jointly with the Delegation for Modernising Public Administration and State Organisations, would play a central role in the Better Regulation policies in France33.
The Mandelkern report of 2002 is an important milestone concerning the regulatory quality assessment.
Despite the significant change that took place in 2003, the report points towards a larger importance of the most recent period in the development of strategies and policies directed to regulatory quality, “(…)in contrast to the significant lack of progress apparent in 2003/04”34.
Still, we can assess the importance of the 2003 reforms at that moment by analysing OECD (2004b): “A more consistent approach to reforming the State and modernising the quality of regulations is just emerging, (…) This movement has been expanded with the reforms announced since the beginning of 2003. The law enabling the government to simplify the legal system through edicts adopted in July will enable wide-ranging simplification of
29 A second programme would be launched in 2000. 30 Op. cit. p. 19.
administration for the first time, right up to the legislative level. This is supplemented by efforts to speed up e-government and by the modernisation of financial regulations following the law adopted on 1st August 2003”35.
Ireland (2006)
According to OECD (2010c), we can find the following developments in the neighbourhood of 2006 for Ireland.
First, we have to refer the White Paper Regulating Better published in 2004 that sets the six fundamental principals of the Better Regulation policy and an agenda with fifty specific actions in five areas36.
The Better Regulation unit, created in 2001, establishes a set of public consultation guidelines in 2005, aiming to apply the best practices37. In the same year, government requires RIA for all levels of the Administration38 and launches the guidelines for that procedure39.
Concerning the importance of this type of policies for the firms, we can also notice the creation of the Small Business Forum and the Business Regulation Forum, both in 2005.
The year 2006 seems to be important for the implementation of the initiatives developed in the two previous years. Special attention is due to the launching of training programmes in areas such as Legislative Process, Policy Analysis, or RIA40.
Japan (2003)
According to OECD (2004a), we can find the following developments in the neighbourhood of 2003 for Japan.
“The review of existing regulations and administrative simplification measures is underway but the process is incomplete, Japan’s e-government policy aims to make all existing administrative procedures and transactions possible through the internet. By April 2004, 97% of all procedures handled by the national government (around 13 000) were
35 Op. cit. p. 11.
36 Op. cit. p. 14. 37 Op. cit. p. 20. 38 Op. cit. p. 21. 39 Op. cit. p. 49.
40 Additional training in the areas of Statutory Instruments, Public Financial Management, or the Standard Cost
available online”41. Notwithstanding the dates of the report and of the shock identified being so close, there is an explicit mention to the enormous progress observed in Japan since the previous assessment in 1999.
We can also find an interesting reference to the Special Zones Programme, approved in 2002, where the legislative-reform experiments initiated at the local level were assessed in order to consider their value at the national level. The first special zones were created in April 2003 and had a huge success “generating hundreds of proposals, many of which have been implemented locally, and eventually nationally”42.
In the field of competition regulation we can find an example of how legal simplification promoted transparency, as there is a reference to the fact that “the list of systems of exemption from the Anti Monopoly Act had been reduced from 57 in 1999 to 21 at the end of 2003”43.
One should also notice that a Policy Evaluation System was introduced in 2002 and, according to OECD, it “(…) has the potential to improve the reflection of regulatory measures in budgetary and organisational consequences”44.
The perceptions present in our indicator may have also been affected by the announcement of the Regulatory Reform Programme in March 2003, which had the objective of demonstrating the willingness of the Japanese government to improve and to correct the deficiencies detected45.
Macedonia (2004)
There is not enough information on a LSP that could have taken place in Macedonia in 2004 or in the years that immediately preceded it.
According to Sigma (2009), “Macedonia does not have an explicit policy on better regulation However, a number of elements of a better regulation policy have been put in place”46.
41 Op. cit. p. 9.
Macedonia officially applied to EU membership in December 2005. Therefore, it is most likely that the qualitative jump observed in 2004 was due to the adaptation of the Macedonian legal system to EU requirements and not to a LSP.
Malta (2009)
Malta became an EU member state in May 2005. In face of that, we can discard the hypothesis of the outlier detected is due to a structural change produced by the ascension process.
The Better Regulation Unit was created in 2006, as a consequence of the EU-wide strategy, within the Office of the Prime Minister47. In 2008 the government approved the strategy for the period 2008-10 in this area with the following aims:
“continue simplifying and improving existing regulation;
ensure the better design of new regulation;
reinforce the value that regulation should not only be effective but also proportionate;
ensure that the effort is sustained in the long-term;
design and apply better regulation tools and good practice; and
promote a cultural change.”
In Ministry of Finance (2008) we find an explicit reference to the Better Regulation policy as a structural measure to support demand and to promote the resilience of the country48.
Thus, we can assume there is a link between the qualitative jump observed in variable c4 for this country in 2009 and the 2008 strategy, implemented in the following year.
Netherlands (1997-8)
According to OECD (2010d), we can find the following developments in the neighbourhood of 1997-8 for the Netherlands.
The launching in 1994 of the Market Forces, Deregulation and Legislative Quality (MDW) programme was an important milestone in Dutch Better Regulation policy. A second phase of this programme (MDW2) “started in the late 1990s [1998-9], with growing emphasis on the reduction of administrative burdens for business, Better Regulation’s link with economic
47 See http://www.bru.gov.mt.
performance was re-emphasised in the Coalition Agreement that guides government policy making today, which promotes a more innovative, enterprising and competitive economy”49.
OECD (1999) adds the coming into force in 1998 of the new competition regulation as one of the milestones in Dutch regulatory reform50.
The Netherlands is even seen as an example in this area within the EU and even one of the drivers of Better Regulation policies: “On the other hand, Dutch policy makers have expressed frustration with aspects of the European regulatory structure, arguing inter alia that it has tended to inhibit their efforts to adopt alternatives to traditional regulation in some areas. Concerns over technical quality issues lead the Netherlands to focus on legislative quality as a major topic of its 1997 Presidency of the EU. This led to an intensified programme of work within the European Commission to improve the quality of European legislation and, has been followed-up by the subsequent British and Austrian Presidencies in 1998”51.
Concerning the institutions responsible for implementing these policies, an extremely radical reform took place in 1997, following a few more limited reforms in the previous decades. More than one hundred advisory boards were eliminated and substituted by a single advisory board within each ministry52.
Poland (2004 and 2009)
Poland became an EU member state in May 2004 and that fact is a plausible candidate to explain the qualitative jump observed in the same year, instead of a LSP, considering the necessary convergence process needed for ascension.
However, in Wiener (2006) Poland is already identified as one of the top performing countries in the areas of Better Regulation and RIA, together with Denmark and the UK53. According to Ministry of Treasury (2010), the Polish government uses RIA since 2004, as an element of the legislative process. Training of the officials in the impact-assessment techniques started in 2007, but it peaks in 2009-11.
Sigma (2006b) also offers clear references to the commitment of the Polish government in giving priority to the Better Regulation policy within the Regulatory Reform Programme announced in July 2006 with the following main features:
49 Op. cit. p. 13.
“Identification and implementation of legislative solutions for simplification of domestic regulation and that of the acquis communautaire.
Improvement of the system of transposing directives.
Reduction of administrative burdens.
Improvement of the RIA system, and
Strengthening the regulatory management capacities of government”54.
We can also take into account European Banking Federation (2007) that states the following, referring to Poland: “The government set up a Modern Business Regulation Task Force in February 2006. The Task Force prepared ‘The Programme for Regulation Reform’ adopted by the government in August 2006. ‘The Programme for Regulation Reform’ set up a detailed timetable for creation of the system of measuring of administrative burdens. ‘The Programme for Regulation Reform’ suggested reshaping the current rules of Impact Assessment preparation dating from 2001 as they clearly do not fulfil the expectations they were destined to meet. The revamped Impact Assessment Rules are to be used as well for projects of European legislation. Finally ‘The Programme for Regulation Reform’ dealt with the improper implementation of EU Directives indicating that ‘gold plating’, ‘double-banking’ and ‘regulatory creep’are to be avoided to the greatest possible extent”55.
Kaluzynska (2008) apparently reinforces the position above when she states that “[f]rom 2006, an explicit Better Regulation strategy has been put in place in Poland,” despite the fact that some steps had already been taken in that direction in 2004-5, such as the adoption of the Standard Cost Model56.
For the most recent period we found it very difficult to find independent information. Still, Ministry of Treasury (2010) clearly refers that in “(…) March 2008 Polish Government adopted targets for cutting red tape in seven selected priority areas of law until the end of 2010. The reduction in priority areas will not be the final step in this process. The Ministry of Economy is in the process of preparing a reduction scheme for the whole field of economic law”57, additionally to the new Regulatory Reform Programme prepared for 2010-11.
Using the available information, it is difficult to identify both shocks, but we can conclude the following:
i) The 2004 increase in v4 does not seem to be the result of a LSP adopted in that year or the immediately preceding ones. Apparently it is due to the combination
of several isolated initiatives within the Better Regulation policy framework, for which the implementation date is not clear. Therefore, the excellent position of Poland in the ranking of Wiener (2006) is not considered here as a consequence of an explicit LSP.
References
Arruñada B.: "Pitfalls to Avoid when Measuring the Institutional Environment: Is ‘Doing Business’ damaging business?" Journal of Comparative Economics, 35 (2007), 729-747.
Arruñada B.: “Institutional Support of the Firm: A theory of business registries" Journal of Legal Analysis, 2 (2010), 525-576.
Barro R. and J.-W. Lee: "A New Data Set of Educational Attainment in the World, 1950-2010," NBER Working Papers, 15902 (2010).
Barro, R. and X. Sala-i-Martin: Economic Growth. 2nd. New York: McGraw-Hill, 2003.
Conference Board (2011). Total Economy Database [Database], January 2011. Groningen: Groningen Growth and Development Centre. Available at:
http://www.conference-board.org/data/economydatabase/#files.
Crettez B., B. Deffains, and R. Deloche: "On the Optimal Complexity of Law and Legal Rules Harmonization," European Journal of Law and Economics, 27 (2009), 129-142.
Davis K. and M. Kruse: "Taking the Measure of Law: The Case of the Doing Business Project." Law & Social Enquiry, 32 (2007), 1095-1119.
Epstein, R.: "The Optimal Complexity of Legal Rules," in Heuristics and the Law, Ed. by G. Gigerenzer and C. Engel. Cambridge, Mass.: MIT Press, 2006.
European Banking Federation: Better Regulation and Impact Assessment. Brussels: European Banking Federation, 2007. Available at: http://www.ebf-fbe.eu/uploads/documents/publications/Reports/Better%20Regulation/Better_Regu lation_EBFReport_2007-2007-02318-01-E.pdf.
European Commission: Better Regulation - Simply explained. Brussels: European
Communities, 2006a. Available at:
European Commission: Quality of Legislation: Estonian Perspectives - Legal Revisers Group Summary Report. Brussels: European Commission, 2006b . Available at: http://ec.europa.eu/dgs/legal_service/seminars/estonia_summary.pdf.
Gorgens T., M. Paldam, and A. Würtz: "Growth, Income and Regulation: A non-linear approach," Centre for Applied Microeconometrics Working Papers, 12 (2005).
Hall R. and C. Jones: "Why Do Some Countries Produce So Much More Output Per Worker Than Others?" Quarterly Journal of Economics, 114 (1999), 83-116. Kaluzynska, M.: How Effective Are Administrative Simplification Policies? Actions
for Reducing Administrative Burdens; Role of an Overall Administrative
Procedure Legal Framework; Factors of Success and Failure. Ankara: Sigma Seminar on Administrative Simplification, 2008. Available at: http://www.oecd.org/dataoecd/40/36/41326322.pdf.
Ministry of Finance, the Economy and Investment: Malta Update of Stability Programme 2008-11 - Addendum. Valetta: Ministry of Finance, the Economy and Investment - Government of Malta, 2008. Available at: http://finance.gov.mt/image.aspx?site=EPOL&ref=Update%20of%20Stability%20 Programme%202008-2011%20-%20Addendum.
Ministry of Treasury: Business Spring in Poland. Warsaw: Ministry of Treasury -
Government of Poland, 2010. Available at:
http://www.paiz.gov.pl/files/?id_plik=12820.
OECD: Regulatory Reform in the Netherlands: Government Capacity to Assure High Quality Regulation. Paris: OECD, 99. Available at: http://www.oecd.org/dataoecd/44/39/2507037.pdf.
OECD: Regulatory Reform in Denmark: Government Capacity to Assure High Quality Regulation. Paris: OECD, 2000. Available at: http://www.oecd.org/dataoecd/31/55/2510615.pdf.
OECD: Regulatory Reform in Finland: Government Capacity to Assure High Quality Regulation. Paris: OECD, 2003. Available at: http://www.oecd.org/dataoecd/32/52/2510133.pdf.
OECD: Japan: Progress in Implementing Regulatory Reform - OECD Reviews on Regulatory Reform. Paris: OECD, 2004a.
OECD: Regulatory Reform in France: Government Capacity to Assure High Quality Regulation. Paris: OECD, 2004b. Available at: http://www.oecd.org/dataoecd/50/42/32910612.pdf.
OECD: Better Regulation in Estonia. Paris: OECD, 2006. Available at: http://www.sigmaweb.org/dataoecd/42/41/36825253.pdf.
OECD: Better Regulation in Europe: Finland. Paris: OECD, 2010a . Available at: http://www.oecd.org/dataoecd/62/25/45090005.pdf.
OECD: Better Regulation in Europe: France. Paris: OECD, 2010b. Available at: http://www.oecd.org/dataoecd/30/5/45706677.pdf.
OECD: Better Regulation in Europe: Ireland. Paris: OECD, 2010c . Available at: http://www.oecd.org/dataoecd/6/10/46271933.pdf.
OECD: Better Regulation in Europe: Netherlands. Paris: OECD, 2010d. Available at: http://www.oecd.org/dataoecd/62/8/44912418.pdf.
Ramey V. and M. Shapiro: "Costly Capital Reallocation and the Effects of Government Spending," Carnegie-Rochester Conference Series on Public Policy, 48 (1998), 145-194.
Romer C. and D. Romer: "Does Monetary Policy Matter: A new test in the spirit of Friedman and Schwartz," NBER Macroeconomics Annual, 4 (1989), 121-184.
Sigma: Better Regulation: The Perspective of New EU Member States. Sigma Update 13, 2006a. Available at: http://www.oecd.org/dataoecd/42/10/36824580.pdf.
Sigma: Report on Regulatory Management Capacities in Poland. Paris: Sigma, 2006b. Available at: http://www.mg.gov.pl/NR/rdonlyres/9A6DB1C7-95ED-4404-AE79-D1FCE0678A13/28746/sigma.pdf.
Wiener J.: "Better Regulation in Europe," Current Legal Problems, 59 (2006), 447-518.
World Bank (2010). Worldwide Governance Indicators [Database], November 2010.
Washington: World Bank. Available at:
http://info.worldbank.org/governance/wgi/index.asp.
World Bank: Doing Business 2012: Doing business in a more transparent world.
Washington: World Bank, 2012. Available at: