Accepted Manuscript
Title: Effects of 10 min vs. 20 min passive rest after warm-up on 100 m freestyle time-trial performance: a randomized crossover study
Author: Henrique P. Neiva M´ario C. Marques Tiago M. Barbosa Mikel Izquierdo Jo˜ao L. Viana Daniel A. Marinho
PII: S1440-2440(16)30059-7
DOI: http://dx.doi.org/doi:10.1016/j.jsams.2016.04.012
Reference: JSAMS 1324
To appear in: Journal of Science and Medicine in Sport Received date: 4-6-2015
Revised date: 8-4-2016 Accepted date: 30-4-2016
Please cite this article as: Neiva HP, Marques MC, Barbosa TM, Izquierdo M, Viana JL, Marinho DA, Effects of 10<ce:hsp sp=¨0.25¨/>min vs. 20<ce:hsp sp=¨0.25¨/>min passive rest after warm-up on 100<ce:hsp sp=¨0.25¨/>m freestyle time-trial performance: a randomized crossover study, Journal of Science and Medicine in Sport (2016), http://dx.doi.org/10.1016/j.jsams.2016.04.012
This is a PDF file of an unedited manuscript that has been accepted for publication. As a service to our customers we are providing this early version of the manuscript. The manuscript will undergo copyediting, typesetting, and review of the resulting proof before it is published in its final form. Please note that during the production process errors may be discovered which could affect the content, and all legal disclaimers that apply to the journal pertain.
Accepted Manuscript
Effects of 10 min vs. 20 min passive rest after warm-up on 100 m freestyle time-trial
1
performance: a randomized crossover study
2 3
Henrique P. Neiva
1, 2, Mário C. Marques
1, 2, Tiago M. Barbosa
2, 3, Mikel Izquierdo
4, João L.
4Viana
2, 5, Daniel A. Marinho
1, 2 56
1
University of Beira Interior, Department of Sport Sciences, Covilhã, Portugal
7
2
Research Center in Sport Sciences, Health Sciences and Human Development, CIDESD,
8
Portugal
93
National Institute of Education, Nanyang Technological University, Singapore
10
4
Department of Health Sciences, Public University of Navarre, Navarre, Spain.
11
5
University Institute of Maia, ISMAI, Maia, Portugal
12 13
Original Investigation
1415
Corresponding Author and address:
16Mikel Izquierdo, PhD
17Department of Health Sciences
18Public University of Navarra (Navarra) SPAIN
19Accepted Manuscript
Campus of Tudela
20Av. de Tarazona s/n. 31500 Tudela (Navarra) SPAIN
21Tel + 34 948 417876
22[email protected]
23 24 25Manuscript Word count: 2981
26Abstract word count: 209
27Number of Tables: 2
28 Number of Figures: 1 29 30Accepted Manuscript
50
Abstract 51
Objectives: The aim of this study was to compare the effect of 10min vs. 20min passive rest post 52
warm-up on performance in a 100 m freestyle time-trial. 53
Design: Randomized crossover. 54
Methods: Eleven competitive male swimmers performed two experimental trials on different days, 55
consisting of 100 m freestyle time-trials following 10min or 20min passive rest after a standard 1,200 56
m warm-up. Performance (time-trial), biomechanical (stroke length, stroke frequency, stroke index, 57
propelling efficiency), physiological (blood lactate concentrations, heart rate, core and tympanic 58
temperature), and psychophysiological (perceived effort) variables were assessed during both trials. 59
Results: Time-trial performance was faster after 10min as opposed to 20min passive rest (58.41±1.99s 60
vs. 59.06±1.86, p<0.01). This was supported by strong effect sizes (d=0.99) and the qualitative 61
indication of “likely” positive effects. Heart rate before the time-trial was also higher after 10 min 62
passive rest (89±12bpm vs. 82±13bpm; p<0.01). Furthermore, net core temperature and oxygen uptake 63
values before the time-trial were substantially lower after 20min passive rest. 64
Conclusions: These data suggest that the 10min post warm-up passive rest enhances 100 m freestyle 65
performance when compared to a 20min period. An improvement that appears to be mediated by the 66
combined effects of a shorter post warm-up period on core temperature, heart rate and oxygen uptake. 67
68
Keywords: Sports Performance; Pre-exercise; Swimming; Heart Rate; Temperature. 69
Accepted Manuscript
70
Introduction 71
72
Warming-up before training or competition has become one of the most interesting topics for coaches, 73
swimmers and researchers in the last few years.1-3 Studies have described physiological adaptations to
74
warm-up that theoretically support a positive effect of warm-up on subsequent performance; these 75
effects are mostly linked to an increase in body temperature.4,5 For instance, warm-up causes faster
76
oxygen dissociation from hemoglobin, acceleration of metabolic reactions and nerve conduction rate, 77
and reduced muscle and joint resistance.4 Besides the effects on body temperature, priming physical
78
activities might also exert additional effects that benefit performance, such as elevated baseline 79
oxygen uptake (VO2) and increased amplitude of the primary VO₂ response to subsequent exercise.6
80
81
In swimming, it was only recently that evidence of the positive effects of warm-up on performance has 82
started to emerge. Studies found that swimmers were 1.5% faster in the 100m freestyle7 and were able
83
to apply 11.5% more propelling force during a 30s all-out freestyle when warm-up was perfomed.8
84
However, only a few studies have focused on the warm-up structure.1,2,9 The duration of the rest
85
interval separating the warm-up from the main high intensity task appears to be critical for subsequent 86
performance. It might seem obvious that one should aim to maintain the increased metabolic rate 87
achieved during warm-up,10 but in competition, a period of time is also needed to accomplish all
88
official requirements before the race. Zochowski et al.9 reported that 200m time-trial swim
89
performance was 1.38% faster after 10min passive rest compared to 45min. Using a longer rest period, 90
West et al.2 verified that 200m time-trial swim performance times were 1.48% faster after a 20min
91
passive rest compared to 45min. Higher core temperature (Tcore)2 and higher heart rate at the
92
beginning of the race, which potentially increased baseline oxygen consumption,9 were the main
Accepted Manuscript
mechanisms associated with the improved performance following shorter passive rest intervals. A 94
main limitation of these studies is the longer duration of the rest period used, i.e. 45 min, which might 95
even be too long to simulate a real competition. In addition, both studies focused on 200m time-trial 96
performance and did not measure VO2 or biomechanical responses.
97 98
To the best of our knowledge, studies to date have only focused on the effects of different post warm-99
up intervals in the 200m race, assessing few physiological parameters and disregarding hypothetical 100
biomechanical responses. Moreover, other racing distances might demand different passive rest 101
periods. For instance, the 100m freestyle involves a different use of metabolic pathways, with a lower 102
aerobic contribution than the 200m and perhaps less dependence on higher pre-trial VO2.29 In addition,
103
the majority of studies investigating the effects of warm-up on swimming performance have used a 104
standard 10min interval, but their findings can only be fully understood if one knows how different 105
recovery periods could influence the results. Therefore, the aim of the present study was to compare 106
the effects of two different post warm-up intervals (10 and 20min rest) on 100m freestyle 107
performance. Performance, biomechanical, physiological and psychophysiological responses were 108
investigated. It was hypothesized that the shorter passive rest period would result in better swimming 109 performance. 110 111 Methods 112 113
Eleven competitive male swimmers (age 17.4±1.8years; height 176.4±5.7cm; body mass 65.7±9.4kg) 114
took part in this study. Swimmers were eligible for the study if they had competed at the national level 115
for the previous 6 years. In the current season, the swimmers trained with 36390±5960m per week 116
during 6 to 9 training sessions/week; the average personal best time in the 100m freestyle was 57.92 ± 117
2.05s (534.4±56.8 FINA 2015 scoring points). After university ethics committee approval, ensuring 118
compliance with the Helsinki declaration, participants were informed about the study procedures, and 119
written informed consent and/or assent forms were obtained. 120
Accepted Manuscript
The study followed a repeated measures design. Each participant completed 2 time-trials of 100m 122
freestyle, in randomized order, separated by 48hr. Swimmers were asked to wear the swimsuits they 123
normally wore during competitions. All the experiments were conducted two months after the 124
beginning of the season, at the same time of day (8:00–13:00 AM) in a 50m indoor swimming pool 125
with water temperature of 27.6±0.1ºC, air temperature of 27.9±0.1ºC and 60.7±0.2% humidity. The 126
swimmers were familiarized with the warm-up procedures 48hr before the experiments and they were 127
reminded to maintain the same training, recovery and diet routines, including abstaining from caffeine, 128
during the 48hr prior to testing. 129
130
After arriving at the pool, the swimmers remained seated for 5min for the assessment baseline heart 131
rate (Vantage NV; Polar, Lempele, Finland), tympanic temperature (Braun Thermoscan IRT 4520, 132
Germany), Tcore (CorTemp, HQ Inc, Palmetto, FL) blood lactate concentration ([La-]; Accutrend
133
Lactate® Roche, Germany) and VO
2 (Kb42, Cosmed, Rome, Italy). After that, the swimmers performed
134
a standard warm-up for a total volume of 1,200m (Table1), designed based on research7,9,10 with the
135
help of an experienced national swimming coach. 136
137
With the main set, the aim was to increase VO2 to optimize the subsequent time-trial performance. It
138
was structured based on the assumptions that i) critical velocity could be faster than lactate threshold 139
and maximal lactate steady state, causing a progressive increase in VO2 and [La-];11 and ii) the rest
140
period should be sufficient to maintain [La-] levels lower than 5 mmol·l-1, as recommended for
warm-141
up procedures.13 The critical velocity was calculated from the slope of the regression line between
142
distance swam and time, combining the 50m and the 400m best times.11 The range of critical velocity,
143
between 98 to 102%, corresponded to 85±2% and 88±2% of the 100m race-pace, respectively. Heart 144
rate, VO2 and rating of perceived exertion12 (RPE) were monitored during warm-up to ensure the same
145
intensity between the two trials. Once swimmers finished warming-up, they were asked to remain 146
seated for 10 or 20min before performing the 100m time-trial. 147
148
-Please insert Table1. 149
Accepted Manuscript
150
Each swimmer was instructed to step onto the starting block and then take off after official verbal 151
command and the starting signal. Trial times were clocked by a timing system (OMEGA S.A. 152
Switzerland), using as backup a stopwatch held by a swimming coach and a video camera (Casio 153
Exilim Ex-F1, f=30 Hz) placed at 15m, perpendicular to lane 7. That same procedures and devices 154
were also used to assess the 15m time. Stroke frequency (SF), stroke length (SL) and stroke index (SI) 155
were determined according to the procedures reported earlier by Neiva et al.7 The propelling efficiency
156
(ƞρ) was also estimated14:
157
ƞp = [(0.9∙v)/(2π∙SF∙l)]∙2/π
158
where v is the swimming velocity (m s-1), SF is the stroke frequency (Hz) and l is the arm length (m).
159
The l is computed trigonometrically by measuring arm length and considering average elbow angles 160
during insweep of the arm pull, as reported by Zamparo et al.14 At the range of swim velocities
161
demonstrated in these swimmers, internal mechanical work is rather low and can be neglected13 and ƞ p
162
becomes similar to Froude efficiency. For a more detailed discussion, see Zamparo et al.14
163 164
Capillary blood samples for [La-] assessment were collected from the fingertip after the warm-up
165
protocol (1min), immediately before the trial, after the trial (3 and 6min after to obtain the highest 166
value) and 15min after the trial. Heart rate was also assessed over the warm-up period and during 167
recovery following the time-trial. Additionally, the RPE was recorded during and after the warm-up, 168
and after each trial. 169
170
Tympanic temperatures were measured before the warm-up, after the warm-up (1min), immediately 171
before and after the trial and 15min post-trial. Tcore was assessed by a temperature sensor that was 172
ingested the night before (10hr before the test).15 This pill transmitted a radio signal to an external
173
sensor (CorTemp Data Recorder, HQ Inc., Palmetto, FL), which subsequently converted the signal 174
into digital format. The net values of Tcore (Tcorenet) were selected to compare data and reduce error
175
resulting from pill position. 176
Accepted Manuscript
VO2 was measured with a backward extrapolation technique immediately after trial.16 The first 2s of
178
measurement after detection were not considered due to the device’s adaptation to the sudden change 179
of respiratory cycles and to oxygen uptake.17 The peak oxygen uptake (VO
2peak) was considered to be
180
the mean value of the following 6s.17 Additionally, VO
2 was continually monitored during the post
181
warm-up time period and after the 100m freestyle. 182
183
Standard statistical procedures were selected for the calculation of means, standard deviations (SD) 184
and confidence limits. The normality of all distributions was verified by the Shapiro-Wilks test, and 185
parametric statistical analysis was adopted. To compare data between two trials, Student’s paired t-186
tests were used, followed by Cohen’s d effect size for repeated measures (p≤0.05). The effect size was 187
calculated using G-Power 3.1.3 for Windows (University of Kiel, Germany) and 0.2 was deemed 188
small, 0.5 medium, and 0.8 large. An Excel spreadsheet for crossovers was used to calculate the 189
smallest worthwhile effects and to determine the likelihood that the true effect was substantially 190
harmful, trivial, or beneficial (positive, trivial or negative for non-performance variables).18 The
191
threshold value for the smallest worthwhile change was set at 0.8% for performance, whereas the other 192
variables were set at 0.2 (Cohen’s smallest effect size).18Suggested default probabilities for declaring
193
an effect clinically beneficial were <0.5% (most unlikely to harm) and >25% (possible benefit).19 The
194
effect was deemed unclear if it was possibly beneficial (>25%) with an unacceptable risk of harm 195
(>0.5%). Where clear interpretation could be made, chances of benefit or harm were assessed as 196
follows: <0.5%, most unlikely, almost certainly not; 0.5-5%, very unlikely; 5-25%, unlikely, probably 197
not; 25-75%, possibly; 75-95%, likely, probably; 95-99.5%, very likely; and >99.5%, most likely, 198 almost certainly.19 199 200 Results 201 202
Performance was improved moderately in the 10min compared to the 20min rest condition (Table 2), 203
resulting from a large effect on the first 50m lap and a moderate effect on the second 50m lap. The 204
swimmers categorised their effort as being between very hard and exhaustive in both trials (p=0.18; 205
Accepted Manuscript
d=0.55; mean difference 1.0%; 90% confidence limits ±2.9; clinical inferences unclear). Regarding the 206
biomechanical analysis (Table 2), the swimmers showed higher SF after 10min passive rest during the 207
first 50m lap, with small effect sizes seen in the second 50m. Despite the unclear implications of SL 208
and ƞp in the first 50m, there were clear decreases in SI, SL and ƞp during the second 50m lap.
209 210
-Please insert Table2. 211
212
Figure 1 depicts the physiological responses to the different conditions. Baseline measures of Tcore 213
(1A) were similar between conditions (p=0.27; d=0.46; 0.8%; ±1.2; unclear). The highest Tcore values 214
were recorded after warm-up (10min 37.67±0.48ºC; 20min 37.76±0.57ºC). There was a small 215
additional decrease in Tcore in the 20min compared to the 10min passive rest (p=0.78; d=0.11; -0.1%; 216
±0.9; possibly negative), corroborated by pre-trial Tcorenet differences (p=0.31; d=0.32; -55.3%;
217
±19.1; possibly negative). Those differences in Tcorenet (1B) were increased after the trial (p=0.16;
218
d=0.59; -66.2%; ±12.0; likely negative). The 15min of recovery were not sufficient to return to 219
baseline values (37.46±0.33ºC; 37.36±0.39ºC). The tympanic temperature (1C) recorded no clear 220
differences between conditions until the end of trial, when medium differences were found (p=0.06; 221
d=0.49; -1.4%; ±1.5; likely negative), and after recovery (p=0.06; d=0.70; -0.9%; ±0.8; likely 222
negative). 223
224
Baseline measures of [La-] (1D) were low and similar between conditions (p=0.16; d=0.46; 8.1%;
225
±9.7; likely trivial). [La-] responded in the same way to warm-up (p=0.20; d=0.44; 5.5%; ±8.8; most
226
likely trivial). [La-] attained the highest values after trial, but no clear differences were observed
227
(11.91 ± 3.82 mmol·l-1 vs. 11.32 ± 3.71 mmol·l-1; p=0.36; d=0.29; -4.9%; ±12.2; unclear), and this was
228
maintained during recovery (p=0.18, d=0.43; -10.9%; ±13.6; possibly negative). 229
230
There was a small difference in baseline heart rate (1E) between the two protocols (p=0.13; d=0.49;-231
3.3%; ±3.6; possibly negative) but similar VO2 (1F) (p=0.78; d=0.11; -0.4%; ±2.3; very likely trivial).
232
The response to warm-up was identical between conditions for both heart rate (p=0.73, d=0.40; -0.8%; 233
Accepted Manuscript
±3.6%; likely trivial) and VO2 (p=0.82, d=0.09; 4.0%; ±21.7; unclear). This data corroborates the
234
similarity between the warm-up intensities and procedures, as evidenced by the perceived effort after 235
warm-up (10.00±1.48 vs. 9.55±1.63; p=0.45; d=0.25; 6.7%; ±14.8; unclear). However, pre-trial values 236
showed lower heart rates in the 20min condition (89±12bpm vs. 82±13bpm; p<0.01; d=1.07; -7.8%; 237
±4.0%; very likely negative). This may somehow reflect the near statistically significant difference 238
between VO2 pre-trial, but with a high effect size (8.58±1.67ml·kg-1min-1 vs. 7.54±2.45ml·kg-1min-1;
239
p=0.07; d=0.81; -14.1%; ±10.5; likely negative). After the trial, no clear differences were seen in 240
VO2peak (55.23±7.03ml·kg-1min-1 vs. 53.67 ± 9.46ml·kg-1min-1; p=0.39; d=0.35; -3.4%; ±5.9; possibly
241
negative), while lower heart rates were found in the 20min passive rest condition (173±6bpm vs. 242
165±11bpm; p=0.10; d=0.75; -4.7%; ±4.5; likely negative). A greater additional decrease in heart rates 243
for the 20min condition was found during recovery (p=0.004; d=1.11; -9.0%; ±4.3; very likely 244
negative). 245
246
-Please insert Figure1. 247
248
Discussion 249
250
The aim of this study was to compare the effects of 10min or 20min post warm-up passive rest on 251
100m freestyle performance in competitive swimmers. The main finding was a “likely” positive effect 252
on swimming performance when the shorter passive rest period was used (1.12% faster time-trial 253
performance with 10min vs. 20min). This supported the hypothesis that a shorter time-lag between the 254
warm-up and the race benefits time-trial performance. The physiological response may partially 255
explain this finding. Although acute adaptations in body temperature did not seem enough to justify 256
the difference in performance, the combined effects of the shorter post warm-up interval on Tcore, 257
heart rate, and VO2 appeared to be associated with the faster performance observed.
258 259
Active warm-up in swimming seems to improve performance after rest periods of 10min9 and 20min.2
260
However, it remains to be seen which duration is the most effective for optimizing performance and 261
Accepted Manuscript
which type of rest (active or passive) should be used.20 It has been suggested that increases in muscle
262
and core temperature caused by priming exercises are the major factors influencing performance.4 At
263
least for land-based activity, an increase in the athlete’s temperature results in lower time required to 264
achieve peak tension and relaxation,21 reduced viscous resistance of the muscles and joints,22 increased
265
muscle blood flow,23 improved efficiency of muscle glycolysis and high-energy phosphate
266
degradation,24 and increased nerve conduction rate.5 Therefore, we implemented a recommended
267
warm-up volume,14 including a near race-pace velocity set14 (approximately 90% of the 100m
race-268
pace velocity), that resulted in increased VO2 and body temperature.
269 270
In the present study, as expected, Tcore increased during the warm-up, eventually reaching its 271
maximum value, and then started to drop, decreasing up until the beginning of the time-trial. Before 272
the race, the 20min rest interval had a very “likely” negative effect on Tcorenet values. Therefore, the
273
lower Tcorenet in the 20min condition could have influenced the swimmers’ performance, as a
274
decrease in performance could be related to muscle and core temperature decline after exercitation.25
275
Despite not being significant, tympanic temperature recorded a trend towards higher values in the 276
10min condition, supporting the Tcorenet data. West et al.2 noted that 45min was an excessive rest
277
period for the Tcore, explaining its negative effect on 200m freestyle performance. In this study, the 278
abovementioned effects on Tcore cannot by themselves explain the 1.12% performance improvement; 279
the pre-trial heart rate and VO2 data can provide complementary support, as the 10min of extra rest in
280
the 20min condition lowered these variables by ~8% and ~14%, respectively. Thus, the strong effect 281
verified in these two variables could influence the race, notably during the first few meters. 282
283
After verifying a higher heart rate before the 200m trial in the 10min rest compared with the 45min 284
rest, Zochowski et al.9 hypothesized that the swimmers started the trial at a high baseline VO 2. The
285
authors did not measure the VO2, but our data confirmed their speculation for both heart rate and VO2.
286
Before their study, warm-up was already believed to increase VO2 and oxygen kinetics.6 Yet, our
287
study was the first to provide evidence of such. Higher baseline VO2 might have influenced the energy
288
provision from anaerobic sources in the first part of the race by increasing the aerobic contribution and 289
Accepted Manuscript
preserving the high-energy subtracts for later use in the task.26 This might explain the ~0.7% faster
290
times in the second lap in the 10min condition compared to the 20min condition. 291
292
The better performance seen in the first 50m lap after a 10min post warm-up period could be the result 293
of higher SF. The swimmers were able to reach higher SF due to an effect on motor neuron 294
excitability that remained after the shorter post warm-up rest.27 Also, it could point to a post-activation
295
potentiation effect that should happen by the 8th min of recovery,28 enabling an optimized SF. Thus,
296
increased SF for the same efficiency (monitored by the SI and ƞp) resulted in a faster 50m lap.
297 298
The different post warm-up periods were not enough to cause differences in the [La-] after the trial.
299
Some authors may suggest that a shorter rest induces increased lactate production due to glycolytic 300
stimulation over the trial. However, the increased VO2 at the beginning of the trial could have
301
stimulated the aerobic contribution, which has been shown to reach approximately 50% of the energy 302
expenditure in a 100m maximal bout.29 Moreover, this could hinder the glycolytic pathway. Although
303
we failed to observe differences in [La-], VO
2peak and RPE, the increased heart rate seen after the trial
304
might suggest a higher spike in such variables at the beginning of the trial. An increased primary 305
response would increase the oxidative metabolic contribution early in the exercise and increase 306
anaerobic metabolism in the final meters.26 This could augment the heart rate response such that the
307
swimmers can easily recover their homeostasis. 308
309
Although muscle temperature could be an important complementary variable with which to better 310
understand our findings, we should not disregard Tcore as having a great influence on performance.4
311
Recent findings about passive post warm-up heating strategies showed that some exercitation was also 312
needed for better performance.10,30 Accordingly, our results suggested that temperature alone could not
313
be responsible for the performance optimization. Therefore, researchers should consider analysing the 314
in-water swimming sets so that the abovementioned effects can be extended. The lower values of VO2
315
before the race in both trials lead us to speculate that some physiological adaptation mechanism may 316
occur to change the motor unit recruitment patterns, thus optimizing the immediate VO2 response
Accepted Manuscript
during trial. We should also be aware of possible differences in the physiological measurements 318
between time-trials compared to competition. For instance, heart rates could be higher during pre-race 319
build-up due to increased anxiety from the competition itself. Nevertheless, we aimed to ensure that 320
the swimmers performed the two maximal trials in the same conditions. 321
322
Conclusion 323
324
The swimmers were faster in the 100m freestyle following 10min vs. 20min post warm-up passive 325
rest. Despite the expected influence of body temperature in this improvement, our data suggests that 326
temperature is not the only influencing factor. Heart rate and VO2 seem to be positively influenced by
327
the shorter rest, notably influencing the first meters of the race. This may increase the aerobic 328
contribution to this initial phase of the race, stimulating different metabolic energy pathways and 329
resulting in improved performance. Further research should focus on the passive or active methods of 330
rest for maintaining the benefits of warm-up (i.e. elevated temperature, heart rate and VO2) during the
331
time frame between warm-up and the swimming race. 332
333
Practical implications 334
335
-The beneficial effects of in-pool warm-up may decrease over time and influence the subsequent 336
swimming race. It is suggested to conduct the warm-up close to the race to benefit from all of its 337
positive effects. 338
339
-The time-lag between warm-up and race should be long enough to allow a post potentiation effect, 340
but not so long that oxygen consumption, heart rate and core temperature effects disappear. 341
342
-Coaches should develop methods to maintain the swimmers’ warm-up temperature (e.g. passive 343
warm-up) and perhaps some light activities to maintain heart rate and VO2 above resting values before
344
the swimming race. 345
Accepted Manuscript
346
Acknowledgements 347
348
The authors would like to acknowledge the help of the swimmers who participated in the current 349
study, and also that of the Varzim Lazer EEM in making available the swimming-pool facilities. This 350
work was supported by a grant from the Science and Technology Foundation (SFRH/BD/74950/2010) 351
and by University of Beira Interior and Santander Totta bank (UBI/FCSH/Santander/2010). 352
353
References 354
355
1. Balilionis G, Nepocatych S, Ellis CM et al. Effects of different types of warm-up on swimming 356
performance, reaction time, and dive distance. J Strength Cond Res 2012; 26(12):3297–3303. 357
2. West DJ, Dietzig BM, Bracken RM et al. Influence of postwarm-up recovery time on swim 358
performance in international swimmers. J Sci Med Sport 2013; 16(2):172–176. 359
3. Neiva HP, Marques MC, Barbosa TM et al. Warm-up and performance in competitive swimming. 360
Sports Med 2014; 44(3):319-330.
361
4. Bishop D. Warm up II: performance changes following active warm up and how to structure the 362
warm up. Sports Med 2003; 33(7):483–498. 363
5. Racinais S, Oksa J. Temperature and neuromuscular function. Scand J Med Sci Sports 2010; 364
20(Suppl 3):1-18. 365
6. Burnley M, Davison G, Baker JR. Effects of priming exercise on VO2 kinetics and the power-366
duration relationship. Med Sci Sports Exerc. 2011; 43(11):2171-2179. 367
7. Neiva HP, Marques MC, Fernandes RJ et al. Does warm-up have a beneficial effect on 100-m 368
freestyle? Int J Sports Physiol Perform 2014; 9(1):145-150. 369
8. Neiva H, Morouco P, Silva AJ et al. The effect of warm up on tethered front crawl swimming 370
forces. J Hum Kinet 2011; 29A(Spec Iss):113–119. 371
9. Zochowski T, Johnson E, Sleivert GG. Effects of varying postwarm-up recovery time on 200-m 372
time-trial swim performance. Int J Sports Physiol Perform 2007; 2(2):201–211. 373
Accepted Manuscript
10.McGowan CJ, Thompson KG, Pyne DB et al. Heated jackets and dryland-based activation 374
exercises used as additional warm-ups during transition enhance sprint swimming performance. J 375
Sci Med Sport 2015; doi: 10.1016/j.jsams.2015.04.012.
376
11.Toubekis AG, Tokmakidis SP. Metabolic responses at various intensities relative to critical 377
swimming velocity. J Strength Cond Res 2013; 27(6):1731-1741. 378
12.Borg G. Borg’s perceived exertion and pain scales. Champaign, IL, Human Kinetics, 1998. 379
13.Jones AM, Wilkerson DP, Burnley M, et al. Prior heavy exercise enhances performance during 380
subsequent perimaximal exercise. Med Sci Sports Exerc 2003; 35(12): 2085-2092. 381
14.Zamparo P, Pendergast D, Mollendorf J et al. An energy balance of front crawl. Eur J Appl Physiol 382
2005; 94:134-144. 383
15.Byrne C, Lim CL. The ingestible telemetric body core temperature sensor: a review of validity and 384
exercise applications. Br J Sports Med 2006; 41(3):126–133. 385
16.Costa MJ, Bragada JA, Mejias JE et al. Effects of swim training on energetics and performance. Int 386
J Sports Med 2013; 34(6):507-513.
387
17.Laffite LP, Vilas-Boas JP, Demarle A et al. Changes in physiological and stroke parameters during 388
a maximal 400-m free swimming test in elite swimmers. Can J Appl Physiol 2004; 29:S17-S31. 389
18.Hopkins WG. Spreadsheets for analysis of controlled trials, with adjustment for a subject 390
characteristic. Sportscience 2006; 10:46–50. 391
19.Hopkins WG. A spreadsheet for deriving a confidence interval, mechanistic inference and clinical 392
inference from a p value. Sportscience 2007; 11:16-20. 393
20.Toubekis AG, Tsolaki A, Smilios I et al. Swimming performance after passive and active recovery 394
of various durations. Int J Sports Physiol Perform 2008; 3(3):375-386. 395
21. Segal SS, Faulkner JA, White TP. Skeletal muscle fatigue in vitro is temperature dependent. J 396
Appl Physiol 1986; 61(2):660-665.
397
22. Wright V. Stiffness: a review of its measurement and physiological importance. Physiotherapy 398
1973; 59(4):107-111. 399
Accepted Manuscript
23. Pearson J, Low DA, Stöhr E et al. Hemodynamic responses to heat stress in the resting and 400
exercising human leg: insight into the effect of temperature on skeletal muscle blood flow. Am J 401
Phys Regul Integr Comp Phys 2011; 300(3):R663-R673.
402
24.Febbraio MA, Carey MF, Snow RJ et al. Influence of elevated muscle temperature on metabolism 403
during intense, dynamic exercise. Am J Physiol 1996; 271(5 Pt 2):R1251–R1255. 404
25. Mohr M, Krustrup P, Nybo L et al. Muscle temperature and sprint performance during soccer 405
matches–beneficial effect of re‐warm‐up at half‐time. Scand J Med Sci Sports 2004; 14(3):156-162. 406
26. Burnley M, Jones AM. Oxygen uptake kinetics as a determinant of sports performance. Eur J 407
Sport Sci 2007; 7(2):63-79.
408
27. Saez Saez de Villarreal E, González-Badillo JJ, Izquierdo M. Optimal warm-up stimuli of muscle 409
activation to enhance short and long-term acute jumping performance. Eur J Appl Physiol 2007; 410
100(4):393-401. 411
28. Kilduff LP, Cunningham DJ, Owen NJ et al. Effect of postactivation potentiation on swimming 412
starts in international sprint swimmers. J Strength Cond Res 2011; 25(9):2418-2423. 413
29. Ribeiro J, Figueiredo P, Sousa A et al. VO2 kinetics and metabolic contributions during full and 414
upper body extreme swimming intensity. Eur J Appl Physiol 2015; 115(5):1117-1124. 415
30. West DJ, Russell M, Bracken RM et al. Post-warmup strategies to maintain body temperature and 416
physical performance in professional rugby union players. J Sports Sci 2015; 30:1-6. 417
Accepted Manuscript
428
Figure Legends 429
430
Figure 1. Physiological variables responses throughout the procedures: core temperature (A), net 431
values of core temperature (B), tympanic temperature (C), blood lactate concentrations ([La-]; D),
432
heart rate (E), Oxygen uptake (VO2; F). * Indicates difference between the two conditions assessed (p
433
< 0.01). Data presented as mean ± SD (n=11). 434
Accepted Manuscript
Table 1 – Standard warm-up (WU) protocol. 435
WU Task description
300m
100m usual breathing, 100m breathing in the 5th stroke, 100m usual
breathing
4x100m @ 1:50 2x (25m kick - 25m increased stroke length)
8x50m @ 1:00 98% - 102% of critical velocity (or 85-90% of 100m pace)
100m Easy swim
436 437
Accepted Manuscript
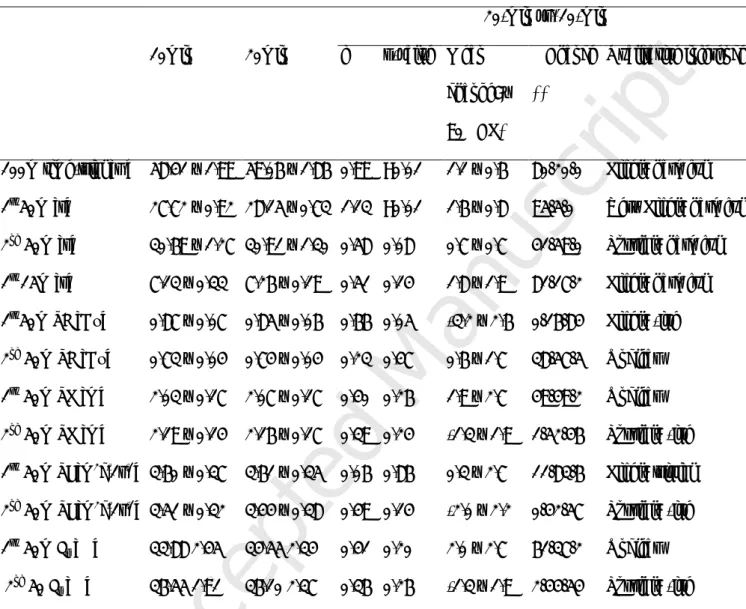
Table 2 – Mean ± SD values of the 100 and 50m lap times, stroke frequency (SF), stroke length (SL), 437
stroke index (SI), and propelling efficiency (ƞp) with 10min and 20min post warm-up passive rest.
438
Effect sizes (d), p-values, and inferences for percent change of means are presented (n=11). 439
20-min vs. 10-min
10min 20min d p-value Mean %
change; ± 90%CL*
%Chance **
Qualitative inference
100m time-trial [s ] 58.41 ± 1.99 59.06 ± 1.86 0.99 <0.01 1.1 ± 0.6 80/20/0 Likely harmful 1st 50m [s] 27.72 ± 0.92 28.15 ± 0.73 1.13 <0.01 1.6 ± 0.8 95/5/0 Very Likely harmful
2nd 50m [s] 30.69 ± 1.27 30.91 ± 1.30 0.58 0.08 0.7 ± 0.7 41/59/0 Possibly harmful 1st 15m [s] 7.13 ± 0.33 7.26 ± 0.19 0.51 0.14 1.8 ± 1.9 81/17/2 Likely harmful 1st 50m SF [Hz] 0.87 ± 0.07 0.85 ± 0.06 0.66 0.05 -3.2 ± 2.6 0/16/84 Likely -ive 2nd 50m SF [Hz] 0.73 ± 0.04 0.74 ± 0.04 0.23 0.47 0.6 ± 1.7 38/57/5 Unclear 1st 50m SL [m] 2.03 ± 0.17 2.07 ± 0.17 0.40 0.26 1.9 ± 2.7 49/49/2 Unclear 2nd 50m SL [m] 2.19 ± 0.14 2.16 ± 0.17 0.39 0.24 -1.3 ± 1.9 1/52/46 Possibly -ive 1st 50m SI [m2c-1s-1] 3.60 ± 0.37 3.61 ± 0.35 0.06 0.86 0.3 ± 2.7 11/83/6 Likely trivial 2nd 50m SI [m2c-1s-1] 3.51 ± 0.32 3.44 ± 0.38 0.49 0.14 -2.0 ± 2.2 0/42/57 Possibly -ive 1st 50m ƞ p [%] 33.88 2.45 34.55 2.34 0.41 0.20 2.0 ± 2.7 61/37/2 Unclear 2nd 50 ƞ p [%] 36.55 1.91 36.10 2.37 0.36 0.26 -1.3 ± 1.9 2/44/54 Possibly -ive
90% CL = 90% confidence limits. +ive, -ive = positive and negative changes, respectively. * where a positive % change equates to an increase in 20min condition
** presented as harmful/trivial/beneficial for performance (time) and positive/trivial/negative for other variables 440