Faculdade de Ciências da Saúde
Mestrado em Ciências Biomédicas
Effect of Regucalcin on the expression of
oncogenes and tumor suppressor genes in
prostate cell lines
Cátia Alexandra Vicente Vaz
Covilhã, 2010
Faculdade de Ciências da Saúde
Supervisor: Professora Doutora Sílvia Cristina da Cruz Marques
Socorro
Co-supervisor: Professor Doutor Claúdio Jorge Maia Baptista
Mestrado em Ciências Biomédicas
Effect of Regucalcin on the expression of oncogenes and
tumor suppressor genes in prostate cell lines
Cátia Alexandra Vicente Vaz
Covilhã, 2010
Influência da Regucalcina na expressão de oncogenes e genes
supressores de tumor em linhas celulares de próstata
O conteúdo do presente trabalho é da exclusiva
responsabilidade da autora:
First and foremost, I would like to thank my supervisor, Profª Drª Sílvia Socorro, for her invaluable support, guidance and friendship.
I would like to thank my co-supervisor for his continuos help and helpful recommendations.
I am grateful to my colleagues and friends Sara Correia, Luis Rato, Inês Gomes, Margarida Gonçalves, Ana Mamede, Vitor Gaspar, Carlos Gaspar and Sandra Laurentino.
I would also like to express my gratitude to our research group and to all present colleagues involved in the Heath sciences research centre of the University of Beira Interior.
I acknowledge Profº Pedro Oliveira and Drª Ana Clara Cristovão for counselling in fluorescence microscopy.
Regucalcin (RGN) is a calcium-binding protein playing an important role in maintenance of intracellular calcium homeostasis. Because of its diminished expression with aging it is also designated Senescence-marker-protein (SMP30). In addition, RGN suppresses cell proliferation, inhibits expression of oncogenes, and increases the expression of tumor suppressor genes in hepatoma cell lines. Very recently, our research group demonstrated that RGN expression is diminished in prostate cancer tissues, what suggests that RGN may have a protective role against carcinogenesis and, consequently, loss of regucalcin expression may contribute to tumor development. The present project aims to characterize RGN expression in prostate tissues and cell-lines and to determine the role of RGN on the expression of oncogenes and tumour suppressor genes in neopasic and non-neoplasic prostate cells. The expression of RGN in rat prostate at different post-natal ages determined by quantitative PCR analysis showed a significant increase at 3M old rats, maintaining their expression in 6M-old animals and diminishing in the following stages. In this report, we confirmed RGN protein expression in human cancer prostate tissues, and cells lines by Imunohistochemistry and Western Blot, respectively. To analyze the effect of RGN on the expression of oncogenes (BCL2, Ha-ras and c-myc) and tumor supressor genes (p53 and RB1), pIRES/RGN expression vectors were constructed and used to transfect LnCAP, PC3, PNT1A and PNT2 cells. Fluorescence microscopy analysis showed successful transfection of PC3 and PNT1A cells, with RGN-GFP protein localization in cell nuclei and cytoplasm. Analysis of transfection experiments in LnCAP and PNT2 cells, and determination of the effect of RGN on the expression of tumor related genes are underway. Nevertheless, RGN localization in cell nuclei, suggests their likely influence regulating expression of oncogenes and tumor suppressor genes in prostate cell lines overexpressing RGN.
A Regucalcina (RGN) é uma proteína de ligação ao cálcio desempenhando um papel importante na homeostase intracelular deste ião. Devido á diminuição da sua expressão associada ao envelhecimento é também designada como Proteína marcadora de senescência (SMP30). A RGN tem sido associada a funções tais como, supressão da proliferação celular, inibição da expressão de oncogenes e aumento na expressão de genes supressores de tumor em linhas celulares de fígado. Recentemente, o nosso grupo de investigação demonstrou que a expressão da RGN estava diminuida em tecidos de adenocarcinomas de próstata, o que sugere um efeito protector da RGN na carcinogénese, e consequentemente a perda da sua expressão pode estar associada ao desenvolvimento tumoral. O presente trabalho teve como objectivos a caracterização da expressão da RGN em linhas celulares e tecidos de próstata e determinar o papel da RGN na expressão de oncogenes e genes supressores de tumor em linhas celulares da próstata neoplásicas e não-neoplásicas. A expressão da RGN na próstata de rato ao longo do desenvolvimento pós-natal foi estudada por PCR quantitativo. A expressão da RGN aumentou aos 3M de idade, a sua expressão manteve-se elevada até aos 6M e diminuiu nas idades seguintes. Neste estudo foi também possível confirmar a expressão da RGN em tecidos de adenocarcinoma de próstata e em linhas celulares por imunohistoquimica e Western Blot, respectivamente. Para analisar o efeito da RGN na expressão de oncogenes e genes supressores de tumor, foram construidos vectores de expressão pIRES/RGN os quais foram usados para transfectar as linhas celulares LnCAP, PC3, PNT1A e PNT2. A análise efectuada por microscopia de fluorescência demonstrou a localização da proteína RGN-GFP no núcleo e citoplama das células PC3 e PNT1A transfectadas com sucesso. A análise da transfecção das celúlas LnCAP e PNT2, bem como a determinação do efeito da RGN na expressão de genes associados ao desenvolvimento tumoral encontra-se em curso. No entanto, os resultados que demonstram a localização da RGN no núcleo, sugerem o seu possível envolvimento na regulação da expressão de oncogenes e genes supressores de tumor em linhas celulares da próstata que sobre-expressam a RGN.
Act D Actinomycin
AR Androgen receptor
bp Base pairs
BPH Benign prostatic hypertrophy
Ca2+ Calcium
CaM kinase Ca2+/calmodulin-dependent protein kinase CaR calcium polyvalent cation-sensing receptor CCE Capacitative calcium entry
CDK Cyclin dependent kinase
[Ca2+]i Intracellular Ca2+ level
cDNA complementary acid deoxyribonucleic CRT intraluminal calreticulin
DEPC Diethylpirocarbonate
DHT Dihydrotestosterone
dNTP Deoxynucleotide triphosphates Drg Differentiation related gene
E2 17β-estradiol
Ecoli Escherichia coli
EGF Epidermal growth factor
EGFR Epidermal growth factor receptors
ER Estrogen receptor
FBS Fetal bovine serum
FGF Fibroblast growth factor
GZ Tubuloalveolar glands
HDAC Histone deacetylase HGF Hepatocyte growth factor
HPIN High-grade prostatic intraepithelial neoplasia IGF-R Insulin-like growth factor receptors
HDAC histone deacetylase
IHC Imunohistochemistry
ILK Integrin linked kinase
IL Interleucine
MIC Macrophage inhibitory cytokine
MIF Macrophage migration inhibitory factor MMPs matrix metalloproteinases
mRNA Messenger ribonucleic acid
MUC Mucin
nt Nucleotide
PAP Acid Phosphatase
PC Prostate cancer
PCR Polymerase chain reaction PI3K phosphoinositide 3-kinase
PIA Proliferative inflammatory atrophy PIN Prostatic intraepithelial neoplasia
PK Protein kinase
PSA Prostate specific antigen
PTEN Phosphatase and tensin homologue deleted on chromosome 10
PZ Peripheral zone
qPCR Quantitative Polymerase chain reaction
RGN Regucalcin
RNAt Total RNA
RT Room temperature
SOCE Store operated calcium entry
SH Sullhydryl
SMP-30 Senescence marker protein -30 TNF Tumor necrosis factor
TSGs Tumor suppressor genes
TZ Transitional zone
VEGF Vascular endothelium growth factor
wt Wild type
Figure 1: Human prostate anatomy. 1
Figure 2: Human prostate needle biopsy specimen showing peripheral zone (PZ), transitional zone (TZ), and central zone (CZ).
2
Figure 3: Photomicrograph of human prostate gland. 4
Figure 4: Embryology of the human prostate. 7
Figure 5: Pathway of human prostate cancer progression. 8
Figure 6: Scheme showing the possible mitogenic and antiapoptotic cascades induced through the androgen receptor (AR), estrogen receptor (ER), epidermal growth factor receptor (EGFR), interleucine-6 (IL-6) and protein kinase A (PKA) signaling pathways.
10
Figure 7: Scheme showing the possible mitogenic and antiapoptotic cascades induced through the epidermal growth factor- epidermal growth factor receptor (EGF–EGFR), hedgehog, Wnt and other growth factor signaling pathway elements co-localized in caveolae.
11
Figure 8: Schematic depiction of the differences in Ca2+-dependent apoptotic pathways in androgen-dependent and androgen-independent prostate cancer (PC) epithelial cells.
15
Figure 9: Restriction maps of cDNA and genomic DNA of mouse Regucalcin (RGN), and the genomic organization of mouse RGN.
17
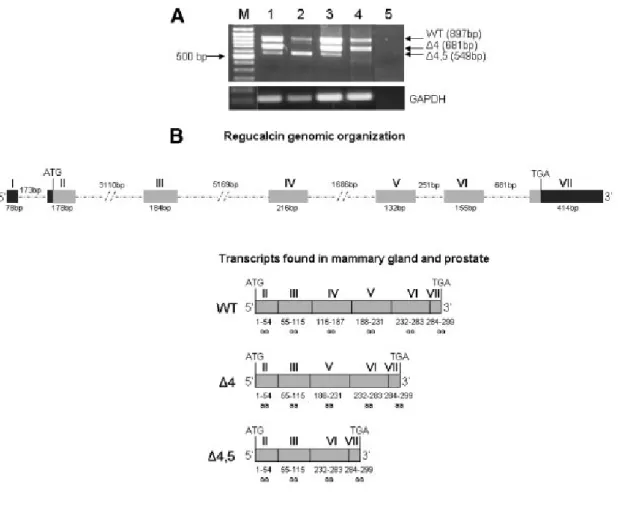
Figure 10: Regucalcin mRNA transcripts in human breast and prostate tissues and cell lines.
18
Figure 11: Crystal structure of human Regucalcin (RGN) with calcium (Ca2+) bound.
19
Figure 12: Regulatory role of Regucalcin (RGN) in Ca2+ homeostasis of liver cells. 21
Figure 13: Regulatory role of Regucalcin (RGN) in Ca2+ homeostasis of liver cells. 23
Figure 14: pGEM®-T Easy vector Map. 35
Figure 15: pIRES2-AcGFP1vector Map and Multiple cloning site (MSC). 37
Figure 16: Expression of regucalcin (RGN) at different post-natal ages in prostate rat tissues determined by quantitative PCR (qPCR).
Figure 18: Regucalcin protein immunolocalization in human neoplasic prostate tissues.
45
Figure 19: Cloning of wt and RGN transcription variants cDNAs in pIRES expression vector.
46
Figure 20: Dual fluorescence localization of RGN-GFP protein (green) and nucleus (blue) in PC3 cells.
48
Figure 21: Dual fluorescence localization of RGN-GFP protein (green) and nucleus (blue) in PNT1A cells.
49
Figure 22: Expression of oncogenes (BCL2, Ha-ras and c-myc) and tumor supressor genes (p53 and RB1) in Human Prostate cancer (PC3 and LnCAP) and immortalized epithelial prostate (PNT1A and PNT2) cell lines determined by RT-PCR using specific primers.
50
Figure 23 Normalized expression of oncogenes (A) (BCL2, Ha-ras and c-myc) and tumor suppressor genes (B) (p53 and RB1) in Human Prostate cancer (PC3 and LnCAP) and immortalized epithelial prostate (PNT1A and PNT2) cell lines determined by RT-PCR.
Table 1: Differently-expressed genes in Prostate Cancer 13
Table 2: Reagents used for cDNA synthesis. 30
Table 3: Sequences, amplicon size and cycling conditions of specific primers for different oncongenes (BCL2, Ha-ras and c-myc), tumor suppressor genes
(p53 and RB1) and for 18S.
32
Table 4: Sequences, amplicon size and cycling conditions of specific primers for
RGN fragments (WT, Δ4 and Δ4,5). 33
Table 5: Resolving and stacking gel composition. 38 Table 6: Ratios tested in transient transfection experiments of PC3, LnCAP,
PNT1A and PNT2 with pIRES-AcGFP1/RGNwt, pIRES- AcGFP1/RGN Δ4, pIRES- AcGFP1/ RGN Δ4,5 and pIRES- AcGFP1 vectors in a 24 well plate.
40
Table 7: Primers sequences, amplicon size and cycling conditions used in qPCR analysis.
I. Background ... 1
1. Anatomy and Pathophysiology of Prostate ... 2
1.1. Overview of prostate macro- and micro-anatomy ... 2
1.2. Development and hormonal regulation of the prostate gland ... 5
1.3. Prostate carcinogenesis... 7
1.3.1. Tumor stages development ... 8
1.3.2. Differently-expressed genes ... 12
1.3.3. Role of calcium in Prostate cancer ... 14
2. Characterization of Regucalcin: molecular biology and physiological roles ... 16
2.1. Gene/mRNA/protein ... 16
2.2. Tissue expression and age-specific regulation ... 20
2.3. Regucalcin functions ... 20
2.3.1. Intracellular calcium homeostasis ... 20
2.3.2. Calcium-dependent Enzyme Regulation and Intracellular signaling ... 22
2.3.3. Protease regulation ... 24
2.3.4. Apoptosis and cellular proliferation... 24
2.4. Regucalcin expression in prostate pathophysiological state. ... 25
II. Objectives ... 26
III. Material and Methods ... 28
1. Reverse Transcriptase –Polymerase Chain Reaction- RT-PCR ... 29
1.1. Total RNA extraction ... 29
1.2. cDNA synthesis ... 30
1.3. PCR ... 30
2. Cloning of RT-PCR DNA fragments ... 33
2.1. PCR products purification ... 33
2.2. Ligation of inserts into pGEM®-T Easy Vector ... 34
2.3. Transformation of competent bacteria XL1B ... 34
2.4. Culture of bacteria in liquid medium ... 34
2.5. Purification of DNA plasmid ... 34
2.6. Digestion of plasmid DNA ... 35
2.7. DNA Sequencing ... 35
6. Immunohistochemistry ... 38
7. Cell culture ... 39
8. Transient transfection assay ... 39
9. Quantitative Polymerase Chain Reaction (q.PCR) ... 40
10. Data analysis ... 41
IV. Results ... 42
1. Analysis of regucalcin expression in rat prostate tissues at different post-natal ages ... 43
2. Expression of Regucalcin in human prostate cell lines and tissue-sections ... 44
3. Construction of Regucalcin expression vectors ... 46
4. RGN overexpression in neoplasic and non-neoplasic prostate cell lines ... 47
5. Optimization of RT-PCR amplification of oncogenes and tumor suppressor genes in prostate cell lines ... 50
V. Discussion ... 52
VI. References ... 57
1. Anatomy and Pathophysiology of Prostate
1.1. Overview of prostate macro- and micro-anatomy
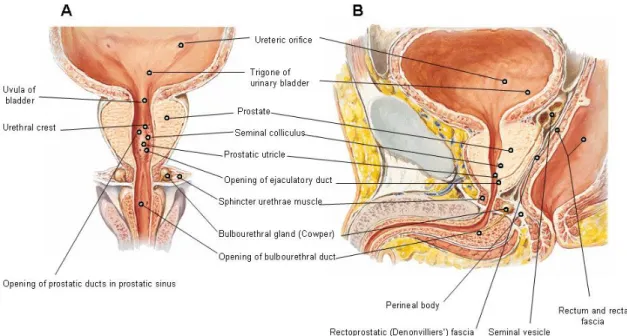
The prostate is a walnut-sized glandular structure. It is about 4 cm across and 3 cm thick, and lies immediately below the urinary bladder, where it surrounds the initial portion of the urethra (Figure 1).
Figure 1: Human prostate anatomy. A- Frontal section with bulbous portion of spongy urethra
schematically extended; B- Sagital section (Netter, 1997).
The prostate is enclosed by a fibrous capsule and divided into lobules formed by the urethra and the ejaculatory ducts that extend through the gland. The ducts from the lobules open into the urethra (Graaff, 2002, Joshua et al., 2008). The prostate gland can be divided into five parts: the anterior fibromuscular stroma, a peripheral zone, a central zone, and smaller transition and preprostatic zones (McNeal, 1988, McNeal, 1980, McNeal, 2006) (Figure 2). The peripheral zone (PZ) is the largest region of the prostate, containing approximately 75% of glandular tissue; the central zone (CZ) is the smaller region, comprising approximately 25% of the glandular mass of the prostate and the periurethral area of the gland or the transition zone (TZ) accounts for less than 5% of the prostatic mass (McNeal et al., 1988, Knobil and Neill, 2006). The preprostatic tissue surrounds the urethra and consists of glandular and nonglandular structures,
including a ring of smooth muscle that prevents retrograde ejaculation. The anterior fibromuscular stroma completely covers the surface of the prostate gland and does not contain any ductal structures (Knobil and Neill, 2006).
The glands are irregularly shaped with the epithelium forming folds. Lamellated glycoprotein masses called corpora amylacea are a feature of increasing age, becoming progressively calcified to form prostatic concretions (Young, 2002).
Figure 2: Human prostate needle biopsy specimen showing peripheral zone (PZ), transitional
zone (TZ), and central zone (CZ). A variation in ductal and glandular density can be readily observed histologically, although the distinction between the central and peripheral zones can be difficult. The specimen is approximately 6 mm long (Knobil and Neill, 2006).
The prostate gland is composed of two major groups of cells: the epithelial and the stromal cells (Figure 3). Among the epithelial cells there are the secretory cells and basal cells. Neuroendocrine cells, a third type, are present and are believed to be involved in the regulation of prostatic secretory activity and cell growth (Knobil and Neill, 2006).
The secretory cells comprise the exocrine compartment of the prostate epithelium, characterized by columnar luminal cells that produce prostatic secretions, androgen receptor (AR), keratinocyte growth factor receptor (KGFR) and prostate specific antigen (PSA). In the human prostate, basal cells form a continuous layer of cells abutting the basement membrane, and contain insulin-like growth factor receptors (IGF-R), epidermal growth factor receptors (EGFR), and estrogen receptor (ER). The presence of junction-like structures between adjacent basal cells in the human prostate suggests that these cells may form a physical “blood–prostate barrier”, preventing
Peripheral zone (PZ) Transitional zone (TZ) Central zone (CZ)
substances derived from the blood or stroma coming into direct contact with the luminal cells (Knobil and Neill, 2006, Shapiro et al., 2005).
Within the stromal cell population, fibroblastic and smooth muscle cells are thought to produce growth factors that support the development and function of the epithelial cells (Lopez-Otin and Diamandis, 1998).
Figure 3: Photomicrograph of human prostate gland. A. This image shows the tubuloalveolar
glands (GI) and the fibromuscular tissue that forms the septa between glandular tissue. Within the lumina, various sized prostatic concretions can be seen. The stain utilized for this specimen readily distinguishes the smooth muscle component (stained red) from the dense connective tissue component (stained blue) of the stroma. B. This image shows an area where the glandular epithelium is pseudostratified. The round nuclei adjacent to the connective tissue (arrowheads) belong to the basal cells. Those nuclei that are more elongate and further removed from the base of the epithelium belong to the secretory cells. Note the terminal bars (arrows) that are evident at the apical region of these cells. The red-stained sites within the dense connective tissue represent smooth muscle cells (Ross et al., 2003).
The main function of the prostate gland is to secrete a milky-colored secretion that assists sperm motility as a liquefying agent, and its alkalinity protects the sperm in their passage through the acidic environment of the female vagina. The seminal plasma contains very high concentrations of potassium, zinc (Zn2+), citric acid, fructose, phosphorylcholine, spermine, free amino acids, prostaglandins and enzymes, and
much of this originates from the prostate. The prostate also secretes the enzyme acid phosphatase (PAP), which is often measured to assess prostate function. The prostate discharges make up about 40% of the total volume of the semen (Graaff, 2002).
1.2. Development and hormonal regulation of the prostate gland
Prostate development in the human fetus begins during the 11th to 12th week of gestation as five pairs of epithelial buds emerge from the urethral portion of the urogenital sinus, above and below the entrance of the mesonephric ducts (Figure 4). The five pairs of epithelial buds (anterior, posterior, medial, and two lateral ones) undergo branching to form a lobular arrangement of tubuloalveolar glands surrounded by stroma that encircle the developing urethra and ejaculatory ducts. The top pairs of the buds are composed of epithelia that are believed to be mesodermal in origin and form the TZ of the mature prostate; the lower buds, which form the PZ of the mature prostate, are endodermal in origin (Knobil and Neill, 2006).
The initial outgrowth of the epithelial buds is an androgen-driven process that requires AR expression in the surrounding urogenital mesenchyme to facilitate the reciprocal interactions between the epithelia and mesenchyme. At mid-gestation (~22 weeks of gestational age), the gland consists of small ducts lined by undifferentiated epithelial cells. Increasing levels of maternal estrogen cause squamous metaplasia of the epithelium (i.e., multilayering of the epithelial cells), and at birth the epithelial cells lining the immature glands vary in both the incidence and extent of squamous metaplasia. Upon birth and removal of maternal estrogen, this histological picture is reversed within approximately 4 weeks, and the neonatal gland consists of differentiated pseudostratified epithelia. At puberty, as maturation and growth proceed, the prostate is composed of increasingly complex tubuloalveolar glands arranged in lobules and surrounded by stroma in which fibroblasts, smooth muscle cells, vasculature, nerves, and lymphatics are located. The growth of the pubertal prostate gland is regulated by androgens. The levels of androgens rise during puberty and the prostate gland grows to full size; at maturity androgen levels are maintained, prostate size remains fairly constant, and the organ is considered to be relatively growth quiescent until the fourth decade of life, when growth is reinitiated (Knobil and Neill, 2006).
In the adult, the prostate gland size is maintained through a homeostatic balance between the process of renewal (proliferation) and cell death (apoptosis). This
balance is regulated by hormones secreted by the endocrine system, mainly androgens, of which testosterone is the major circulating form. In humans, the prostatic dihydrotestosterone (DHT) concentration decreases with age, but the concentrations of testosterone and 17β-estradiol (E2) are age-independent (Prins et al., 1996, Shibata et al., 2000). The age-dependent changes in the ratio of serum sex steroid concentration may play a role in benign prostatic hyperplasia (BPH) and prostate cancer (PC) development (Shibata et al., 2000).
The developmental processes between human and rodent are mechanistically similar, the timing is different. Unlike the human prostate, the rodent prostate is rudimentary at birth and branching and differentiation occur postnatally, during the first 15 days of life. During this time, solid prostatic ducts begin to canalize, initially at the urethra, and progressing distally toward the ductal tips. Concurrently, the epithelium undergoes a complex series of changes, including extensive proliferation and segregation and polarization into basal and luminal secretory epithelial cells. Concurrent with epithelial differentiation, the associated mesenchyme differentiates into dense stroma composed of interfascicular fibroblasts and smooth muscle fibers. These processes depend of androgens. Androgenic effects are mediated through ARs located in the stromal and epithelial cells before and during prostatic bud formation. Under the influence of androgens, mesenchymally derived paracrine signals induce epithelial cell differentiation. Estrogens are also present during the developmental period and influence prostatic growth. Although the prostate is highly sensitive to hormones during development, most ductal branching morphogenesis occurs before puberty, when circulating androgen levels are low (Knobil and Neill, 2006).
Figure 4: Embryology of the human prostate. The gland develops at the base of the bladder as
epithelial buds emerge from the urethral portion of the urogenital sinus, above and below the entrance of the mesonephric ducts (Knobil and Neill, 2006).
1.3. Prostate carcinogenesis
Cancer is a multifactorial disease, which results from the combination of many factors including mutations or polymorphisms of cancer susceptibility genes, environmental agents that influence the acquisition of somatic genetic changes, and several other systemic and local factors including behavior/diet, hormones and growth factors (Ponder, 2001).
PC continues to be a source of considerable morbidity and mortality for men around the world. BPH, a non-malignant overgrowth of the gland, occurs almost exclusively within the TZ of the prostate, and up to 80% of men aged 70–80 years have histological evidence of BPH. Most prostate cancers occur in the PZ, at the dorsal and dorso-lateral side of the prostate; only ≤ 30% of prostate cancers consist of TZ tumors, they have lower biochemical recurrence rates and are less malignant than tumors originating in the PZ (Joshua et al., 2008).
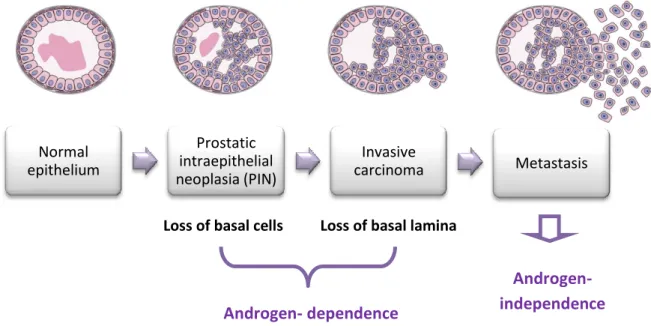
Normal epithelium Prostatic intraepithelial neoplasia (PIN) Invasive carcinoma Metastasis
1.3.1. Tumor stages development
PC progresses from precursor lesions, termed prostatic intraepithelial neoplasia (PIN), to overt carcinoma that is confined to the prostate, and finally to metastatic disease, that often results in lethality (Abate-Shen and Shen, 2002) (Figure 5).
Figure 5: Pathway of human prostate cancer progression (Adapted by Abate-Shen & Shen,
2002).
PC represents a very heterogeneous entity generally composed of a mixture of cells. The presence or absence of AR in cells confers the property of androgen dependency, and androgen-independent cells, respectively. At early stage most of the neoplasic mass is represented by androgen-dependent cells whose proapoptotic potential is regulated by AR. It is well established that this type of cells can be easily induced to undergo apoptotic cell death after androgen ablation. However, associated tumor enrichment with propagating androgen-independent cell population as well as emergence of the new cell phenotypes with enhanced resistance to apoptosis due to genetic transformations will eventually lead to the complete loss of hormone-sensitivity and curability characteristic of advanced stage of cancer (Prevarskaya et al., 2004, Mimeault and Batra, 2006, Schulz and Hoffmann, 2009)
Loss of basal cells Loss of basal lamina
Androgen-
independence
Androgen- dependence
Prostate cancer initiation
Currently, the precursor lesion, high-grade prostatic intraepithelial neoplasia (HPIN) is considered most likely to represent a forerunner to prostate cancer on the basis of pathological, epidemiological and cytogenic evidence (Joshua et al., 2008). An alternative precursor, possibly earlier, is proliferative inflammatory atrophy (PIA). PIA is defined as discrete foci of proliferative glandular epithelium with the morphological appearance of simple atrophy or postatrophic hyperplasia occurring in association with inflammation (Joshua et al., 2008, De Marzo et al., 2007). Prostate dysplastic lesions, in turn, may subsequently give rise to a heterogeneous population of cancer epithelial cells showing aberrant differentiation, unlimited division and a decreased rate of apoptotic cell death (Mimeault and Batra, 2006).
The causes of PC remain poorly understood. Many gene products show deregulated functions. Numerous growth factors and their receptors are also overexpressed during the progression of this hyperproliferative disease. These specific changes of gene expression in epithelial and stromal tumor cells during the different developmental stages of PC notably contribute in enhancing the tumor cell growth, survival, migration and invasiveness. In particular, the activation of multiple developmental signaling cascades including AR, ER, and EGFR, HER‟s-2, hedgehog and Wnt/b-catenin signaling pathways may confer to them the aggressive phenotypes that are observed in high prostatic PIN grades of malignancy and adenocarcinomas (Figure 6 and 7). More specifically, β-catenin-induced prostate lesions were associated with increasing c-Myc and AR expression levels and an increasing rate of cell proliferation (Mimeault and Batra, 2006).
Moreover, the down-regulation of several apoptotic signaling cascade elements in metastatic PC cells, such as the ceramides and caspases, combined with the enhanced expression of antiapoptotic factors, such as Bcl-2, may also contribute to the survival of tumor epithelial cells (Mimeault and Batra, 2006).
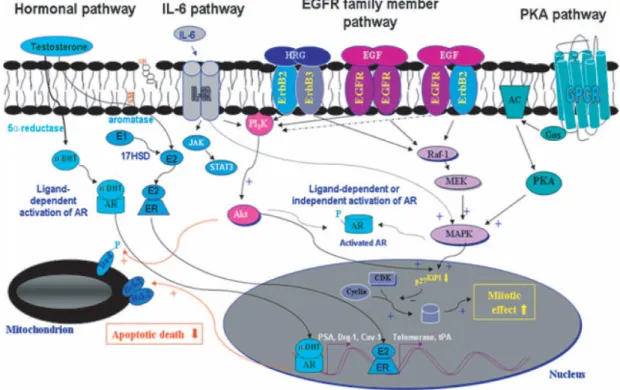
Figure 6: Scheme showing the possible mitogenic and antiapoptotic cascades induced through
the androgen receptor (AR), estrogen receptor (ER), epidermal growth factor receptor (EGFR), interleucine-6 (IL-6) and protein kinase A (PKA) signaling pathways. The possible stimulatory effect of growth factor signaling elements on the Mitogen-Activated Protein Kinase (MAPK) and/or phosphoinositide 3-kinase (PI3K) /Akt which may be involved in androgen-dependent and androgen-independent activation of AR in certain PC cells are shown. The enhanced expression levels of AR- and ER-target genes which can contribute to an increase in the tumorigenicity of PC cells are indicated (Mimeault & Batra, 2006).
Figure 7: Scheme showing the possible mitogenic and antiapoptotic cascades induced through
the epidermal growth factor- epidermal growth factor receptor (EGF–EGFR), hedgehog, Wnt and other growth factor signaling pathway elements co-localized in caveolae. The pathways which are involved in the stimulation of sustained growth, survival and migration of prostatic cancer cells are shown. The enhanced expression levels of numerous tumorigenic genes, including vascular endothelium growth factor (VEGF), interleucine-8 (IL-8), matrix metalloproteinases (MMPs) and uPA, which can contribute to an increase in the angiogenesis, are indicated (Mimeault & Batra, 2006).
Prostate Cancer development and metastasis
Almost all PCs initially develop from secretory epithelial cells of the prostate gland and generally grow slowly within the gland. When the tumor cells penetrate the outside of the prostate gland they may spread to tissues near the prostate, first to the pelvic lymph nodes and eventually to distant lymph nodes, bones and organs such as the brain, liver and lungs. The in vitro and in vivo characterization of the behavior of numerous human PC cell lines as compared with the normal prostatic epithelial cells, has notably indicated that several oncogenic signaling cascades are involved in regulating the progression from localized and androgen-dependent PC forms into aggressive and androgen independent states (Mimeault and Batra, 2006). Androgen independence is associated with the appearance of new cell phenotypes, characterized by apoptosis inhibition, associated with elevated expression of p53, p21/waf1, BCL-2,
bax and the BCL-2/bax ratio rather than enhanced proliferation (Prevarskaya et al., 2004, Jin-Rong et al., 2004).
The enhanced expression of a variety of growth factors, including EGF, fibroblast growth factor (FGF), hepatocyte growth factor (HGF), nerve growth factor, insulin-like growth factor-1 (IGF-1) and vascular endothelial growth factor (VEGF) appears to assume a critical role in inducing changes in stromal–epithelial cell interactions during PC development (Mimeault and Batra, 2006).
Hence, the oncogenic changes in the tumor stromal– epithelial cells, which may be induced by the activation of distinct growth factor signaling cascades, may confer a more malignant behavior to cancer progenitor cells during the progression from localized PC forms into metastatic states.
1.3.2. Differently-expressed genes
PC cells contain many somatic mutation, gene deletion, gene amplifications and changes in DNA methylation, probably accumulated over a period of several decades (Sciarra et al., 2008).
The progression of epithelial prostate cells from a normal differentiated state, in which proliferation and apoptosis are tightly balanced, to a malignant state involves a combination of events resulting in the activation of oncogenes in addition to the loss of TSGs (tumour-suppressor genes), which critically control aspects of the hallmarks/phenotypes of cancer (Ramsay and Leung, 2009). The enhanced expression of numerous oncogenes and/or a decreased expression of TSGs are induced through the gene amplification and chromosomal deviation or deletion, respectively (Mimeault and Batra, 2006).
TSGs critically regulate the cell cycle, apoptosis, DNA repair, senescence and angiogenesis. TSGs such as p53 and PTEN (phosphatase and tensin homologue deleted on chromosome 10) are important in prostate carcinogenesis (Ramsay and Leung, 2009).
PC cells overexpress several growth factors and their receptors and show enhanced expression and/or activity of a variety of antiapoptotic gene products (Table 1). More specifically, the enhanced expression of cell survival products, such as EGFR (ErbB1), ErbB2 (Her-2/neu), BCL-2, p53, syndecan-1 and clusterin, are among the most frequent genetic alterations observed in metastatic PC (Mimeault and Batra, 2006).
In addition, the up-regulated expression of diverse markers, such as macrophage inhibitory cytokine-1 (MIC-1), Myc, caveolin-1, integrin-linked kinase (ILK), mucin 1 (MUC1), mucin 18 (MUC18) and histone deacetylase 1 (HDAC1), has also been associated with PC progression to more advanced pathological stages (Table 1). On the other hand, inactivating mutations in several TSGs, such as phosphatase PTEN/MMACI and p53, as well as silencing by hypermethylation of distinct invasion suppressor genes, including differentiation related gene-1 (Drg-1), E-cadherin and membrane-anchored serine prostasin, have also been associated with high-grade PINs and a more malignant phenotype of PC cells (Table 1) (Mimeault and Batra, 2006, Meyer et al., 2004). RAS genes activation by point mutations is conspicuously lacking in prostate cancer (Schulz and Hoffmann, 2009).
Similarly, the microarray analyses of differently-expressed genes in early passage androgen-sensitive LnCAP-C33 cells and late passage androgen- independent LNCaP-C81 cells have revealed that several genes, including guanine nucleotide-binding protein Gi, α-1 subunit, cyclin β1, cyclin-dependent kinase-2 (CDK-2), c-myc, c-myc purine-binding transcription factor, macrophage migration inhibitory factor (MIF) and MIC-1, are up-regulated in androgen-independent LnCAP cells (Mimeault and Batra, 2006).
Table 1: Differently-expressed genes in Prostate Cancer (Adapted from Mimeault & Batra,
2006).
Up-regulated genes
Growth factor receptors
c-erbB1 (EGFR), c-erbB2 (HER-2/neu), c-erbB3(HER-3), PTCH receptor, IGF-1R, FGFR, VEGFR
Growth factors
EGF, TGF-α, HB-EGF, amphiregulin, HRG, Wnts, IGF-1,
IGF-2, FGFs, HGF, IL-6, VEGF
Signaling elements
GLI-1, cyclin D1, telomerase, c-myc, caveolin-1, Bcl-2, survivin, clusterin, syndecan-1, NF-kB, ILK,
β-catenin, PKCε,
HDAC1, COX-2, MMP-2, MUC1, MUC18, S100P, FKBP51, RAS
Down-regulated
1.3.3. Role of calcium in Prostate cancer
Proliferation and apoptosis are two key processes determining normal tissue homeostasis. Deregulated cell proliferation together with the suppression of apoptosis provides the condition for abnormal tissue growth, which ultimately can turn into uncontrolled expansion and invasion characteristic of cancer. Although in molecular terms proliferation and apoptosis seem to be clearly delineated with the first one relying on cyclin-dependent protein kinases (CDKs), key regulators of the cell division cycle, and the second one on cysteine proteases, the so-called caspases, primary executioners of the programmed cell death. They both involve intense calcium (Ca2+) signaling and Ca2+ homeostasis provides critical environment for their unfolding (Prevarskaya et al., 2004).
In general, there are three major Ca2+ pools that living cells can utilize for producing various types of cytosolic Ca2+ signals: extracellular space, endoplasmatic reticulum, and mitochondria (Abeele et al., 2002). Normal cells maintain a tight regulation over their intracellular Ca2+ ([Ca2+]i) activity, with Ca2+ entry occurring via one or more pathways including voltage-gated Ca2+ channels, receptor-activated channels and non-specific cation channels (Ding et al., 2006).
In PC epithelial cells Ca2+ entry from extracellular space is mainly supported by the mechanism called „„capacitative calcium entry‟‟ (CCE) or „„store-operated calcium entry‟‟ (SOCE). This mechanism is capable of monitoring the endoplasmatic reticulum Ca2+ filling and permits the influx only when endoplasmatic reticulum content essentially decreases. It is mediated via specialized plasma membrane store-operated Ca2+- permeable channels (SOC) (Vanoverberghe et al., 2003).
Progression of PC to the stage of androgen- independence is accompanied by the appearance of new apoptotic-resistance cell phenotypes. One of them is closely associated with overexpression of the common anti-apoptotic oncoprotein, BCL-2 (Prevarskaya et al., 2004, Abeele et al., 2003). BCL2 overexpression in LnCAP prostate cancer epithelial cells results in downregulation of store-operated Ca2+ current by decreasing the number of functional channels and inhibiting endoplasmatic reticulum Ca2+ uptake (Abeele et al., 2002).
The primary cause of apoptosis induction in response to androgen ablation is sustained elevation of [Ca2+]i with consequent activation of Ca2+–Mg2+-dependent endonuclease involved in genomic DNA fragmentation (Prevarskaya et al., 2004).
apoptosis via elevation of cytosolic Ca2+, but increased [Ca2+]i per se leads to the down-regulation of AR expression (Prevarskaya et al., 2004) (Figure 8).
.
Figure 8: Schematic depiction of the differences in Ca2+-dependent apoptotic pathways in androgen-dependent and androgen-independent prostate cancer (PC) epithelial cells. Left-hand panel presents androgen-dependent PC cell expressing endoplasmic reticulum (ER) leak channels, SERCA pump, intraluminal calreticulin (CRT), and plasma membrane store-operated Ca2+ channels (SOCs), whose concert activity provides sufficient ER Ca2+ filling and store-operated Ca2+ entry to maintain both ER depletion/stress- and Ca2+ entry-dependent apoptotic pathways operational. Transition to androgen-independent phenotype (right-hand panel) is associated with significantly lowered ER Ca2+ filling due to underexpression of CRT and SERCA pump combined with the enhanced Ca2+ leak (shown by thicker arrows via ER leak channels) and decreased store-operated Ca2+ entry most probably due to diminished density of SOCs, which eliminates ER depletion/stress-dependent apoptotic pathway and reduces the effectiveness of a Ca2+ entry-dependent one (Prevarskaya et al., 2004).
2. Characterization of Regucalcin: molecular biology and
physiological roles
Regucalcin (RGN) was discovered in 1978 as a Ca2+-binding protein that does not contain the EF- hand motif of Ca2+ binding domain (Yamaguchi and Yamamoto, 1978). Because of its relationship to aging and its molecular mass of 30 kDa, this peptide was also designated senescence marker protein-30 (SMP30) (Fujita et al., 1996a). Kondo et al (2006) found a homology between rat SMP30 and two species of bacterial guconolactonase (GNL: EC 3.1.1.17) derived from Nostoc punctiforme and Zymomonas mobilis. SMP30 has lactonase activity toward the aldonolactones D- and L-glucono-δ-lactone, D- and L-gulono-γ-lactone, and D- and L-galactono-γ-lactone, with a requirement for Zn2+ or Mn2+ as a cofactor. The lactonase reaction with L-gulono-γ-lactone is the penultimate step in vitamin C (L-ascorbic acid) biosynthesis (Kondo et al., 2006).
2.1. Gene/mRNA/protein
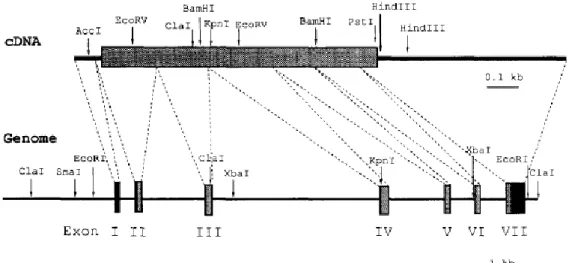
The rat RGN cDNA , 1,600 bp in length, has an open reading frame of 897 bp, which encodes 299 amino acids with a calculated molecular weight of 35 KDa and an estimated isoelectric point of 5.101 (Fujita et al., 1992). RGN gene has been assigned to the p11.3-q11.2 segment of X chromosome (Fujita et al., 1996a) and it is organized into 7 exons and 6 introns, spanning approximately 17.5 kb (Figure 9). Primer extension analysis revealed two major transcription initiation sites located 101 and 102 bp upstream from the ATG translation initiation codon (Fujita et al., 1996a). The nucleotide (nt) sequence of 5' flanking region showed a TATA-like sequence, a CAAT box, and SP-1 sites at nt -29, -72 and -169 in the promoter region, respectively. In addition to these conventional transcription factor binding sites, were found two clustered Sp1 boxes with AP-2 at nt -2900 and -21376 in the distal promoter region. RGN gene also contains binding sites for two classes of C/EBP transcription factors that are highly expressed in the liver in addition to AP-2, AP-1, GATA-1, and AP-1/GRE (Fujita et al., 1996a).
In terms of RGN mRNA, a wild-type transcript (wt) and two transcript variants (Δ4 and Δ4,5) were identified in human breast and prostate tissue and cells (Figure 10). The Δ4 and Δ4,5 transcripts are likely generated by alternative splicing events and
if translated may encode proteins with 227 and 183 amino acids, respectively (Maia et al., 2009).
Figure 9: Restriction maps of cDNA and genomic DNA of mouse Regucalcin (RGN), and the
genomic organization of mouse RGN. Relevant restriction enzyme sites are indicated in the scheme. Coding and non-coding regions of cDNA are indicated by a gray box and bold solid lines, respectively. Exons are indicated by gray boxes (coding region) and black boxes (non-coding region). Introns are indicated by solid lines. Dashed lines show relationship between the cDNA and the genomic structure of RGN (Fugita et al., 1996).
Figure 10: Regucalcin mRNA transcripts in human breast and prostate tissues and cell lines. A:
RT-PCR analysis using specific primers spanning the entire coding region of regucalcin. Lane M: DNA Molecular Weight Marker; Lane 1: Non-neoplasic breast tissue; Lane 2: MCF-7 cells; Lane 3: Non-neoplasic prostate tissue; Lane 4: LNCaP cells; Lane 5: Negative control with total RNA not reverse transcribed. B. Diagram of the organization of human regucalcin gene and mRNA variants amplified in RT-PCR reactions. Gray and black boxes indicate coding and noncoding exons, respectively. Dotted lines correspond to introns. Exons are marked with roman numerals. Arabic numerals indicate the number of base pairs per exon or intron, or the number of amino acids (aa) encoded by each exon. WT: wild type regucalcin coding region; Δ4: regucalcin exon 4-deleted variant; Δ4,5; regucalcin exon 4 and exon 5-deleted variant (Adapted from Maia et al, 2009).
RGN is evolutionarily conserved only in higher animals and this gene is not found in yeast (Fujita et al., 1992). The amino acid sequence of mouse RGN showed 94% similarity to rat RGN and 89% to human RGN. In fact, the entire primary structure of RGN is conserved among humans and rodents, suggesting that its complete structure is required for the physiological function of RGN (Fujita et al., 1995, Fujita et al., 1996a)
The primary structure of RGN protein did not show the known Ca2+ binding domain, such as an EF-hand motif, and it may represent a calcium binding protein of a novel type.
The Ca2+-binding constant was found to be 4.19 x 10⁵ M-1 by equilibrium dialysis, and there appears to be six or seven high-affinity binding sites for Ca2+ per molecule of protein. The hydropathy profile of RGN showed that there was a hydrophobic sequence in both N-terminal and C-terminal regions of the RGN molecules. However, the protein showed a hydrophilic character as molecule (Shimokawa and Yamaguchi, 1993). RGN molecule contains aspartic acid (24 residues) and glutamic acid (16 residues) which were suggested to be related with Ca2+-binding (Yamaguchi, 2000b).
Very recently, the crystal structure of the human RGN has been determined by X-ray diffraction and the protein has a 6-bladed β-propeller fold, and it contains a single metal ion (Figure 11). Also, both Zn2+ and Ca2+-bind to the same metal-binding site in an identical manner. This is interesting, as normally the coordination of Zn2+ is quite distinct from that of Ca2+ in enzymes. Previous studies, with rat and mouse RGN, have reported that Zn2+ is the metal of choice in gluconolactonase activity and Ca2+-in cell regulation and homeostasis (Chakraborti and Bahnson, 2010).
Figure 11: Crystal structure of human Regucalcin (RGN) with calcium (Ca2+) bound. The ribbon structure of RGN displays the six-bladed β-propeller fold with each blade displayed in a rainbow color. The active Ca2+ site is shown in the middle of the β-propeller as a purple sphere (Adapted by Chakraborti & Bahnson, 2010).
2.2. Tissue expression and age-specific regulation
In rat tissues, Northern blot and immunohistochemical analyses showed that RGN was specifically expressed in the liver and kidney, where its immunoreactivity was localized in the hepatocytes (in the nuclei and cytoplasm) and the renal tubular epithelia (Fujita, 1999, Fujita et al., 1992). It is expressed in other rat tissues, namely, brain, lung, epidermis, stomach, adrenal gland, ovary, testis, mammary gland and prostate (Fujita et al., 1995, Maia et al., 2008)
In human tissues, RGN was moderately expressed in the pancreas and heart, in addition to the expression in the liver and kidney (Fujita, 1999, Fujita et al., 1992). RT-PCR and immunohistochemical analyses showed that RGN mRNA and protein were expressed in the citosol and nuclei of breast and prostate epithelial cells (Maia et al., 2009).
In livers of rats, RGN decrease androgen-independently with aging. Northern blot analysis showed a marked increase of RGN mRNA in livers of neonatal and young rats. The substantial amounts of protein and transcript were maintained in adults up to 3-6.5 months (M) of age. In the kidney, RGN mRNA and protein started to increase at day 21 and reached near-maximal levels at day 35. The levels of transcript and protein remained high in adults up to 3 M of age. As the aging process progressed to senescent stages, the levels of transcript and protein decreased significantly in the liver and kidney of aged rats. The age-associated decrease of RGN in the liver and kidney may be in a large part controlled at transcriptional levels. The high expression of RGN in the tissue-maturing process and adult suggests that RGN may be required for the maintenance of highly differentiated hepatic and renal functions (Fujita et al., 1996b).
2.3.
Regucalcin functions
2.3.1. Intracellular calcium homeostasis
Intracellular Ca2+ homeostasis is regulated by plasma membrane (Ca2+-Mg2+ )-ATPase, microsomal Ca2+-ATPase, mitochondrial Ca2+ uptake, and nuclear Ca2+ transport in cells (Carafoli, 1987).
RGN is a Ca2+-binding protein involved in the maintenance of [Ca2+]i homeostasis due to the activation of Ca2+ pumping enzymes in the plasma membrane,
endoplasmic reticulum, and mitochondria of many cell types (Takahashi and Yamaguchi, 1999, Yamaguchi, 2000a, Yamaguchi and Daimon, 2005) (Figure 12).
The high-affinity (Ca2+-Mg2+)-ATPase is located on the plasma membranes of liver and kidney cells. This enzyme acts as a Ca2+ pump to exclude the metal ion from the cytoplasm of the cells. Addition of RGN into the reaction mixture in vitro causes an increase in (Ca2+-Mg2+)-ATPase activity in the plasma membranes isolated from rat liver, suggesting a role in the regulation of Ca2+ pump activity (Takahasi and Yamaguchi, 1996). Thus, RGN has been shown to bind to liver plasma membrane lipids, and it acts on the sullhydryl (SH) groups which are an active site of (Ca2+-Mg2+ )-ATPase (Takahashi and Yamaguchi, 1994).
Figure 12: Regulatory role of Regucalcin (RGN) in Ca2+ homeostasis of liver cells. RGN increases plasma membrane (Ca2+-Mg2+)-ATPase, mitochondrial Ca2+-ATPase and microsomal Ca2+-ATPase activities in rat liver cells. Also, RGN stimulates Ca2+ release from the microsomes. RGN has an inhibitory effect on nuclear Ca2+-ATPase and a stimulatory effect on Ca2+ release from the nucleus. By this mechanism, RGN may keep the rise of cytosolic Ca2+ concentration and nuclear matrix Ca2+ levels in the cells that regulate Ca2+- dependent cellular events (Yamaguchi & Daimon, 2005).
Overexpression of RGN causes a remarkable increase in its nuclear localization, and it has suppressive effects on the gene expression of L-type Ca2+ channel or calcium polyvalent cation-sensing receptor (CaR) which regulates intracellular Ca2+ signaling in the cloned normal rat kidney proximal tubular epithelial NRK52E cells (Nakagawa and Yamaguchi, 2006).
The Ca2+ current is one of the most important components in cardiac excitation– contraction coupling. This coupling mechanism is based on the regulation of intracellular Ca2+ concentration by Ca2+ pump in the sarcoplasmic reticulum of heart muscle. It has been demonstrated that RGN is expressed in rat heart muscle, and that the protein can activate Ca2+-ATPase (Ca2+ pump enzyme) in the sarcoplasmic reticulum (Yamaguchi et al., 2002).
RGN mRNA and its protein are expressed in rat brain tissues and brain neuronal cells. The role of RGN in the regulation of Ca2+ homeostasis in brain tissues has not been fully clarified, although RGN has been reported to have inhibitory effects on Ca2+-ATPase activity in the microsomes of rat brain tissues. It has been demonstrated that RGN increases Ca2+-ATPase activity in the mitochondria of rat brain tissues, and that the enzyme activity is also elevated in transgenic rats (Yamaguchi et al., 2008).
2.3.2. Calcium-dependent Enzyme Regulation and Intracellular signaling
Protein phosphorylation-dephosphorylation is a universal mechanism by which numerous cellular events are regulated. RGN may play a physiological role in the intracellular control of the hormonal stimulation for phosphorylation and dephosphorylation of many proteins in liver cells (Yamaguchi, 2000a).
RGN has a reversible effect on the activation of various enzymes by Ca2+ in liver and kidney cells; it can inhibit the activation of Ca2+/calmodulin-dependent cyclic AMP phosphodiesterase, protein kinase C, and Ca2+/calmodulin-dependent protein kinase (Yamaguchi, 2000a, Tsurusaki and Yamaguchi, 2000).
RGN can inhibit the activation of cyclic AMP phosphodiesterase by Ca2+/calmodulin, responsible for the degradation of the cyclic AMP, and it can inhibit Ca2+/calmodulin dependent protein kinase activity in the cytosol of rat liver and renal cortex cells (Yamaguchi and Tai, 1991, Yamaguchi and Kurota, 1997, Kurota and Yamaguchi, 1997).
Protein kinase C is capable of phosphorylating cytoplasmic proteins. It has been found that RGN inhibits liver cytosolic protein kinase C activity, supporting the view that RGN plays a role in the regulation of Ca2+-dependent cellular functions. Also, RGN has an inhibitory effect on protein kinase C activity in the cytosol of rat kidney cortex (Kurota and Yamaguchi, 1998).
In regenerating rat liver RGN mRNA expression is stimulated through the pathway of signaling mechanism concerning CaM kinase, protein kinase C, and
thyrosine kinase increased by partial hepatectomy. RGN inhibits the activities of various nuclear protein kinases and phosphatases, and it inhibits nuclear DNA and RNA synthesis in proliferative liver cells. This protein may have an important role in the regulation of nuclear function in proliferative liver cells (Yamaguchi and Kanayama, 1995) (Figure 13).
RGN plays an inhibitory role in the signaling pathway which is mediated through Ca2+-dependent protein kinases in liver and kidney cells.
Figure 13: Role of Regucalcin (RGN) in the regulation of nuclear functions in regenerating rat
liver. RGN mRNA expression in liver cells is stimulated through the pathway of signaling mechanism concerning protein kinases increased by partial hepatectomy, and RGN reveals an inhibitory effect on nuclear DNA and RNA synthesis in the proliferative cells of regenerating liver. RGN may suppress the proliferation of liver cells (Yamaguchi and Daimon, 2005).
2.3.3. Protease regulation
RGN has been shown to activate neutral cysteinyl-protease including calpain in the cytosol of rat liver and kidney cortex cells, in a mechanism independent of Ca2+ (Yamaguchi and Nishina, 1995) .The ability of calpain to alter the limited proteolysis, the activity or function of numerous cytoskeletal proteins, protein kinases, receptors, and transcription factors suggests an involvement of the protease in various Ca2+ -regulated cellular functions. If RGN activates cysteinyl proteases including calpain, it may be implicated in many cellular functions which are regulated by cyteinyl proteases in liver cells (Yamaguchi, 2000a).
2.3.4. Apoptosis and cellular proliferation
RGN has been shown to have a suppressive effect on cell proliferation. The expression of RGN mRNA is enhanced in the proliferative cells after partial hepatectomy in rats (Yamaguchi and Kanayama, 1995) and the translocation of RGN into the nucleus is increased in regenerating rat liver. Endogenous RGN has been shown to prevent the enhancement of nuclear DNA and RNA synthesis in regenerating rat liver, suggesting that the protein regulates proliferation of liver cells (Tsurusaki et al., 2000, Tsurusaki and Yamaguchi, 2002, Tsurusaki and Yamaguchi, 2003b). Endogenous RGN has been shown to have a suppressive effect on cell proliferation and DNA synthesis in the cloned rat hepatoma H4-II-E cells overexpressing RGN (Misawa et al., 2002). RGN is found to bind nuclear proteins or DNA in vitro, and their overexpression suppresses the expression of oncogenes c-myc, Ha-ras, or c-src and enhances the expression of TSGs p53 and Rb in the cloned hepatoma cells (Tsurusaki and Yamaguchi, 2003a). Cell proliferation is suppressed in NRK52E cells overexpressing RGN in vitro (Nakagawa and Yamaguchi, 2005).
The suppressive effect of RGN on cell proliferation is partly mediated through the regulation of intracellular signaling-related factors. RGN enhances p21 mRNA expression, which participates in cell cycle arrest and suppresses IGF-I mRNA expression, a growth factor in cell proliferation, in the hepatoma cells. It suppresses the expression of p53 mRNA in the cloned rat hepatoma H4-II-E cells. p53 is known to stimulate p21 mRNA expression to induce cell-cycle arrest (Yamaguchi and Daimon, 2005). RGN downregulates several proteins involved in cell proliferation such as Ca2+- dependent protein kinases, tyrosine kinases, protein phosphatases and NO synthase (Yamaguchi, 2000a, Yamaguchi, 2005).
Contrastingly, there are also reports describing RGN roles suppressing cell death and apoptosis.
RGN promotes Akt activation in HepG2/RGN cells, which has an anti-apoptotic effect in many different types of cells, in the presence or absence of Tumor necrosis factor -α (TNF-α) plus actinomycin (ActD). This effect was dependent on CaM (Matsuyama et al., 2004). In addition, SMP30-KO mice hepatocytes were more susceptible to apoptosis induced by TNF- plus ActD than hepatocytes from wt mice (Ishigami et al., 2002, Maruyama et al., 2010).
RGN regulates Ca2+ kinetics involved in the plasma membrane Ca2+-pumping activity of HepG2 and LLC-PK1 cells showing that RGN could rescue cells from an apoptotic death induced by a high intracellular Ca2+ level ([Ca2+]i) (Kondo et al., 2004).
It has been demonstrated that RGN overexpression has a preventive effect on cell death and apoptosis induced by LPS or other intracellular signaling-related factors in the cloned rat hepatoma H4-II-E cells (Izumi and Yamaguchi, 2004).
In NRK52E cells RGN overexpression has a suppressive effect on cell death and apoptosis induced by various apoptotic factors. Bcl-2 is a suppressor in apoptotic cell death. Overexpression of RGN caused a remarkable elevation of Bcl-2 mRNA expression in NRK52E cells, and it slightly stimulated Akt-1 mRNA expression in the cells (Nakagawa and Yamaguchi, 2005).
It also plays a profound role in rescuing cells from cellular injuries such as apoptosis and hypoxia (Ishigami et al., 2002).
2.4.
Regucalcin expression in prostate pathophysiological state.
Very recently, Maia et al (2008) demonstrated for the first time that RGN mRNA and protein are expressed in the citosol and nuclei of rat and human prostate epithelial cells (Maia et al., 2008). Moreover, it was described a diminished expression of RGN protein in human prostate cancer cases, which was correlated with tumor differentiation (Maia et al., 2009).
Primary prostate cancers are dependent of androgenic stimulation and a reduction of RGN mRNA expression was observed in LnCAP cells in response to DHT stimulation (Maia 2009).
The present project aims to determine the role of RGN on the expression of oncogenes and TSGs in prostate cell lines. To achieve this goal, the following specific objectives were delineated:
1. Characterize RGN expression in prostate tissues and cell-lines: different post-natal ages; cell-lines and immunolocalization in tissue sections;
2. Construction of expression vectors for wt RGN and, Δ4 and Δ4,5 variants; 3. Culture and transfection of non-neoplasic and neoplasic prostate cell lines;
4. Confirmation of RGN-overexpression in non-neoplasic and neoplasic prostate cell lines;
5. Determine the effect of RGN on the expression of oncogenes and TSGs in non-neoplasic and non-neoplasic prostate cell lines.
1. Reverse Transcriptase –Polymerase Chain Reaction-
RT-PCR
RT-PCR consists in three procedures: RNA extraction, cDNA synthesis and polymerase chain reaction (PCR) which permits the analysis of patterns of gene expression.
1.1. Total RNA extraction
Total RNA (RNAt) was extracted using TRI reagent (Sigma) according to the manufacturer‟s instructions. TRI is a mixture of guanidine isothiocyanate and phenol which dissolves DNA, RNA and proteins.
An appropriate volume of TRI-Reagent was added to cells or tissues, which were homogenized using an Ultra turax T25 basic (IKA ® WERKE) and incubated for 5 minutes (min) at room temperature to dissociate nucleoprotein complexes. 200 µl of chloroform (Sigma) per ml of TRI reagent was added, and the sample was vortexed vigorously for 15 seconds and incubated for 2-10min at room temperature (RT). After that incubation period, samples were centrifuged (12.000g for 15min at 4ºC) and the mixture was separated into three distinct phases. The upper, aqueous phase, which contains RNA, was transferred to a fresh tube and 500 µl of isopropanol per ml of TRI reagent used was added. Samples were incubated for 5-10min at RT and centrifuged at 12.000g for 10min at 4ºC. The supernatant was removed and the RNA pellet washed with 1ml of 75% DEPC-Ethanol (at -20ºC) per ml of TRI reagent used. After centrifugation at 7.500g for 5min at 4ºC, the supernatant was removed and the wash step was repeated. Finally, the resultant RNA pellet was dried at 55-60ºC and ressupended in an appropriate volume of DEPC-treated water (Sigma).
In order to assess the quantity and integrity of total RNA, its optical density was determined by measuring absorbance at 260 and 280 nm and the corresponding ratio was calculated (Pharmacia Biotech, Ultrospec 3000). RNA extracts were also inspected by agarose gel electrophoresis with ethidium bromide using an appropriate photography and image acquisition equipment (Vilber Lourmat).
1.2. cDNA synthesis
cDNA synthesis is the enzymatic conversion of RNA to a single-stranded cDNA template. 1 µg of RNAts were reverse transcribed into cDNA. Firstly, RNAt was incubated at 65ºC for 5min with dNTP mix, random hexamer primers (Table 2), and DEPC water to a final volume of 12 µl.
After a brief centrifugation, mixtures were incubated for 2min at 37ºC with 5x First-Strand Buffer, RNase OUT and DTT (Table 2). 200U of M-MLV RT (Invitrogen) was added, mixed by pipetting and incubations proceeded during 10min at 25ºC, and 50min at 37ºC. The reaction was stopped by heating at 70°C for 15min, and stored at -20ºC. All incubation steps were performed in a thermal cycler (Px2 Thermo Hybaid).
Table 2: Reagents and volumes used in each cDNA synthesis reaction.
Reagent
Volume (µl)Random Hexamer Primers (Invitrogen) 2
dNTP Mix (10 nM; Amersham, GE Healthcare) 1 5x First-Strand Buffer (Invitrogen) 4
DTT (0,1 M; Invitrogen) 2
RNaseOUT-Recombinant Ribonuclease Inhibitor
(40 U/μL; Invitrogen) 1
1.3. PCR
PCR permits DNA amplification. Components of a standard PCR reaction are: termostable DNA polymerase, DNA template, primers, deoxynucleotide triphosphates (dNTPs), Buffer and MgCl2, and consists in three steps: denaturation, annealing and extension.
PCR reactions were carried out using 1μg of synthesized cDNA in a 50μl reaction containing: 5μl of Buffer, 10mM dNTPs (Amersham), 50mM of each primer pair specific to different cDNA, Taq DNA polymerase and sterile water. All PCR reactions were carried out in a thermal cycler (Px2 Thermo Hybaid).
To amplify oncogenes and TSGs cDNAs, was used 0,125U DreamTaqTM Polymerase (Fermentas) and DreamTaq Buffer (KCl, (NH) SO4 and MgCl 20 mM).
The housekeeping gene 18S was amplified as an internal control. Details of primers sequences and amplification cycles for the studied genes are listed in table 3.
For the amplification of wt, Δ4 and Δ4,5 RGN was used an enzyme with proofreading activity, Extensor (ABgene) 2,5U and 10 x Extensor Buffer 1 (22.5mM MgCl2). To amplify cDNA sequences allowing subcloning in expression vectors, RGN specific PCR primers were modified to contain NheI and XhoI recognition sites, respectively in 5‟ and 3‟ prime-ends. Details of primers sequences and amplification cycle are indicated in Table 4.
The amplified PCR fragments were separated by agarose gel (1%) electrophoresis with ethidium bromide and visualized using an appropriate photography and image acquisition equipment (Vilber Lourmat).
Table 3: Primers sequences, amplicon size and cycling conditions for amplification of oncongenes (BCL2, Ha-ras and c-myc), tumor suppressor genes (p53 and RB1) and 18S cDNAs.
Primers Sequence Amplicon
size (bp) PCR Cycle hHaRASfw748 hHaRASrv947 5´TGCTCTCCTGACGCAGCACAA3´ 5´GCTGGGGTTCCGGTGGCATT3´
219
94ºC-3min 94ºC-30s 50ºC-30s 40x 72ºC-30s 72ºC-5min hBCL-2fw1069 hBCL-2rv1529 5´CGGAGGCTGGGATGCCTTTGT3´ 5´GAGCCACACGAAGCGGTGCT3´480
94ºC-3min 94ºC-30s 55ºC-30s 40x 72ºC-45s 72ºC-5min hMycfw334 hMycrv548 5´TCCGCAACCCTTGCCGCATC3´ 5´CGCGGGAGGCTGCTGGTTTT3´ 234 94ºC-3min 94ºC-30s 56ºC-30s 40x 72ºC-30s 72ºC-5min hRB1fw1626 hRB1rv2479 5´TGGCGTGCGCTCTTGAGGTT3´ 5´TAGGGGGCCTGGTGGAAGCA3´ 873 94ºC-3min 94ºC-30s 55ºC-30s 40x 72ºC-30s 72ºC-5min hP53fw191 hP53rv750 5´CACTGCCATGGAGGAGCCGC3´ 5´GGAGGGGCCAGACCATCGCT3´ 579 94ºC-3min 94ºC-30s 55ºC-30s 40x 72ºC-60s 72ºC-5min 18sfw 18srv 5‟AAGACGAACCAGAGCGAAAG3‟ 5´GGCGGGTCATGGGAATAA3´ 152 94ºC-2 min 94ºC- 30 s 56ºC- 30 s 25x 72ºC- 30 s 72ºC- 5 minTable 4: Primers sequences, amplicon size and cycling conditions for amplification of
wt, Δ4 and Δ4,5 RGN cDNAs.
Primers Sequence Amplicon
size (bp) PCR Cycle hRGNfwNhe1 hRGNrevXho1 5‟TGAGCTAGCCTGCGACCATGTCTTCCATTA3´ 5´CCTGCTCGAGTCCCGCATAGGAGTAGGGAC3´ WT-897 Δ4-681 Δ4,5-549 94ºC-5min 94ºC-30s 60ºC-30s 40x 68ºC-60s 68ºC-5min
2. Cloning of RT-PCR DNA fragments
Cloning involves construction of hybrid DNA molecules that are able to self-replicate in a host cell. In this procedure, the plasmid and the DNA fragment are engineered to be linear molecules with termini compatible to be joined by ligation.
The PCR products obtained from liver cDNA amplification were cloned in pGEM-T easy vector (Promega) and sequenced to confirm the identity of the amplicons.
2.1. PCR products purification
The cDNAs encoding human wt, Δ4 and Δ4,5 RGN were purified from agarose gel bands using the Nuleospin extract II, PCR clean-up/ Gel extraction kit (MACHEREY-NAGEL) according to the manufacturer‟s instructions.
After running the agarose gel, the gel band was excised from the gel and weighted. For each 100 mg of gel, 200 μl of Binding buffer NT was added. After incubation of the mixture at 50ºC to dissolve the gel, the column was placed into the collecting tube; the sample was loaded with 600 μl of wash buffer NT3 and centrifuged for 1min at 11.000g. The flow was discarded and the column was placed back into collecting tube. The centrifugation was repeated for 2min to completely dry membrane. Finally, the column was placed into a clean tube, 20-25 μl of elution buffer NE was added and the sample was incubated at room temperature for 1min. The DNA was collected by centrifugation for 1min at 11.000g and stored at 4ºC. The purification efficiency was confirmed by electrophoresis on a 1% agarose gel.