Ana Rita Adrião Rosário
Licenciada em Ciências de Engenharia do Ambiente
Application of the electrodialytic process
for tungsten recovery and arsenic removal
from mine tailings
Dissertação para obtenção do Grau de Mestre em Engenharia do
Ambiente, Perfil de Engenharia de Sistemas Ambientais
Orientador: Mestre Joana Saraiva Rocha de Almeida, CENSE, FCT NOVA Co-orientador: Professora Doutora Alexandra de Jesus Branco Ribeiro, CENSE, DCEA, FCT NOVA
Júri:
Presidente: Professora Doutora Maria Teresa Calvão Rodrigues Arguente: Doutora Maria Dolores Villén Guzman
Vogal: Mestre Joana Saraiva Rocha de Almeida
Application of the electrodialytic process for tungsten recovery and arsenic
removal from mine tailings
Copyright © Ana Rita Adrião Rosário, FCT/UNL 2018
Acknowledgements
I want to thank Professor Alexandra Branco Ribeiro for the opportunity she gave me to work on this challenging topic, in collaboration with CENSE (Center for Environmental and Sustainability Research). This work received funding from FCT/MCTES through grant UID/AMB/04085/2013, from the European Union’s Horizon 2020 research and innovation programme under the Marie Skłodowska-Curie grant agreement No. 778045 (project e.THROUGH), and from the European Regional Development Fund, under the INTERREG Europe project REMIX - Smart and green mining regions of EU. I am grateful to be able to participate in this project.
I am also thankful to Master Joana Almeida for her supervision and constant support during all phases of my dissertation.
I also express my gratitude to all other RESOLUTION Lab members. They received me very well and accompanied me every day. I would like to acknowledge Doctor Eduardo Mateus for his support with the analytical methodologies.
Professor José António Almeida, from DCT FCT NOVA, is also acknowledged for providing the mine tailings sample and its initial analysis.
A special thank goes to FCT NOVA and to all my dear Professors who contributed not only for my academic background but also for my personal growth.
I am also grateful to my amazing parents: my father, my mother, Zé and Esmeralda. They were always by my side and available to listen my difficulties and my successes, despite not being experts in the topic. Your role in my life is very important and I am sure it will keep like that in my future. Thanks for believe and support me unconditionally! I love you.
I would like to highlight the people who marked my academic journey. I want to thank Joana Gomes, who was with me since the first year and shared the hardest year ever, but also the funniest. To my friend Joana, Inês, Sofia and Mariana, thanks for being with me during this chapter, making this period more stress-free and funnier.
Resumo
A deposição de resíduos de minas em barragens a céu aberto pode causar problemas ambientais. Por outro lado, estes resíduos podem constituir uma fonte secundária de matérias-primas críticas. A presente dissertação consiste no primeiro estudo da eficiência do processo electrodialítico (ED) para recuperar tungsténio (W) e remover arsénio (As) de resíduos da mina da Panasqueira (Covilhã, Portugal).
Realizaram-se nove experiências, algumas em duplicado, com recurso a células com dois (2C) e três (3C) compartimentos, na presença de membranas de troca catiónica (CAT) e aniónica (AN), com intensidades de corrente entre 0 e 100 mA e durações entre 7 e 14 dias. A amostra de resíduos de minas foi colocada no compartimento central na célula 3C e diretamente no compartimento do ânodo ou do cátodo nas células 2C.
Os resultados mostram que a configuração da célula com 2C e uma AN apresentou a maior recuperação de W (0.15 %) e remoção de As (23.51 ± 21.33 %). Nos casos de aplicação de uma CAT na mesma configuração, não se verificou migração de W e As para o compartimento do electrólito pelo que não ocorreu recuperação e remoção dos elementos. Posteriormente realizaram-se testes preliminares com a adição de três adjuvantes à amostra. Utilizou-se uma configuração de célula 2C e uma CAT dado que a célula 2C AN mostrou-se instável. Com a adição do adjuvante B, conseguiu-se uma recuperação de W de 0.64 % e uma remoção de As de 9.48 %.
Quanto maior a intensidade de corrente aplicada, melhor os resultados obtidos na recuperação de W e remoção de As. No entanto, a recuperação de W foi menor que a remoção de As, tal deve-se à presença de sulfatos na amostra que promovem a formação de complexos com o W. Futuramente devem ser realizados trabalhos experimentais para otimizar as condições da célula ED, não obtidas na presente dissertação.
Abstract
Mining tailings (MT) deposited in open dams can cause environmental problems. On the other hand, these residues can be seen as a secondary source of critical raw materials. The present dissertation is the first attempt to study the efficiency of the application of the electrodialytic process (ED) for tungsten (W) recovery and arsenic (As) removal from Panasqueria mine residues (Covilhã, Portugal).
Nine experiments were performed, some in duplicate, using cells with two (2C) and three (3C) compartments, in the presence of cation (CAT) and anion (AN) exchange membranes, with current intensities between 0 and 100 mA and durations between 7 and 14 days. The MT sample was placed in the central cell compartment in the 3C setup and directly in the anode or cathode compartment in a 2C cell.
The results show that the 2C cell setup with an AN presented the highest W recovery (0.15 %) and As removal (23.51 ± 21.33 %). When a CAT was applied to the same cell configuration, W and As migration from the sample to the electrolyte compartment was not verified, and no elements recovery or removal occurred. Further preliminary tests were carried out adding threeadjuvants to the sample. The 2C cell setup with a CAT was applied since the 2C AN cell showed to be instable. When the adjuvant B was added, the recovery of W achieved 0.64 % and the removal of As 9.48 %.
The higher the current intensity applied the better the W recovery and the As removal obtained. However, W recovery was lower than the As due to the presence of sulfates in the sample that promote the formation of W complexes. Future experimental work should be carried out to optimize the ED conditions, not obtained in the present dissertation.
Table of Contents
1 Introduction ... 1
2 Literarure review ... 3
2.1 Mining industry ... 3
2.2 Tungsten ... 8
2.3 Arsenic ... 17
2.4 Electrodialytic process... 23
2.4.2 Metal speciation of MT from Norway before and after electrodialytic extraction ... 26
2.5 Analytic techniques ... 28
2.5.1 W and As determination ... 28
3 Material and methods ... 31
3.1 Initial characterization ... 31
3.2 Electrodialytic experiments ... 32
3.3 Analytical methodologies ... 35
3.4 Statistical analysis ... 36
4 Results and discussion ... 37
4.1 Initial characterization ... 37
4.1.1 pH desorption ... 38
4.2 Electrodialytic experiments ... 39
4.2.1 pH and conductivity variation along the experiments... 39
4.2.2 W and As distribution in the ED cell ... 41
4.2.3 W recovery and As separation in the ED cell ... 43
4.3 Energy and material costs ... 49
5 Conclusions ... 53
6 Future developments ... 55
List of figures
Figure 2.1- Mine processing scheme ... 3
Figure 2.2 – Variation of global temperature vs CO2 concentration ... 4
Figure 2.3 – Global greenhouse gas emission by sector ... 5
Figure 2.4 - Main operational categories in mining exploration... 5
Figure 2.5 – Cost benefit analyses metodologie ... 6
Figure 2.6 - Location of Panasqueira mine ... 7
Figure 2.7– Processing plant of sands and slimes ... 8
Figure 2.8 – Tungsten metal... 9
Figure 2.9 - Effect of pH on tugsten speciation ... 11
Figure 2.10. – W processing scheme ... 12
Figure 2.11- Stages of W processing for different materials ... 13
Figure 2.12 - Price variation of W ... 14
Figure 2.13 - Tungsten replacement analysis ... 14
Figure 2.14 - Identification of natural and man-made sources os As ... 18
Figure 2.15 - Wolrd distribution of As contaminations and sources ... 18
Figure 2.16 - Effect of pH on arsenic speciation ... 20
Figure 2.17- Schematic representation of the three compartment electrodialytic cell (3C). ... 23
Figure 2.18–Electrodialysis. ... 27
Figure 3.1 – Applyed methodology ... 31
Figure 3.2 – Schematic representation of the ED cell ... 33
Figure 4.1 – Sample in study: Panasqueria MT ... 37
Figure 4.2 – MT composition ... 37
Figure 4.3 - W pH desorption ... 38
Figure 4.4 - As pH desorption ... 38
Figure 4.5 – MT solution pH measured during the experiments. ... 39
Figure 4.6 - Electrolyte pH measured during the experiments. ... 40
Figure 4.8 – MT solution conductivity measured during the experiments. ... 40
Figure 4.9 - Electrolyte conductivity measured during the experiments. ... 41
Figure 4.10 – 2C ED cell setup ... 41
Figure 4.11 – W compartment distribution ... 42
Figure 4.12 – As compartment distribution ... 42
Figure 4.13 - As separation and W recovery, E1 ... 45
Figure 4.14 - As separation and W recovery, E2+ ... 45
Figure 4.15 - As separation and W recovery, E2- ... 46
Figure 4.16 - As separation and W recovery, E3 ... 46
Figure 4.17 - As separation and W recovery during time, E4 ... 48
Figure 4.18 - As separation and W recovery during time, E5 ... 48
Figure 4.19 - As separation and W recovery during time, E6 ... 48
List of tables
Table 2.1 - Synthesis of tungsten reserves in Europe ... 6
Table 2.2 – Panasqueira mines characteristics ... 8
Table 2.3 – Chemical and physical characteristics of W ... 10
Table 2.4 – W complexes ... 10
Table 2.5 - Tungsten recycling types ... 15
Table 2.6 – Recycling efficiency ... 15
Table 2.7- Hydrometallurgical processes for valuable metals recovery from WC scrap ... 16
Table 2.8 - Thermal oxidation methods for treatment of WC scrap ... 17
Table 2.9 - Electrochemical processing for WC scrap recycle ... 17
Table 2.10 – Chemical and physical characteristics of As ... 19
Table 2.11–Principal producers of As ... 20
Table 2.12- Principal applications of As in different sectors ... 21
Table 2.13 – Methods to remove As from water and soil ... 22
Table 2.14 - SWOT analysis of ED process ... 26
Table 2.15 - Vantages and limitations of microwave assisted acid digestion ... 29
Table 3.1- List of the reagents used for pH desoption tests ... 32
Table 3.2 – Experimental conditions used ... 34
Table 4.1 – Initial characterization ... 38
Table 4.2 - W recovery and As separation rate and compartment distribution ... 44
Table 4.3 - W recovery and As separation rate and compartment distribution ... 47
Table 4.4- Cost per assay ... 50
Abbreviations and symbols
[Fe/Mn]WO4 - Wolframite 2C - Two compartment cell 3C -Three compartment cell AN - Anion exchange membrane AsO3 -Trioxide arsenicCAT - Cation exchange membrane CaWO4 - Scheelite
CCA - Chromium copper arsenide CR - Collection rate
CRM - Critical raw materials DC - Direct current
ED - Electrodialytic EK - Electrokinetic
EOL-RR - End of life- recycling rate EPA - Environmental Protection Agency FeWO4 -Ferberite
GaAs - Gallium arsenide H3AsO3 - Arsenite H3AsO4 - Arsenate
ICP-AES - Inductively Coupled Plasma-Atomic Emission Spectrometry MnWO4 - Hübnerite
MT - Mine tailings
MTS - Mine tailings solution MTU -Maximum Transmission Unit Mw - Microwave
OSR - Old scrap recycling
RSD - Relative standard derivation STD - Submarine mine tailings disposal Ti - Titanium
1 Introduction
Mining activities are essential contributors to human wellbeing. As resource consumption increases, this industry becomes more important in the economy (Ma et al., 2017). However, mining processes generate huge amounts of waste that are placed in open dams causing negative environmental impacts. According to Lottermoser (2010), mining industries annually produce approx. 20 to 25 billion t of solid mine residues, from which 5 to 7 billion t are mine tailings (MT). This production tends to increase up to 14 billion t/year due to the future low ore grades (Mudd & Boger, 2013). MT are fine particles rejected from the grinding, screening, or processing of the raw material. It can be regarded as a secondary source, since these residues still have contents of the explored ores (Cuesta-Lopez et al., 2016).
Tungsten (W), for instance, is a stable transition metal with industrial and economic importance worldwide. Currently, there are several W applications, such as tools of steel, high-speed steels and creep-resistant steels (Lefebvreet al., 2016; Pacheco, 2017). However, W is part of the European Union list of 27 critical raw materials (2017), with high economic importance and high risk of supply interruption. According to Peng et al. (2014), to produce 1 t of W concentrate 9 t of W tailings are generated in low grade W minerals.
In Portugal, Panasqueira mine (Covilhã) has been active for more than 100 years and is one of the largest tin (Sn) - W deposits in Europe, with 9.7 Mt of ore resources (Candeias et al., 2014). In this sense, the study of technologies able to recovery W from MT are nowadays gaining importance, as well as the development of strategies that provides a way to channel by-products back into the value chain, contributing for a circular economy in Europe and in Portugal, in particular.
Arsenic (As) can also be found in these residues. It is a toxic metalloid to organisms at concentrations over 50 μg As/g in water, with a long term exposure (WHO, 2001a; Mandal, 2017) with harmful effects in public health, namely in cardiac and gastric systems (Jain et al., 2000; Chakraborti et al., 2002; Ng et al., 2003). According to Portuguese legislation (DL 152/17) As concentration in water for public consumption must be below 10 μg As/L. Therefore, efficient technologies to remove As from polluted matrices, such as MT, is essential for a safe storage and reuse of this source (WHO, 2001b).
The electrodialytic process (ED) consists on the application of a low level current density, either direct current or alternate current of a few mA/cm and a low potential gradient of V/cm, between suitably located electrodes (Acar & Alshawabkeh, 1993) in a contaminated matrix. The contaminants concentrate close to an electrode from where they are removed (Ribeiro & Rodríguez-Maroto, 2006). ED is applied to remove contaminants from porous matrices and it has been proved to be efficient for heavy metals removal from solid matrices, with removal rates over 80 % and low energy consumption (< 0.05 kWh/kg) (Velizarova et al., 2001; Hansen et al., 2004; Pedersen et al., 2017).
were tested to reach preliminary results of this treatment strategy.
Study objectives and research
This work carried out is the first attempt to develop an electro-based technology that is able to recover W and remove As from MT. The present dissertation proposes to answer the following questions:
1) Can the ED process be applied for W recovery from MT? 2) Is the ED process efficient for As removal from MT?
3) What are the material costs and the energy consumption of the targeted ED process?
To find answers to questions 1) and 2), laboratory experiments were carried out at RESOLUTION Lab using a MT sample from Panasqueira mine (rejected fraction from the sludge circuit that is directly pumped to the dam). The sample was submitted to the ED process in order to assess the W recovery and the As removal rates. Nine experiments were performed, some in duplicate, under different conditions, such as number of cell compartments, running time, current intensity, sample placement, type of ion exchange membranes and use of adjuvants. It should be stated that the adjuvants used in this dissertation are referred as A, B and C and not explicit due to intellectual property issues that still to be solved.
Finally, to answer question 3), the total energy consumption of the ED process was determinate by the consumption measurement of the pump, the stirrer and the power supply present in the ED scheme. An economic analysis of the process was completed, including material costs. The experiments feasibility was assessed considering the costs and the effectiveness of the process in W recovery and As removal.
Dissertation structure
The present work is organized in eight chapters:
1. Introduction - work scope and relevance, main objectives and structure;
2. Literature review - description of the central theme, relevant terminology and previous work developed;
3. Materials and methods - description of materials used, characterization analysis, identification and data treatment methods;
4. Results and discussion - presentation of results, hypotheses formulation and their discussion; 5. Conclusions – main outcomes;
6. Future developments; 7. References;
2 Literarure review
2.1 Mining industry
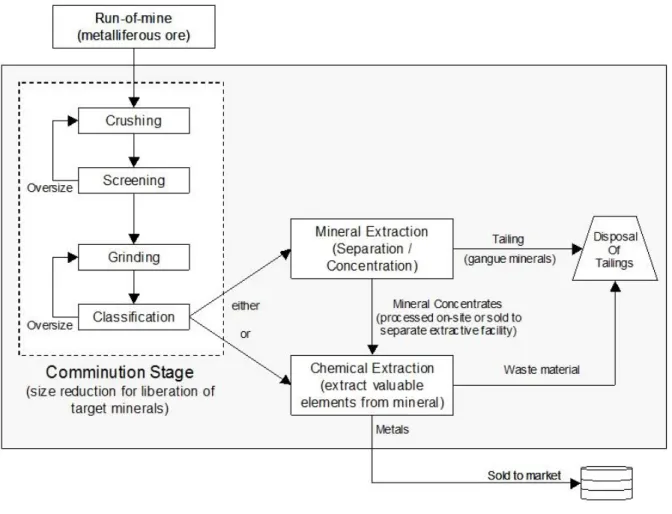
Resources consumption increases every year, becoming the mining industries one of the most important economic sectors worldwide. Hard rocks are worked to obtain ores with commercial value and, as a result of exploration, mining and processing of mine ores, MT are generated (Ma et al., 2017), as schematized in Figure 2.1. This by-product is removed from mineral ores and it is generally disposed in open-air tailings impoundments without any treatment (Cuesta-Lopez et al., 2016).
Figure 2.1- Mine processing scheme (Grewal, 2018)
MT predominantly consists of extremely fine particles rejected from the grinding, screening, or processing of raw material. Typically, this material ranges from sand to silt-clay in particle size (Cuesta-Lopez et al., 2016) and usually contains water, heavy metals (Wang et al., 2017) as well as other elements present in the exploited ore.
al., 2012). In addition, river beds can collapse or smothering, compromising ecosystem functions. According to the European Commission (2018), waste disposal from mining industries is massive.
Non-ferrous metals in mining industry may contain large quantities of hazardous substances. Metals and metal compounds tend to become chemically more available resulting in acid or alkaline drainage generation. This activity involves chemical residual processing and high concentration levels of metals, damaging the environment (European Commission, 2018).
Social, economic and further environmental considerations
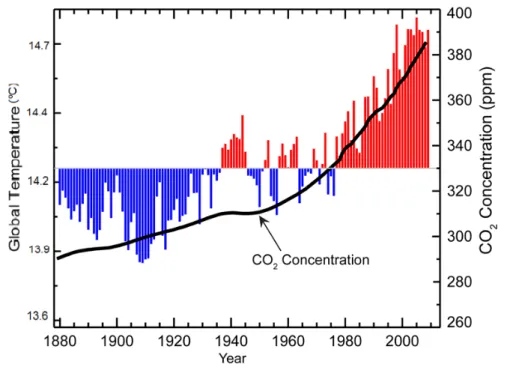
Since 1950, atmosphere and the oceans global warming has been observed, affecting ice poles and sea level. The main reason is due to an increase of greenhouse gas emissions, mainly carbon dioxide (CO2) (Smith et al., 2017).
Figure 2.2 shows a correlation between global temperature (ºC) and CO2 concentration (ppm). The continuous CO2 intensification is followed by an increase of the global temperature (Angel, 2017).
Figure 2.3 – Global greenhouse gas emission by sector (Ritchie & Roser, 2018)
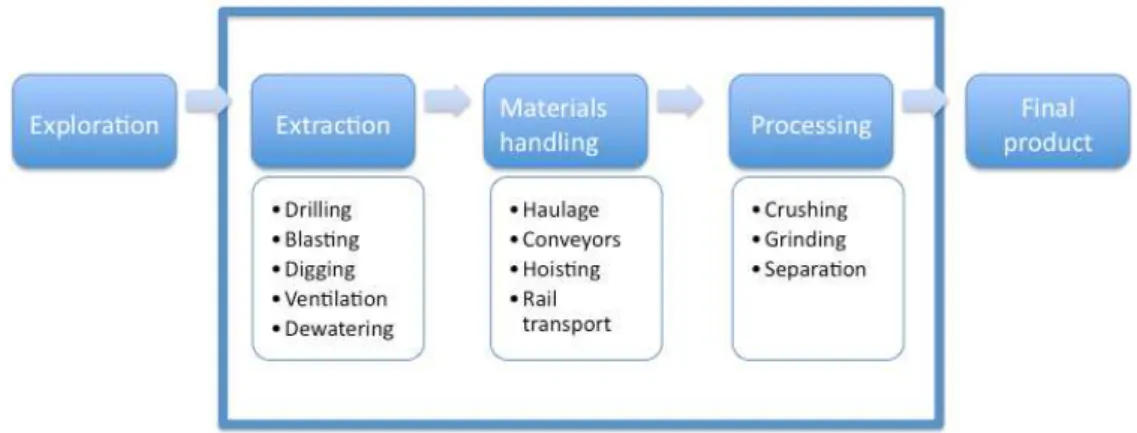
There are different types of mines: underground and surface mines. According to Holmberg et al. (2017), rock braking, crushing, grinding, loading, hauling and transportation are the activities where larger amounts of energy are dispended. Holmberg et al., 2017 estimated that mining and mineral industries worldwide use 4-7 % of the total global energy output. Considering Figure 2.4, there are three main operational categories in mining exploration. The highest energy consumption category is materials handling (42 %), followed by processing with 39 % and extraction with 19 % of representatively (Holmberg et al., 2017).
Figure 2.4 - Main operational categories in mining exploration (Adapted from Holmberg et al., 2017)
Figure 2.5 – Cost benefit analyses metodologie (Adapted from LNEC, 2015)
W mines in Europe
In Europe there are several mines with W reserves (tungsten trioxide, WO3) and economic interest (Table 2.1). Portugal has three of those reserves but only Panasqueira mine is active (Yang et al., 2016).
Table 2.1 - Synthesis of tungsten reserves in Europe (Yang et al., 2016;Ormonde, 2018; WResources, 2018)
Location Reserves (t) & % WO3 Status
England- Plymouth 35.7 Mt1 - 0.18 % WO3 Production estimated at 350,000 t/year of a tungsten concentrate with a grade of 65% WO3. Spain-
Los Santos 3.6 Mt1–0.23 % WO3 Originally opened in 2008 and produces W concentrate. Spain-
Barruecopardo 27.4 Mt
1– 0.26 % WO3 Production rate of 1,100,000 t per year, to produce 260,000 t of WO3 per year. Spain-
La Parilla 49 Mt
1 - 0.10 % WO3 Production rate of 1 200 to 1 300 t/year and a grade of 66 % WO
3. Spain- Valtreixal 2.5 Mt1– 0.34 % WO3 In exploration
Portugal-Panasqueira 4.91 Mt1 - 0.22 % WO3 Active since 1890 Portugal- Borralha 18,500 t - 0.29 % WO3 Closed since 1986 Portugal- Tabuaço 2.75 Mt1 - 0.57 % WO3 Closed
Austria- Salzburg 291,140 t - 0.65 %WO3 (1978)
The deposit was discovered in 1967.
Mining activities began in 1975, the ore dressing plant started operations in 1976.
11 Mt = 1,000,000 t
Identification
of objectives Feasibility analysis Finantial analysis Economic analysis comparationProject
Sensitivity and risks
Panasqueira mine
Panasqueira mine is an underground mine and one of the main Sn-W deposits in Europe. It is located in the center of Portugal, Covilhã, district of Castelo Branco (Figure 2.6). The surrounding area topography ranges between 250 to 1080 m in altitude with a deep valley (Candeias et al., 2014).
Figure 2.6 - Location of Panasqueira mine (Candeias et al., 2014)
Panasqueira mine have a secondary production of copper (Cu) and arsenopyrite (the main sulfide). These secondary products are discarded to the dams, which contain around 30 % of arsenic (As). This mine is active since 1896 and, between 1947 and 2001, 27 million t of rock were mined, corresponding to 92,800 t of W. The mineralogy of the surrounding area is characterized by wolframite, cassiterite, arsenopyrite, topaz, muscovite and tourmaline (Yang et al., 2016). This is an area with national interest once is where the W active mining is located and there are MT piles and mud dams nearby small villages and the Zêzere river also crosses this area (Candeias et al., 2014).
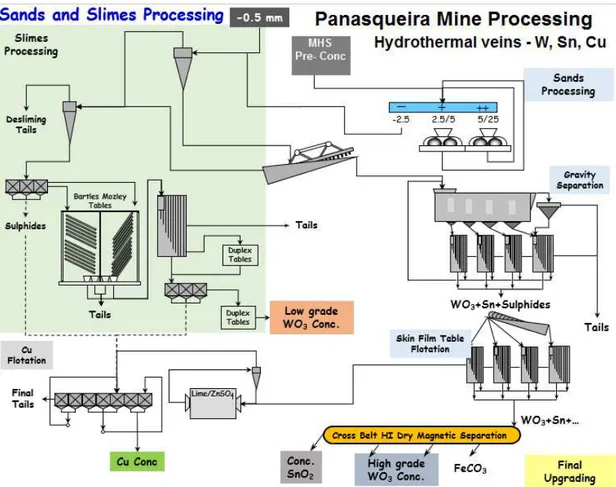
Figure 2.7– Processing plant of sands and slimes (Leite, 2017)
Currently, underground exploration, milling processes and MT piles account to approx. 7,000,000 m3. There are two ponds, one active and one inactive, located in Barroca Grande with 1,193,885 m3 of MT (Candeias et al., 2014). In Table 2.2 it is visible that Panasqueira mines have an extended life with a considerable annual production of MTU’s representing a good source of W.
Table 2.2 – Panasqueira mines characteristics (Adapted from Lefebvre et al., 2016)
Project Specifications
Company/ Operator & Stock Exchange Beralt Tin and Wolfram Portugal
Ore Resources Measured 9.54 Mt2
WO3 grade (%) 0.22
Operating Cost/ MTU1(€) 130-140
Annual Production MTU’S WO3 85,000 to 95,000
Mine life 10 years
1 Conversion factor: MTU = 10kg, therefore 100 MTU = 1 t WO3 contains 0,79 W. 21 Mt = 1,000,000 t
2.2 Tungsten
white lustrous metal (Figure 2.8) with the highest melting point (3683 K), the lowest vapor pressure (1 x 10⁻⁸ mm Hg at 2400 K) of all metals, withstands corrosion strength and at temperatures over 1650 °C (Bilewska, 2016) and the highest tensile strength of 100,000 – 500,000 psi at room temperature (PowerStream, 2017; Midwest Tungsten Service, 2018).
Figure 2.8 – Tungsten metal (CRM Aliance, 2016)
Magmatic-hydrothermal processes combined with granitic intrusions usually form W deposits. This type of deposits can be found within the peripheral part of the intrusive itself (greisen, porphyry, stock work and vein deposits), or in its vicinity (stock work, vein and skarn deposits). These deposits are often linked with tin or molybdenum mineralization (Schmidt et al., 2012).
The European Union (EU) revealed a list of raw materials with a high risk of scarcity and economic relevance in order to guarantee their safe, sustainable and economic exploitation (EU, 2017). The identification of 27 critical raw materials (CRM) by the EU Commission aims to encourage their production and the promotion of new innovative recycling methods and activities that may contribute to circular economy in Europe (EU, 2017). W was introduced in the EU CRM list in 2017, with an end-of-life recycling input rate of 42 %. The W EU main supplies are given by Russia (50 %), Portugal (17 %), Spain (15 %) and Austria (8 %) (EU, 2017).
Chemistry
Table 2.3 – Chemical and physical characteristics of W (NCBI, 2018)
General properties Physical properties Atomic
properties Cristal structure Element category Molecular weight (g/mol) Melting point (K) Boiling point (K) Heat of Vaporization (kcal/g-atm) Oxidation states Body centered cubic Transition
metal 183.84 3683 5803 1150
2-, 1-, 0, 1+, 2+, 3+, 4+, 5+, 6+
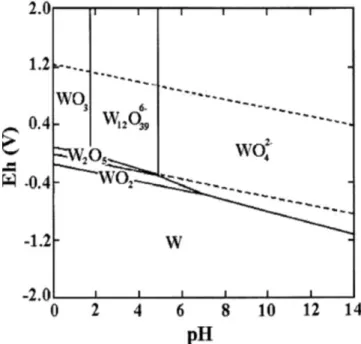
As shown in Table 2.3, W has nine oxidation states where the 6+ is the most stable. The speciation forms mainly emerge from an acid pH (Figure 2.9). WO3 is the most common form in the environment and is present in solutions with pH bellow 2. W has acid-resisting properties and is easily soluble in mixtures of HF and HNO3 (Flink & Jones, 1931). W can be transformed in complexes depending on its oxidation state. The main groups of complexes and resultant complexes are summarized in Table 2.4.
Table 2.4 – W complexes (Adapted Parish, 1966)
Type W oxidation state W complexes
Halides and oxyhalides
complexes W (V)
[WOxFx] x –; [WO3F2H2O] –
[WFx] –;[WOxClx] –
[WOBrx]x –; [WxBrx]x –
Cyano complexes W (IV); W (V); W (II); W(III)
[W(CN)4(OH)4]2 –
[W(CN)4(OH)3(H2O)]3 –
W(CO)6
Thiocyanato complexes W (IV); W(V)
WCl6 ; WOxClx
[W(OH)3(NCS)3]–
W(NCS)6 ; WO(NCS)x
In nature, W is found in primary minerals like scheelite (CaWO4), hübnerite (MnWO4), ferberite (FeWO4) or wolframite ([Fe/Mn]WO4) and its mobility increases under alkaline conditions (Schwertberger, 2016).
Figure 2.9 - Effect of pH on tugsten speciation (Flink & Jones, 1931)
Production
It is estimated that 87,000 t of mined W are extracted over the world annually. The principal W production takes place in China (82-85 %), Russia (5 %) and Canada (3.5 %). In Europe only four mines are still operating and one of them is in Portugal (Panasqueira, Covilhã). At Panasqueira mine, the ore deposit type is classical, with a content of ferberite or hubnerite mineralization. However, the total production of Panasqueira (Portugal), Los Santos (Spain), Mittersill (Austria) and Drakelands (UK) represents less than 1 % of the global production of W (Lefebvre et al., 2016).
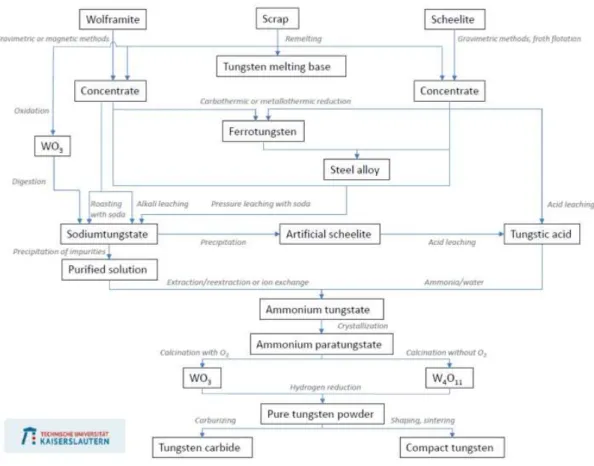
Figure 2.10. – W processing scheme (Oeqvist, 2016)
Applications
Throughout the world there are several applications of W. In 2010 there was a consumption of 71,000 t of virgin W and 95,000 t of secondary sources of W consumption including scrap (Lefebvre et al., 2016). Cemented carbides dominate the market due to applications in steel tools, high speed steels and creep-resistant steels (Lefebvre et al., 2016). W is mainly used for the production of hard materials (alloy and steel) based on tungsten carbide (WC) and less than 10 % is used in chemical compounds (Lambert, 2016)
W is an essential component for these tools manufacturing because of its high melting point, low coefficient of thermal expansion and lower vapor pressure than any non-alloyed metal. W is the heaviest metal with a gold-like density, a high modulus of compression, wear resistance, tensile strength and thermal and electrical conductivity (Bilewska, 2016).
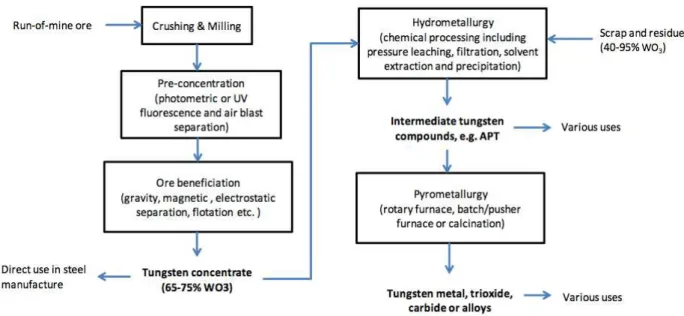
Figure 2.11- Stages of W processing for different materials (Yang et al., 2016)
WC represents a group of hard and wear resistant refractory composites where the hard carbide particles are bonded together by a ductile and resistant binder matrix. W has a high cost (20 € to 2,050 € per kg), being only used in operational parts for this reason. W is applied in mining, construction and metal-working (e.g. drill bits, machine tools for shaping metals, wood, composites, plastics and ceramics) (Bilewska, 2016; Midwest Tungsten Service,2018).
W is usually alloyed with high-speed steels which allows high productivity levels in metal curing. In superalloys, its high corrosion resistance is suitable for aerospace applications (Bilewska, 2016). Pure W mine products are used as light bulb filaments, vacuum tubes and heating elements. W powder is used in electric and electronic industries and some alloys include Cu and Ag for electrical contacts production (Bilewska, 2016).
Exportation
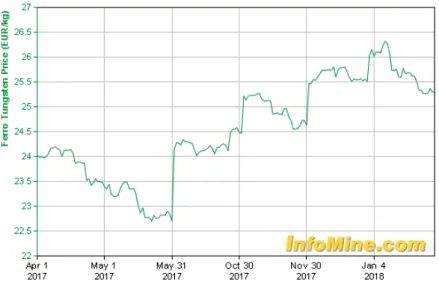
Figure 2.12 - Price variation of W (InfoMine, 2018)
In 2010, W ore reserves were estimated in 2.8 million t of W metal, where more than 60 % of these supplied were located in China. There were created new exportation restrictions during 2008 and 2013 and since 2015-2016 mines in Drakelands (UK) and Nui Phao (Vietman) became active (Lefebvre et al., 2016).
W can be substituted by other compounds, although in most applications there is a loss of performance or a cost increase. In WC, W can be replaced by Mo, Ti, ceramics depleted uranium or hardened steel (Bilewska, 2016). As show in Figure 2.13 the three major applications of W have a high cost and will affect materials performance if a replacement of W occurs.
Figure 2.13 - Tungsten replacement analysis (Bilewska, 2016)
Recycling
Table 2.5 - Tungsten recycling types (Adapted from Kurylak et al., 2016)
Type Specification
Home scrap Results during the material production. Its manufacture or fabrication can
be reinserted directly into the process
New scrap Results during fabrication and manufacturing. It cannot be recycled and it
is transferred to the scrap market
Old scrap Fragments in products that have achieved the end-of-life
Functional
recycling
The metal in a discarded product is separated and sorted to obtain recycled fractions which are returned to raw material production process generating metals or metal alloys
Non-functional
recycling
The metal is collected as old scrap and incorporated with a large-magnitude material stream as a tramp or impurity elements
Losses The metal is not completely captured by any of the previous recycling
flows
The recycle efficiency of a metal can be measured in three levels: Old scrap collection rate (CR); Functional recycling (EOL-RR: End-of-life – Recycling Rate) and Old scrap in the recycling flow (OSR) (Kurylak et al., 2016). According to the same authors (Kurylak et al., 2016), W has the highest recycling efficiency when old scrap is introduced in the flow (Table 2.6).
Table 2.6 – Recycling efficiency (Kurylak et al., 2016)
Refractory Metal Functional recycling (%) Old Scrap collection rate (%)
Old scrap in the recycling flow (%)
W >10-25 >25-50 >50
W in scrap represents about 30 % of W from primary and secondary raw materials. The W-bearing scrap can be categorized as new scrap during the production of these materials and consumption and old scrap when the product reaches its end-of-life. The new scrap is collected because it cannot be recycled inhouse and old scrap is recycled depending on scrap availability from the collection system. Predominant recycled scrap includes cemented carbide scrap, heavy metal steel/alloy scrap and mine products from metal powder scrap, which are basically in accordance with the primary use (Kurylak et al., 2016).
and so far there is no efficient way to collect them (Kurylak et al., 2016).
Methods to recover W
There are various methods to process WC scrap and to recover W, such as the hydrometallurgical route, oxidation and electrochemical process. In the hydrometallurgical route, WC is immersed into leaching agents to dissolve the matrix. The main advantages of this process are the directly production of metal carbide and the low number of operations involved, saving time and energy (Katiyar et al., 2014). Table 2.7 shows some examples done after hydrometallurgical route to recovery metals from WC scrap.
Table 2.7- Hydrometallurgical processes for metals recovery from WC scrap (Adapted from Katiyar et al., 2014)
Leaching agent Temperature (ºC) Type of scrap Recovery/product
Glacial acetic acid 118 Cemented carbide scrap WC powder
HCl 140-195 Cemented carbide scrap W metal
H2SO4 160-330 Scrap of cemented W metal
HCl 55-85 Scrap of cemented W
NaOH 120 Metal carbide scrap WC
Table 2.8 - Thermal oxidation methods for treatment of WC scrap (Adapted from Katiyar et al., 2014)
Type of scrap Temperature (ºC) Process
Hard metal Heavy metal WC alloys
900 W is recovered using molten salt mixture of hydroxide and sodium sulfate.
Cemented WC 825
Oxidized product digested in 20-40 % alkali metal hydroxide to form alkali metal
tungstate
W containing materials 680-700
Oxidation with sodium nitrate and leached with CaCl2 and form crystalline calcium tungstate. Tungstic acid formed by 80-180 gpl HCl leaching.
WC 600-1050 Dissolution in solution of NaOH followed by
spray drying to form precursor compound
In the electrochemical process the scrap acts as anode and graphite or platinum are used as cathode (Katiyar et al., 2014). Table 2.9 shows the different conditions used in this process to obtain W.
Table 2.9 - Electrochemical processing for WC scrap recycle (Adapted from Katiyar et al., 2014)
Types of scrap Electrolyte Current density Recovery/product
W alloy NaOH 250 /Am
2
450 /Am2 90 % W dissolution
W NaOH 2.74 /A.cm2 Tungstate
WC 6 % cobalt alloy H3PO4 - Co and W
Scraps of sintered
metal carbide HNO3 - Co and W
Hard metal scrap 10 % HNO3 - WO3
Cemented carbide
WC-87 % HNO3 - W and Co
WC scrap Aqueous ammonia - Co metal and WO3
2.3 Arsenic
Arsenic can be found in a range between 1.5 to 3 mg/kg (Mandal & Suzuki, 2002), being the 20th element
more abundant in earth’s crust (NAS, 1977 in WHO, 1981) and the 12th element more abundant in the human body (Mandal & Suzuki, 2002). However there are natural or man-made sources as identified in Figure 2.14.
Figure 2.14 - Identification of natural and man-made sources os As (Correia, 2008).
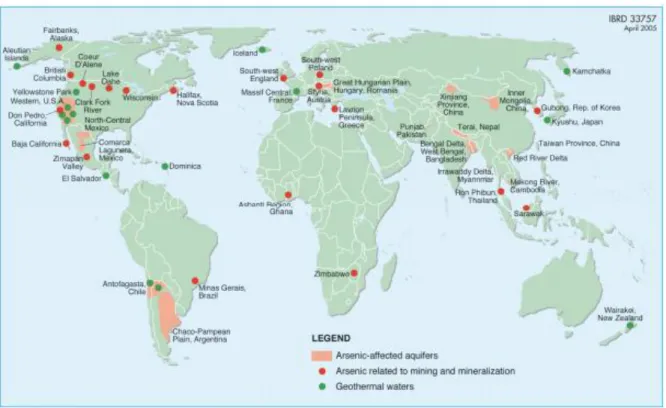
Arsenic contamination in natural waters is the main concern on a global scale (WHO, 2001b). Figure 2.15 shows several countries where As incidents have been reported due to mining and mineralization, e.g. Bangladesh, West Bengal (India), inland of Mongolia (China) and Taiwan (Jain et al., 2000; Chakraborti et al., 2002; Ng et al., 2003).
Figure 2.15 - Wolrd distribution of As contaminations and sources (Correia, 2008)
Natural resources
Soils
Sediments and rocks
Geothermal activity
Volcanic activty
Man-maid
Agriculture
Industry
Arsenic is not only harmful to the environment but also for public health because of its toxicity and its bioaccumulable behavior through the food chain (WHO, 2001a). WHO targeted a limit in 1993 of As concentration in water for human consumption below 10 μg As/L and in 2007, Portugal also targeted this value (Decreto Lei nº 152/17 of 7th Dezember, from Ministério do Ambiente, 2017).
The inhalation and ingestion of As causes acute and severe toxic effects. The consequences of the exposure to As are cardiac and hypertension problems. Since the major concentration of As is in the water for consumption, gastric problems are also associated. In long-term exposition, problems in the kidney and liver can appear since these organs perform the function of filtering and excreting the residue of the liquid phase (Correia, 2008).
Figueira et al. (2007) carried out a study to evaluate the As exposure risk in Portugal. The authors concluded that the places where As concentration in drinking water was over 10 μg/L were in the north-east and interior center. This conclusion was related to the high number of groundwater abstractions, predominantly granite or schist lithology and to quartzite rocks (Matschullat, 2000 in Figueira et al., 2007). In the north of Portugal, quartz is often associated with sulfur minerals, which can contain high levels of As and be easily leached (Morgada et al., 2008).
High concentrations of As may also occur in areas close to mining activities, even if they are no longer active. The drainage water from the mines and the residues are typically acid and it may contain levels of dissolved As up to 48,000 μg/L (Welch et al., 1988 in EPA, 2000b).
Chemistry
Table 2.10 summarizes chemical and physical properties of As. Its leaching behavior is one of the major mechanisms by As can enter in the ecosystems harming the environment and humans.
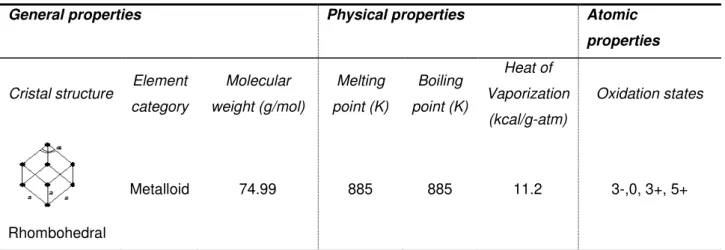
Table 2.10 – Chemical and physical characteristics of As (NCBI, 2018)
General properties Physical properties Atomic
properties
Cristal structure Element category Molecular weight (g/mol) Melting point (K) Boiling point (K) Heat of Vaporization (kcal/g-atm) Oxidation states Rhombohedral
Metalloid 74.99 885 885 11.2 3-,0, 3+, 5+
Elementary arsenic is not soluble in water, but inorganic As trivalent and pentavalent have a solubility of 37 g/L at 20 ºC and 302 g/L at 12.5 ºC, respectively (Danish Ministry of the Environment, 2014). In soil, As can form insoluble complexes with iron, aluminum and magnesium oxides. This type of arsenic, mixed with insoluble complexes, is immobile, although in the reduction state the arsenite is predominant and the complexes formed are mobile (Danish Ministry of the Environment, 2014).
Figure 2.16 - Effect of pH on arsenic speciation (Nicomel et al., 2016)
Production
The largest producers of As are China, Russia, France, Mexico, Germany, Peru, Namibia, Sweden and the United States of America. These countries hold about 90 % of world production as can be seen in Table 2.11 (WHO, 1981; Nelson 1977 and US Department of the Interior Bureau of Mines, 1973 in Mandal & Suzuki, 2002; Edelstein, 201).
Arsenic Trioxide (AsO3) is recovered from the smelting or baking of non-ferrous minerals ore or concentrates. However, dust and smelting residues with high As concentrations in hot air are normally processed for commercial AsO3 (Reese, 2000).
Table 2.11–Principal producers of As (Adapted from Edelstein, 2016)
Countries Production of AsO3 (t)
2014 2015
China 25,00 25,000
Morocco 8,800 8,500
Russia 1,500 1,500
Applications
Trade data indicates that USA, with an estimated demand of more than 24,000 t in 2000, will probably remain the world’s largest consumer of As. More than 95 % of the As consumed was estimated to be in its primary form AsO3, for the production of wood preservatives. However, As is also applied to herbicides for weed control, as a metalloid additive to improve corrosion resistance and tensile strength in copper alloys, and as a minor additive to increase the strength of posts and grids in lead-acid storage batteries (Reese, 2000). Table 2.12 presents As main applications.
Table 2.12- Principal applications of As in different sectors (Adapted from Correia, 2008)
Sector Uses
Wood Wood preservatives
Agriculture Insecticides, fungicides and other pesticides, defoliants, peeling agents
Agro-livestock and poultry farming
Food additives, disease prevention agents, anti-parasites, algicides
Medicine Anti-syphilitic drugs, chemotherapy, treatment oftrypanosomiasis, amoebiasis and sleep disease
Industry
Glass, electrophotography, catalysts, pyrotechnics, dyes and soaps, ceramics, pharmaceutical substances, alloys (automotive welding and radiators), battery plates, solar cells, light emitting diodes on digital watches
Recycling
Arsenic can be recycled from the manufacture of gallium arsenide (GaAs), semiconductors and water from wood treatment, where it is used as chromium copper arsenide (CCA). Although boards, relays and circuit breakers may contain As, recycling is a difficult process because As is mixed with other metals (Edelstein, 2016).
Methods to remove As
Table 2.13 – Methods to remove As from water and soil (Adapted from Shrestha, 2011; Lim et al. 2014)
Water Soil
Method Resume Method Resume
Oxidation Conversion of arsenite into arsenate by oxidation with oxygen (O2), hypochlorite (HClO),
permanganate (HMnO4) and hydrogen peroxide (H2O2).
Soil washing Contaminated soil washed with different concentration of chemicals such as sulfuric acid, nitric acid, phosphoric acid, and hydrogen bromide. Coagulation Precipitation: formation of
insoluble compounds;
Co-precipitation: incorporation of soluble As species into a growing metal hydroxides phases;
Adsorption: electrostatic binding of soluble As to external surfaces.
Additives (surfactants, co-solvents, etc.)
Improves the efficiencies of soil flushing using aqueous solutions as water solubility is the controlling mechanism of contaminant dissolution.
Ion exchange A pre-oxidation converts arsenite into arsenate and since the ion exchange process is less dependent on pH of water arsenate is removed.
Coagulation and filtration
This method is economic but often displayed efficiencies <90 %
Membrane techniques
Low-pressure membranes such as microfiltration and
ultrafiltration;
High-pressure membranes such as nanofiltration and reverse osmosis. This process depends on pH and the presence of other.
Intrinsic bioremediation
The degradation of As occurs by naturally
occurring microorganisms. More suitable for
remediation of soil with a low level of contaminants.
Engineered bioremediation
Optimization of the environmental conditions to promote the proliferation and activity of
2.4 Electrodialytic process
The electrodialytic (ED) process has proved to be an efficient method to remove metals from solid porous matrices (Hansen et al., 2004). ED process is commonly applied to remove metals and results from a combination of charged species movement (electrokinetic process) and electrodialysis (Ribeiro & Rodríguez-Maroto, 2006).
In the electrokinetic (EK) process a low level direct current (DC) is applied, passing by a pair of electrodes in a system with charged particles and promoting the movement of contaminants (Guedes et al., 2014). The dislocation of particles happens because of mainly three mechanisms: electromigration, electroosmosis and electrophoresis (Ribeiro & Rodríguez-Maroto, 2006).
The main difference between ED and EK processes are the use of ion exchange membranes to separate the contaminated matrix from the electrodes compartments: ED uses them while EK uses passive membranes instead (Ribeiro & Rodríguez-Maroto, 2006).
In a three compartment ED cell (3C), the electrodes are placed in the compartments at both ends where the electrolyte solutions circulate (Figure 2.17). The contaminated matrix is placed in the central compartment separated by ion exchange membranes. The anion exchange membrane (AN) separates de anode from the central compartment, and a cation exchange membrane (CAT) divides the central compartment from the cathode end, allowing the passage of anions and cations, respectively (Guedes et al., 2014). The use of ion exchange membranes increases the efficiency of removal because the membranes have good conducting properties, decreasing power consumption and providing good chemical stability over an extensive pH range (Ribeiro & Rodríguez-Maroto, 2006).
Figure 2.17- Schematic representation of the three compartment electrodialytic cell (3C).
AN – anion exchange membrane; CAT – cation exchange membrane
Electromigration
The migration flux, Jm is given by:
𝐽𝑚 = 𝑢 ∗ 𝜙𝑒 (2.1)
Where:
u* and c are respectively the ionic mobility and concentration of species, and Φe the gradient of electric potential.
The current efficiency of electromigration of specific ionic species is expressed as the proportion of electrical charge carried by the species of interest, relative to the amount of charge carried by all charged species in solution (Ribeiro & Rodríguez-Maroto, 2006). This is the most important transport mechanisms for ions in porous media. The electromigration flux is dependent on the ionic mobility, tortuosity factor, porosity of the material and ions charge (Acar, 1993).
Electroosmosis
Electroosmosis describes the mass flux of pore fluid relative to soil particles under the influence of an electric potential gradient (Ribeiro & Rodríguez-Maroto, 2006). This mechanism is more efficient in the removal of uncharged and/or weakly dissociated organic contaminants, such as phenols (Ribeiro et al, 1999).
When an electric field is applied in a wet matrix, the flow-direct usually promotes the movement of cations in direction to the cathode and anions to the anode. When the ions migrate, they carry their water of hydration and they exert a viscous drag on the pore fluid around them (Ribeiro & Rodríguez-Maroto, 2006).
Electromigration of species usually occurs from the anode to the cathode because the species diffuses in a double layer that is often positively charged, e.g. soil. However, if there is a low range of pH values, the charge is performed in opposite direction, which can cause a change in the electroosmotic flow (Jensen, 2005; Ribeiro & Rodríguez-Maroto, 2006).
The electroosmotic flux, Jeo, is described by the following equation:
𝐽𝑒𝑜 = −𝑘𝑒𝑐𝜙𝑒 (2.2)
Where Ke is the electroosmotic permeability of soil, c the concentration of species, and Φe the gradient of electric potential.
The electroosmotic transport of water should be low to ensure the matrix volume to maintain a wet interface between the soil and the membrane (Ribeiro & Rodríguez-Maroto, 2006).
attracted to one electrode and replied by other. The negative charged particles move towards the anode end and the positive charged towards the cathode end (Ribeiro & Rodríguez-Maroto, 2006).
Diffusion
Diffusion is the movement of species under a chemical concentration gradient in porous media and free solutions. The diffusion can be expressed by Fick’s law, where its coefficient must be obtained by correction, considering the porosity and the tortuosity effects. This can decline the movement in more than one order of magnitude (Ribeiro & Rodríguez-Maroto, 2006).
The diffusive flux in soils, Jd, is given by:
𝐽𝑑 = −𝐷 ∗ 𝛻𝑐 (2.3)
Where:
D* – Effective diffusion coefficient
𝛻𝑐 - Concentration gradient
Usually this is a secondary transport and can be important only in some areas of the soil where the gradients are higher (Ribeiro & Rodríguez-Maroto, 2006).
Electrodialysis
Electrodialys is a movement derivate from the presence of exchange membranes. As CAT and AN are permselective, their use increases transport efficiency of species from the cathode or anode. The flux of the electrolytes does not circulate between the two electrodes compartments and the matrix is continuously emptied of anions and cations, until there are no ions to be transported. The resistance will increase until a certain level and then it will become constant (Ribeiro et al, 1999).
The membranes should have a high exchange capacity to maximize the fluxes of counter-ions and minimize electrical resistance, high selectivity for opposite charged ions and high permeability in order to save electricity during the transportation (Ribeiro & Rodríguez-Maroto, 2006).
Reactions in the electrode compartments
In an ED cell, the electrolyte can be continuously recirculated in a closed system, through a peristaltic pump (Guedes et al., 2015). The reactions at the electrodes are key factors for the variation of pH values. Therefore, the electrodes must be inert (e.g. carbon, platinum or titanium) to guarantee that they will not take part in the electrode reactions (Nystrøm, 2001).
Anode: 2H2O O2 + 4H+ + 4e- (2.4)
Cathode: 4H2O-+4e 2H2 + 4OH- (2.5)
If chlorides are present in the electrolyte (anolyte), chloride gas is produced.
Anode: 2Cl- Cl2 + 2e- (2.6)
SWOT analysis of the ED process
The ED process has benefits and limitations. To analyze the main outcomes of this process, a SWOT (strengths, weaknesses, opportunities and threats) analysis was carried out, as seen in Table 2.14.
Table 2.14 - SWOT analysis of ED process (Adapted from Gardner, 2005 in Almeida, 2015)
2.4.2 Metal speciation of MT from Norway before and after electrodialytic extraction
sequential extraction to measure how metals are bounded in sediments/ soils, considering that these sediments are from the old and new deposit (Pedersen et al., 2017).
To analyze the concentration of Al, Ba, Ca, Fe, K, Mg, Mn, Na, P, As, Cd, Cr, Cu, Ni, Pb and Zn, the sediments were dried at 105 ºC (1.0 g) and HNO3 (9 M, 20 mL) was added prior to be submitted to a digestion process (Norwegian standard NS4770) at 200 kPa, 120 ºC during 30 min. Then solid particles were removed by vacuum filtration and the liquid was diluted to 100 mL. The liquid was evaluated by Inductively Coupled Plasma - Optical Emission Spectrometry (ICP-OES) to measure metal concentrations. The conductivity was measured after drying the sediments and then mixed with distilled water for 1 h. After it was used a radiometric analytical electrode to analyze the parameter (Pedersen et al., 2017).
For these experiments it was used two different setup cells, both with two compartments to perform electrodialysis extraction as represented in Figure 2.18. This configuration was chosen to explore electrodes reactions to ensure acidifying (A) or alkalifying (B) the suspension. The acid/base extraction was made with 10 samples of dried sediment (5 g) with HNO3 (25 mL) or NaOH (25 mL) in different concentrations and in constant stirrer (Pedersen et al., 2017).
Ion-exchange membranes were used to prevent transport of ions between the two cell compartments, and the application of a CAT in the acidifying electrodialysis cell prevented the hydroxyl ions from the electrolysis reaction on the cathode from entering the suspension. By applying an AN in the alkaline electrodialysis cell, protons from electrolysis reactions on the anode were similarly prevented from entering the compartment with the suspension (Pedersen et al., 2017).
Figure 2.18–Electrodialysis. A: acidic electrodialysis B: alkaline electrodialysis (Pedersen et al., 2017)
This study shows differences in metal concentrations between the fresh tailings and the aged sediments. This happens because the origin of rock can be different. The electrodialytic extraction is significant in fresh tailings but not in the aged ones, since there are presently no prospects of dredging and treating of the aged sediments. Tailings have high concentrations of carbonates. Thus, the time needed to acidify the matrix is more extensive than to alkalify the tailings (Pedersen et al., 2017).
These experiments demonstrated highest removals of metals in the acidic electrodialytic treatment. In the alkaline electrodialysis most of the dissolved metals (>90 %) were found in the cathode compartment, demonstrating that metals can form complexes. In the anode compartment were found 97 % of the Cu, 60–85 % of Fe, Mg and Mn, 30 % of the Cr, and 2 % of the Al. In the acidic electrodialysis, approximately 30 % of the metals in the liquids are kept in suspension because of the fast change in pH, promoting the dissolution of carbonate (pH <4) and resulting in large amounts of desorbed metal that did not pass across the ion exchange membrane. In the cathode compartment, 15 % of the Cu, 30 % of the Mg, 60 % of Mn and less than 3 % of Al, Fe was found (Pedersen et al., 2017).
The electrolysis reactions at the anode end provided oxidation conditions and resulted in the release of metals bound in sulfides. Extracting Cu from the recently processed MT by alkaline and acidic electrodialysis improves mobilization and affects minerals stabilization in the tailings to a lesser degree. This indicates that the electrodialysis can be designed for targeted removal of Cu, while limiting the mobilization of other metals from the tailings (Pedersen et al., 2017).
2.5Analytic techniques
2.5.1 W and As determination
Microwave assisted acid digestion
According to Environmental Protection Agency (EPA), the method 3051 A was designed to mimic extraction using conventional heating with concentrate nitric acid (HNO3), or nitric acid and hydrochloric acid (HCl). This technique provides a multi-element extraction for further application of spectroscopic methods, such as inductively coupled plasma – atomic emission spectrometry (ICP-AES) (EPA, 2007).
Table 2.15 - Advantages and limitations of microwave assisted acid digestion (Adapted from: Yanget al., 2017)
Advantages Limitations
Short term technique. Insufficient extraction selectivity.
Multi-sample digestions. Extract must be separated from the "post-extraction residue".
Precision on a range of low abundance elements.
It is necessary to carry out a cleaning program.
Automatic operation. The cooling time of the bottles can be long.
Does not generate acid steam.
Inductively coupled plasma- atomic emission spectrometry
Inductively coupled plasma- atomic emission spectrometry (ICP-AES) allows a multi-element analysis. This analysis is conducted under a reduced number of samples, low reagent needs and low waste generation. With this technique it is also possible to analyze different metals contents in simultaneous, improving the sample throughput (Martínez et al., 2018).
ICP-AES can analyze dissolved samples, varying from solutions containing high salt concentrations to diluted acids. The source used to dissociate the sample into its constituent atoms or ions is based on the exciting of ions to a higher energy level. When the compounds return to their ground state, they emit photons with a characteristic wavelength, which depends on the present elements. The emitted wavelength is recorded by an optical spectrometer (Philips, 2013).
Ionic Chromatography
The process of chromatography using ion exchange is based in an eluent loading, sample injection, sample separation, elution (movement thought the column) of analyte A and elution of analyte B (Wenzel, 2018).
3 Material and methods
The Figure 3.1 represents the methodology applied for the dissertation experimental work. In this chapter all the materials and methods used are presented.
Figure 3.1 – Applyed methodology
3.1 Initial characterization
pH desorption
Table 3.1- Reagents used for pH desoption tests
Reagents
NaOH concentration (M) HNO3 concentrations (M)
1.0
0.5
0.05
0.01
1.0
0.7
0.5
0.3
0.1
0.08
0.05
0.01
Conductivity
The conductivity of the samples depends on the number of conductive particles present in the liquid phase. To determine the conductivity, 5 g of the sample were mixed with 12.5 mL of H2O and then placed in a shaking table for 24 h at room temperature. After shaking for 24 h, the conductivity of the samples was measured with a Horiba Iaquatwin equipment, in mS/cm.
Quantification of W and As content
To quantify the initial content of W and As microwave assisted acid extraction was done according to EPA method 3051 A. Thus, 0.5 g of MT were placed in a vessel with 3 mL of HCl and 9 mL of HNO3 and placed in a microwave from Milestone Ethos (Bergamo, Italy). At the end, the samples were diluted (1:25) and filtered by vacuum using 0.45 μm filters. As and W concentrations were determined by ICP-AES analysis, as explained in the section 2.5.1.
Chlorides and sulfates content
To quantify the content of chlorides and sulfates, 5 g of MT were mixed with 25 mL of deionized H2O and then placed in a shaking table for 24 h, at room temperature. The samples were after filtered by vacuum, using 0.45 μm filters and further analyzed in ionic chromatography (DIONEX ICS-3000 equipment).
3.2 Electrodialytic experiments
ED laboratorial cell
Herfoelge, Denmark). Commercial cation and anion exchange membranes (AR204 SZRA B02249) from ionics were also used to separate the compartments. The compartment where the sample was placed was also equipped with a stirrer. Figure 3.2 schematically represents the ED cell setups tested in the present dissertation.
Figure 3.2 – Schematic representation of the ED cell: 1 - Ion exchange membrane; 2 - Stirrer; 3 - Electrodes (+ anode; - cathode; 4 - Recirculation system of electrolytes. A) Two compartment cell with a anion exchange membrane (1.b); B) Two compartment cell with an cation exchange membrane (1.a); C)
Three compartment cell
A
B
C
I- Anode compartment (Electrolyte); II- Cathode compartment (MT)
I- Anode compartment (MT); II- Cathode compartment (Electrolyte)
To maintain a constant current a power supply was used (Hewlett Packard E3612A, Palo Alto, USA) and the voltage was monitored (Kiotto KT 1000H multimeter). Before each experiment new electrolyte was prepared (10-2 M NaNO3 with pH 7). During the experiments, the electrolyte recirculated in the anode compartment (Figure 3.2 A) or in the cathode compartment (Figure 3.2 B) in a 2C ED cell, and in the anode and cathode compartment in a 3C ED cell (Figure 3.2 C). A peristaltic pump was used (Watson-Marlow 503 U/R, Watson-Marlow Pumps Group, Falmouth, Cornwall, UK) to ensure the constant recirculation of the electrolyte (3 mL/min).
ED experiment conditions
The MT compartment was field with 39 g of sample and 350 mL of deionized H2O (L/S=9). A funnel was placed in the stirrer hole and the mixture was poured through it. Table 3.2 summarizes the experimental conditions carried out. Nine experiments were performed (some in duplicated) with different current intensities, cell setups, agents added to the sample and time. All the experiments were performed in a fume hood at room temperature.
The experiments were carried out in two stages, aiming the highest W recovery and As removal. First, the best configuration cell setup was chosen from the three tested ones (E1-E3). In a second step, three different adjuvants A, B and C, intentionally not specified due to intellectual property issues, were added to the MT solution to study the elements solubilization rate (E4-E7).
Table 3.2 – Experimental conditions used
Experiment Current (mA) Cell setup Agent added Time (days) n
Control 1 0 Figure 3.2 A H2O 10 2
Control 2 0 Figure 3.2 B H2O 14 2
E1 100 Figure 3.2 B H2O 14 2
E2 1 Figure 3.2 C H2O 14 2
E3 50 Figure 3.2 A H2O 7 2
E4 100 Figure 3.2 B Adjuvant A* 10 1
E5 100 Figure 3.2 B Adjuvant B* + H
2O
10 1
E6 100 Figure 3.2 B Adjuvant C* 14 1
E7 100 Figure 3.2 B Adjuvant A* + H
2O
10 1
*Adjuvants A, B and C are not explicit due to intellectual property issues still to be solved.
At the end of each experiment, the volume (mL) of the electrolyte was measured. The MT compartment content was dropped in to a beaker and weighted. The MT mixture was filtrated under vacuum to separate the solid (MT) from the liquid phase (water or adjuvant). Then, the liquid phase volume was also measured and reserved to posterior analysis in ICP-AES. The solid phase was also weighted and dried at room temperature for one week. Afterwards, microwave-assisted extraction was applied to the dried samples and the resulted liquid was analyzed in ICP-AES.
The membranes and electrodes were soaked in HNO3, 1M and 5M, respectively, for 24 h to promote the removal of W and As that was attached. Then, the volumes of acid were measured, and the mixture was filtrated under vacuum to remove the solid content. The liquid was reserved for further analysis in ICP-AES.
3.3Analytical methodologies
Microwave assisted acid extraction
According to EPA method 3051 A, the determination of W and As concentration in the solid (MT) was done by mixing 9 mL of HNO3 and 3 mL of HCl with 0,5 g of dry sample. Using a Microwave from Milestone Ethos (Bergamo, Italy), it was set a program with a length of 45 min that achieves 195 ºC and 10 bar in 15 minutes. Then, the temperature and pressure are kept constant for the following 15 minutes. During the last 15 minutes, the system returns to normal conditions and, at the end, the samples were collected from the microwave, filtered through a filter (pore size 0.45 μm) and diluted for further analysis in ICP-AES.
Inductively coupled plasma- Atomic Emission Spectrometry
As explained in chapter 2.5.1, this method allows a multi-element analysis of different metals, improving the sample throughput (Martínez et al., 2018). The ICP-AES Horiba Jobin-Yvon Ultima, equipped with generator RF (40,68 MHz), monochromator Czerny-Turner with 1,00 m (sequential), automatic sampler AS500 and dispositive CMA (Concomitant Metals Analyser), was used to analyse W and As (mg/L) in all liquid samples obtained at the end of each experience (liquid phase, electrolyte, extraction from solid phase). This method has detection limits for W and As quantification of 15 ± 7 µg/L and 8 ± 3 µg/L, respectively.
Ionic Chromatography
3.4Statistical analysis
4 Results and discussion
4.1Initial characterization
As reviewed in chapter 2.1, MT ranges from sand to silt-clay in particle size and the sample studied has a silt-clay texture (Figure 4.1). Therefore, Panasqueira MT are characterized by low permeability, poor aeration, high plasticity and high adhesiveness when wet and toughness when dry (Gerard, n.d.).
Figure 4.1 – Sample of Panasqueira MT (sample kindly provided by Professor José António Almeida from DCT NOVA)
As shown in Figure 4.2, the composition of the MT is predominantly characterized by silica (22.91 %), sulfur (15.61 %), iron (13.59 %), aluminum (9.68 %) and potassium (4.77 %). The elements in study have a representation of 0.94 % and 0.23 % of As and W, respectively.
Figure 4.2 – Panasqueira mines MT composition (results kindly provided by Professor José António Almeida from DCT NOVA)
To verify how different conditions may influence MT remediation process, an initial characterization of Panasqueira MT samples was carried out at RESOLUTION Lab and the W and As content, pH, conductivity, chlorides and sulfates are summarized in Table 4.1.
9,68 22,91 0,62 15,61 4,77 0,72 1,00 0,04 0,17 13,59 0,00 0,43 1,38 0,94
0,10 0,02 0,23 0,02
0 5 10 15 20 25
Al Si P S K Ca Ti Cr Mn Fe Ni Cu Zn As Rb Sr W Pb
Table 4.1 – Initial characterization
Parameter Value
W content (mg/kg) 496.7 ± 66.8 As content (mg/kg) 3657.7 ± 444.5
pH 4.5 ± 0.9
Conductivity (mS/cm) 0.4 ± 0.3 Chlorides (mg/kg) 0.1 ± 0.1 Sulfates (mg/kg) 5.4 ± 0.1
MT samples without treatment have As contents of 3658 ± 445 mg/kg, while W shows lower amounts (497 ± 67 mg/kg), being these samples also characterized by low conductivity (0.37 ± 0.32 mS/cm).
The content of chlorides and sulfates was analyzed and, as explained in chapter 2.2, chlorides ions stabilize W and sulfate ions create modifications at metallic W electronic structure (Parish, 1966), influencing the electrochemical efficiency. As show in Table 4.1, sulfate contents are higher than chlorides. Thus, a low percentage of W recovery is expected due its interaction with sulfates.
4.1.1 pH desorption
Desorption tests were carried out in order to understand W and As desorption from the MT sample. Figure 4.3 and 4.4 show, respectively, W and As concentration in the aqueous phase in function of pH. There are pH ranges where W and As concentration desorption is higher.
These tests demonstrated that W desorption from MT was higher at low pH (0.31), where 12.89 mg/L were solubilized. On the other hand, As desorption from MT archived a maximum at a pH value of 0.62, where 649.7 mg/L were solubilized. However, it is visible a rise of pH desorption curve at alkaline solutions with a maximum of 14.43 tested.
Figure 4.3 - W pH desorption Figure 4.4 - As pH desorption
As reviewed in chapter 2.2, AsO3 and WO3 are the most common forms of As and W in MT, respectively, 0 2 4 6 8 10 12 14
0 5 10 15
Con cen tra tion (m g/ L) pH 0 100 200 300 400 500 600 700
0 5 10 15